Amgen Rebounds from Key Moving Averages as Uptrend Holds FirmAmgen is attracting renewed buying interest after rebounding from its 20-day and 50-day moving averages. The stock remains in a strong uptrend, continuing to make higher highs and higher lows while trading above well-aligned 20-day and 50-day moving averages.
Amgen, Inc. is a $209 billion market-cap biotechnology company focused on the discovery, development, manufacturing, and marketing of innovative human therapeutics across multiple disease areas.
AMGN is a wide economic moat company that h
In-depth trading ideas
Amgen Bases as Healthcare RampsHealth care stocks have been coming to life, and some traders may see an opportunity in drugmaker Amgen.
The first pattern on today’s chart is the basing pattern between $320 and $330. It also occurred along the 200-day simple moving average (SMA), which could be consistent with a longer-term uptrend.
Second, prices spent more than two months below the 50-day SMA but are now back above it. Is intermediate-term momentum improving?
Third, the 8-day exponential moving average (EMA) is above the
Post-Mortem -($NASDAQ:AMGN$)The Setup ( NASDAQ:AMGN $)
The Trend: Structural shift.
Price broke the descending trendline, turned the 20 EMA Basis Line upward, and expanded straight into the Upper Keltner Channel to print light blue momentum bars (colorMomUp).
The Flag: Orderly pullback into dynamic support. The Momentum Gauge (Neon Orange Line) was cooling off toward the Signal Line (Cyan), mimicking a low-volatility pause before an expected move higher.
The ExecutionEntry: Long at $354.04 as the market attempted to t
The Secret Reason AMGN Is A Strong BuyAmgen's fundamental value proposition is currently anchored by strong financial execution and a highly transformative pharmaceutical pipeline that positions the company for significant long-term revenue acceleration
The primary growth catalyst remains MariTide which is Amgen's investigational monthly injectable therapy for obesity and diabetes that is currently progressing through late-stage Phase 3 clinical trials and threatens to disrupt the current weekly market duopoly by offering superior
Amgen (AMGN): A Biotech Cash Machine Approaching a Patent CliffExecutive Summary:
Margin of safety verdict: At roughly $335 to $345 per share, Amgen trades close to conservative estimates of intrinsic value, leaving little margin of safety despite the company’s strong business quality.
Amgen sits in an unusual spot within the healthcare sector. It isn’t a speculative biotech waiting on a single clinical trial, but it also isn’t a sprawling pharmaceutical conglomerate with dozens of unrelated divisions. The company operates more like a biologics platform: o
Amgen Attracts Demand as Defensive Rotation Supports HealthcareAmgen (AMGN) is attracting renewed demand following a retracement within a strong uptrend. The stock continues to exhibit a bullish structure characterized by higher highs and higher lows, with price trading above the aligned 20-day and 50-day moving averages, reinforcing the underlying positive momentum. The renewed interest also reflects a broader defensive rotation into healthcare stocks amid heightened geopolitical risks stemming from tensions involving the United States, Israel, and Iran.
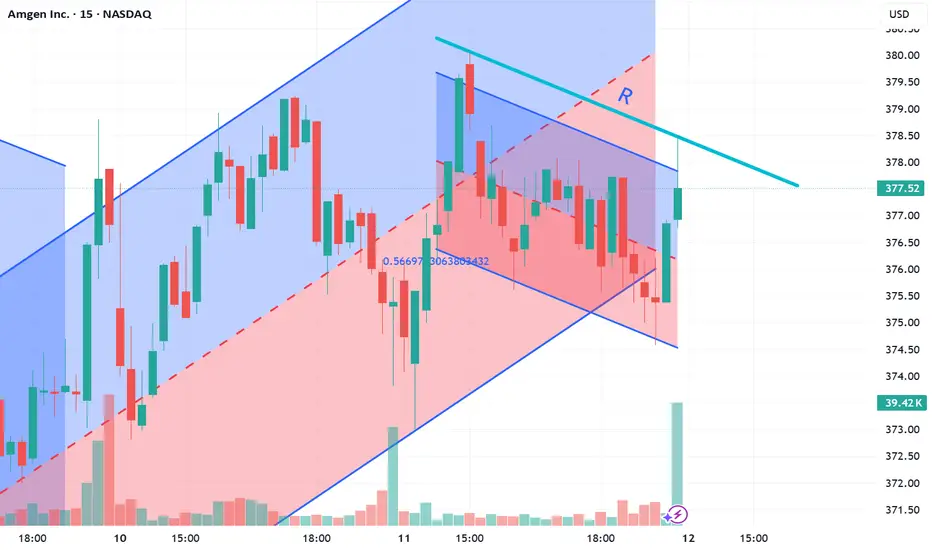
AMGNTeam,
We are not buying now.
Price is still trading below major descending resistance (R).
As long as we are below R, the structure remains under pressure.
✅ What We Are Waiting For
We only buy if:
Price breaks above the descending resistance (R)
A candle closes clearly above it
We see strength (no immediate rejection wick)
Ideally: a small pullback that holds above R
No breakout = no trade.
🟢 Entry Plan (After Confirmation)
Once price:
Breaks above R
Retests and holds
Amgen May Have Broken OutAmgen spent a quarter consolidating near record highs, and now it may have broken out.
The first pattern on today’s chart is the surge on February 4 after earnings beat estimates. The pharmaceutical giant pulled back to hold a 50 percent retracement of the move, potentially confirming its upward trajectory.
Second, the 50-day simple moving average (SMA) crossed above the 100-day SMA in November and has expanded since, which may confirm its long-term direction has grown more bullish.
Third, th
AMGN - Combo bullish signs=======
Volume
=======
- Healthy
==========
Price Action
==========
- Bullish flag spotted
- Supported above $310
- Gapped up from a near 6 month ascending triangle
=================
Technical Indicators
=================
- Ichimoku
>>> price above cloud
>>> Green kumo expanding
>>> Tenken - Above clouds, crossed Lagging & pointing up
>>> Kijun - Above clouds, crossed Lagging & pointing up
>>> Chiku - Above clouds, Conv, Base & pointing up slightly
=========
Oscillators
=========
>>
Technical VS fundementalThe #UPC Court of Appeal confirmed the validity of Amgen's key Repatha patent (EP 797), securing its market lead against Sanofi. This massive legal victory clears the path for infringement proceedings and could potentially unlock value leading to a 50% stock increase!
@Amgen: The Repatha shield is strong! @Sanofi: The battle continues.
#Amgen #Repatha #Biotech #StockMarket #PatentLaw NASDAQ:AMGN NASDAQ:SNY
Amgen’s Ascending TriangleAmgen rallied sharply last month, and some traders may see more upside in the drug maker.
The first pattern on today’s chart is the advance after earnings and revenue beat estimates on November 4. Such a move may reflect improved sentiment.
Second is the $337.38 level, AMGN’s previous record-high closing price from 2024. The shares have remained near (and often above) that level for more than three weeks. Is a breakout next?
Third is the series of higher lows as prices challenge resistance. T
AMGN on the Verge of a Major Breakout1. Technical Analysis
AMGN has formed a bullish pennant pattern after a strong upside rally. This compression typically acts as a continuation setup, suggesting that buyers are preparing for another push higher—if the major resistance gives way.
Key Resistance
• $346.7 → Major multi-year resistance
Bullish Scenario
If AMGN breaks above 346.7:
• Target 1: $360
• Target 2: $370
• Target 3: $385
Bullish catalysts:
• Strong prior momentum
• Bullish Pennant continuation pattern
• Tra
AMGN: the medicine cabinet for your portfolioOn the weekly chart, Amgen (AMGN) trades at $289.56, holding above the key $272–280 support zone, aligned with the 0.705–0.79 Fibo levels. This area forms a clear buy zone, where buyers are likely to step in. The technical structure remains bullish: the uptrend is intact, with targets at $346.85, matching historical highs and the upper boundary of the formation. Price currently sits near the lower part of the range, where volume accumulation could fuel the next upward move.
Fundamentally , Amg
AMGN | Healthcare STRONG | LONGAmgen, Inc. is a biotechnology company, which engages in the discovery, development, manufacture, and marketing of human therapeutics. The company was founded by William K. Bowes, Jr., Franklin Pitcher Johnson, Jr., George B. Rathmann, and Joseph Rubinfeld on April 8, 1980 and is headquartered in Thousand Oaks, CA.
AMGN - To see a new high=======
Volume
=======
- neutral
==========
Price Action
==========
- rounding bottom recently
- Ascending triangle noticed
=================
Technical Indicators
=================
- Ichimoku
>>> price above cloud
>>> Green kumo budding
>>> Tenken - above clouds and pointing up
>>> Chiku - within clouds and pointing up slightly
>>> Kijun - Above clouds and pointing up
=========
Oscillators
=========
- MACD still bullish
- DMI neutral
- StochRSI, still bullish
=========
Conclusion
===
Professional Technical Analysis of AMGN (Amgen Inc.)
Looking at the daily chart of AMGN, here’s the outlook:
📊 Short-Term Outlook (1–4 weeks)
Price Structure: The stock is testing a long-term ascending trendline (blue line). This level has repeatedly acted as strong support since early 2023.
Risk: If buyers fail to defend the trendline, a breakdown could trigger further downside momentum.
Key Support: $270 (trendline + psychological level).
Short-Term Stop Loss: Below $265 on a confirmed daily close.
Short-Term Target: If support holds, a rebo
Utilizing algorithms to identify A+ trade opportunitiesMy typical video consists of analyzing a specific chart and telling its story. But here, I take a different approach and analyze how to actually capitalize on the knowledge we have through the algorithms.
As you'll see, these are repeated algorithms that we've identified from previous price action - and as you'll see, they repeat beautifully, over and over again, on every chart.
Let's test this theory and see if we can prove an above-average/high-probability trading setup through our tapered
AMGN Long Trade Setup!📈
🕒 Timeframe: 30 min
🔻 Pattern: Falling wedge nearing breakout 🔼
📍 Entry Zone: ~$277.00 ✅
🎯 Target: $283.35 💰
🛑 Stop Loss: Below $274.00 ⚠️
🔥 Why It Looks Bullish:
🔺 Falling wedge structure — a known bullish pattern
🧱 Strong bounce off demand zone (support + yellow line)
💚 Green reversal candle forming at wedge tip
📈 Risk-to-reward ratio is attractive for swing/short-term