American Superconductor Corporation
No trades
No trades
In-depth trading ideas
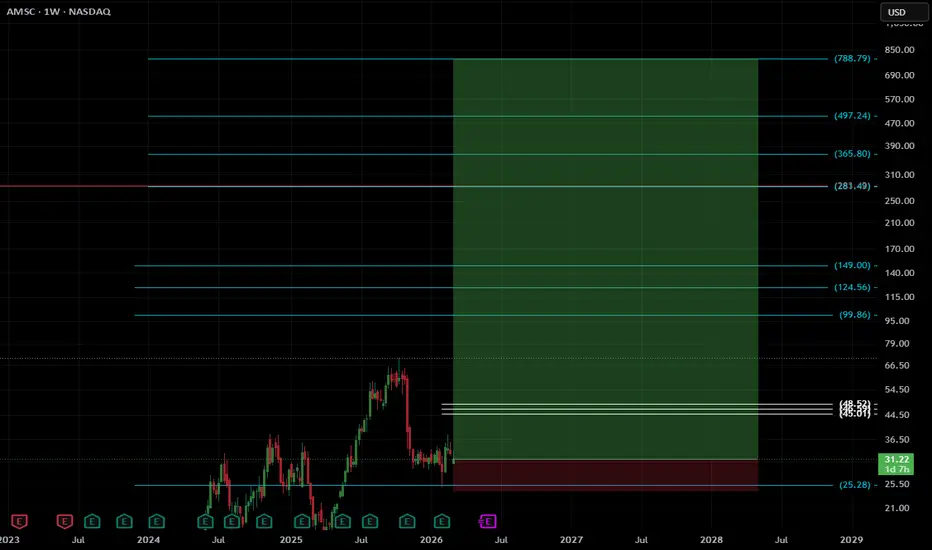
๏ปฟConfirmed Triple Bottom with >10x AheadConfirmed HTFs textbook triple bottom w/ a successfully re-tested neckline, a golden cross of its 2 weekly 50/200 EMAs. Volume picking up into the move more than it ever has since 1992.
Fundamentally, the company has been experiencing successful earnings over the last decade while bottoming and into the final break out of bottom.
I like the chances on this one, it could see an extended period of growth. Previous ATH sits just above TP 2 and will likely be revisited here, with a decent change it moves beyond it.
If it loses $25.93 and the 200 2 weekly EMA and does not relatively quickly reclaim both - back to the drawing board.
$AMSC , SetupENTRY : CMP
TP1 : 45.01
TP2 : 99.86
TP3 : 149
TP4 : 283.42
TP5 : LET IT ROLLLLLLLL
SL : If you wish
My SL is never a SELL, just an alarm to stop adding money and wait for better dca
Follow, Boost, Thank You !!
โ ๏ธ Financial Disclaimer:
This post is not financial advice. I am not your financial advisor, your life coach, or your legally responsible adult.
Always do your own research and never trade based solely on internet comedy.
AMSC heads up at $63.00: Golden Genesis fib could HALT the surgeAMSC surged with the quantium computing sector.
It has just hist a Golden Genesis fib at $63.00 round.
Look for a Dip-to-Fib or Break-n-Retest for entries.
See the "Related Publications" for previous charts with 100% gains.
Hit BOOST and FOLLOW for more such PRECISE and TIMELY charts.
=========================================================
.
AMSC eyes on $40.18: Golden Genesis fib holding up new ATHAMSC has been bobbing into a Golden Genesis fib at $40.18
Look for a Break-n-Retest to start next leg of uptrend.
Beware of a possible rejection for a high velocity dip.
.
Previous Analysis that gave a PERFECT SWING trade:
Hit the BOOST and FOLLOW for more such a PRECISE and TIMELY charts.
==============================================================
.
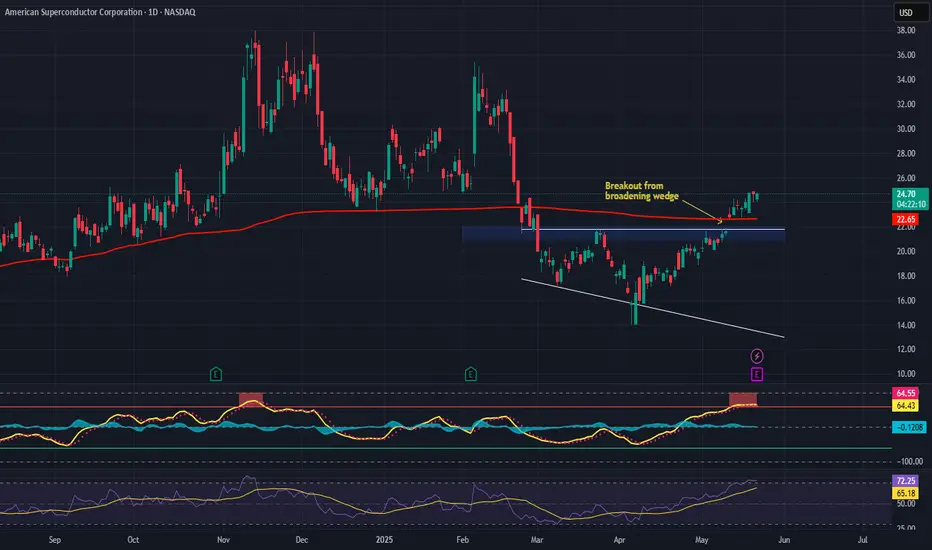
AMSC | Bullish Momentum Building Breakout in Progress?๐ NASDAQ:AMSC ๐
American Superconductor (AMSC) is quietly showing strength, and it's time to pay attention. After bouncing off the support zone near $18.80โ$19.30, the stock has reclaimed the $20.50โ$21.10 entry range, with volume picking up as it challenges key resistance.
๐ง Why it's interesting now:
โ
56% YoY revenue growth last quarter ๐
โ
LSE:80M in cash, no urgent need for dilution
โ
Clean energy + grid modernization = tailwind
๐งฉ Technical Setup:
โ
Entry Zone:
$Market price
$19.5-20.5
$18.5
โ
Breakout Trigger: $22.38
๐ฏ Target 1: $23.50
๐ฏ Target 2: $25.70
๐ฏ Stretch Target: $28.00 +
This is a high-beta, high-volatility name โ perfect for swing traders who can manage risk. Watch that breakout above $22.38; it could open the door to a fast move toward mid-$20s.
๐ Disclaimer: This is not financial advice. Do your own research before making any trading decisions. I'm not a financial advisor.
American SuperconductorโPowering the Future of Energy & Defense Company Overview:
NASDAQ:AMSC is at the intersection of three megatrends: grid modernization, clean energy, and military innovation. With proprietary high-temperature superconducting (HTS) technology and a growing portfolio of energy and defense solutions, the company is moving from niche player to strategic infrastructure enabler.
๐ Growth Catalysts:
๐ Grid Modernization & NWL Acquisition
Grid segment revenue +56% YoY in Q3 2024, accelerated by NWL integration
NWL expands footprint in grid-scale capacitors, transformers, and military-grade systems
Heightened U.S. focus on grid resiliency due to aging infrastructure and climate pressures
๐ฌ๏ธ Renewable Energy Tailwinds
Wind segment grew +58% YoY, bolstered by demand for advanced turbine control systems
Aligns with global decarbonization and offshore wind investment
๐ก๏ธ Defense Expansion
HTS tech used in shipboard systems, degaussing solutions, and high-power electronics
NWL opens doors to increased DoD contracts amid rising national security budgets
๐ Recurring Revenue & Policy Support
Shift toward long-term service and tech licensing agreements
Backed by U.S. energy and defense spending, including DOE and DOD initiatives
๐ Fundamental Highlights:
Lean balance sheet and operating leverage
Strong YoY revenue acceleration across all segments
Diversified exposure to energy, defense, and renewables
๐ Investment Outlook:
โ
Bullish Above: $21.00โ$22.00
๐ Upside Target: $38.00โ$40.00
๐ฏ Thesis: With breakthrough superconducting tech, strategic acquisitions, and bipartisan support for energy security, AMSC is emerging as a small-cap innovator in critical infrastructure.
#AMSC #GridModernization #DefenseTech #Renewables #Superconductors #EnergyResilience #CleanTech
AMSC โ 30-Min Long Trade Setup !๐ ๐ข
๐น Asset: American Superconductor Corp. (AMSC โ NASDAQ)
๐น Timeframe: 30-Min Chart
๐น Setup Type: Symmetrical Triangle Breakout + Retest
๐ Trade Plan โ Long Position
โ
Entry Zone: $18.17 (Breakout above triangle + reclaim of yellow level)
โ
Stop-Loss (SL): $17.40 (Below structure & rising trendline)
๐ฏ Take Profit Targets:
๐ TP1: $18.82 โ Recent resistance level
๐ TP2: $20.03 โ Key supply zone
๐ Risk-Reward Calculation
๐ฅ Risk: $0.77/share
๐ฉ Reward to TP2: $1.86/share
๐ R/R Ratio: ~1 : 2.4 โ Clean structure with good reward
๐ Technical Highlights
๐ Breakout from symmetrical triangle resistance โ
๐ Clean retest candle forming support โ
๐ Higher lows showing bullish pressure โ
๐ Volume building near breakout zone โ
๐ Risk Management Strategy
๐ Move SL to breakeven after TP1
๐ฐ Book partial profits at TP1
๐ Let remaining ride to TP2
๐จ Setup Invalidation If:
โ Price closes below $17.40
โ Weak volume confirmation
โ Rejected sharply from $18.50โ$18.80 zone
๐
#AMSC #BreakoutTrade #SwingSetup #NASDAQ #ProfittoPath #ChartPattern #VolumeBreakout #SmartTrading #RiskReward #TechnicalSetup
AMSC โ 15-Min Long Trade Setup !๐ ๐ข
๐น Asset: American Superconductor Corp. (AMSC โ NASDAQ)
๐น Timeframe: 15-Min Chart
๐น Setup Type: Symmetrical Triangle Breakout + Rising Support
๐ Trade Plan โ Long Position
โ
Entry Zone: $18.01 (Breakout + trendline confluence)
โ
Stop-Loss (SL): $17.14 (Below ascending trendline + prior low)
๐ฏ Take Profit Targets:
๐ TP1: $19.16 โ Local resistance
๐ TP2: $20.39 โ Major resistance zone
๐ Risk-Reward Calculation
๐ฅ Risk: $0.87/share
๐ฉ Reward to TP2: $2.38/share
๐ R/R Ratio: ~1 : 2.7 โ High reward with tight risk
๐ Technical Highlights
๐ Breakout from coiled price action โ
๐ Higher lows forming ascending structure โ
๐ Strong wick rejection from trendline support โ
๐ Momentum building after low-volume consolidation
๐ Risk Management Strategy
๐ SL to breakeven post TP1
๐ฐ Take partial profits at TP1
๐ Hold remaining to TP2 with trend
โ ๏ธ Setup Invalidation If:
โ Breakdown below $17.14
โ Fails to close above yellow zone
โ Reversal with increasing volume
๐จ Final Thoughts
โ Clean technical breakout with momentum potential
โ Perfect fit for short-term swing traders
โ Compact stop, spacious upside โ classic ProfittoPath quality
๐ #AMSC #BreakoutTrade #NASDAQStocks #ProfittoPath #TechnicalSetup #SwingTrade #VolumeConfirmation #ChartAnalysis #RiskReward #MomentumPlay
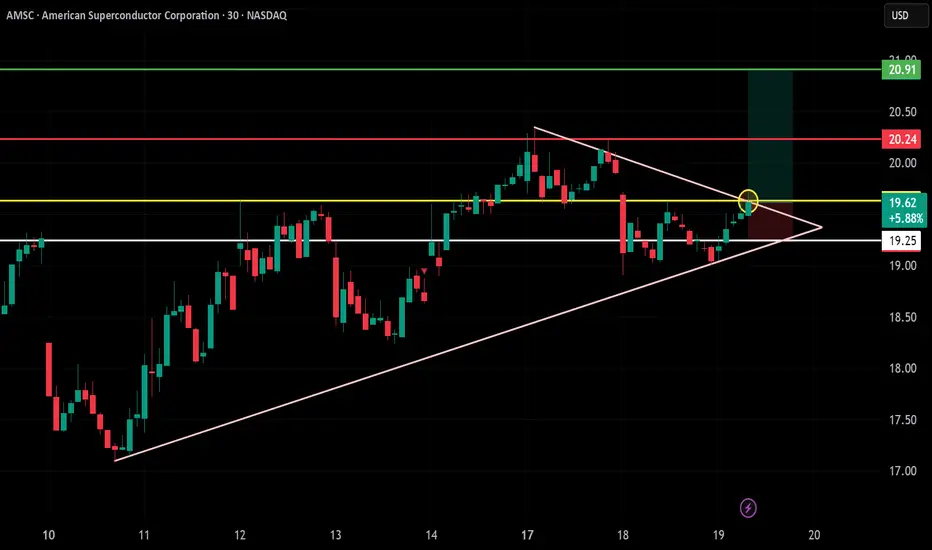
AMSC (American Superconductor Corporation) โ 30-Min Long Trade ! ๐
๐น Asset: AMSC โ NASDAQ
๐น Timeframe: 30-Min Chart
๐น Setup Type: Bullish Breakout (Symmetrical Triangle Pattern)
๐ Trade Plan (Long Position)
โ
Entry Zone: Above $19.65 (Breakout Confirmation)
โ
Stop-Loss (SL): Below $19.25 (Key Support Level)
๐ฏ Take Profit Targets
๐ TP1: $20.24 (Resistance Level)
๐ TP2: $20.91 (Extended Bullish Move)
๐ Risk-Reward Ratio Calculation
๐ Risk (SL Distance):
$19.65 - $19.25 = $0.40 risk per share
๐ Reward to TP1:
$20.24 - $19.65 = $0.59 (1:1.47 R/R)
๐ Reward to TP2:
$20.91 - $19.65 = $1.26 (1:3.15 R/R)
โ
Favorable Risk-Reward Ratio toward TP2
๐ Technical Analysis & Strategy
๐ Symmetrical Triangle Breakout: Price is breaking above the resistance line, confirming bullish momentum.
๐ Support at $19.25: The lower trendline acts as a strong safety level for this trade.
๐ Volume Confirmation Needed: Look for above-average buying volume above $19.65 to validate the breakout.
๐ Resistance at $20.24: A break above this strengthens the bullish case toward TP2.
๐ Trade Execution & Risk Management
๐ Volume Confirmation: Ensure strong buying volume above $19.65 before entering.
๐ Trailing Stop Strategy: Move SL to break-even ($19.65) after hitting TP1 ($20.24).
๐ฐ Partial Profit Booking Strategy
โ Take 50% profits at TP1 ($20.24), let the rest run toward TP2 ($20.91).
โ Adjust Stop-Loss to Break-even ($19.65) after TP1 is reached.
โ ๏ธ Risks & Considerations
โ Fake Breakout Risk: If the price fails to hold above $19.65, exit early.
โ Confirmation Required: Wait for a 30-min candle close above $19.65 before entering.
๐ Final Thoughts
โ Bullish Setup โ Strong upside potential.
โ Momentum Shift Possible โ Watch for volume confirmation.
โ Favorable Risk-Reward Ratio โ 1:3.15 toward TP2.
๐ก Stick to the plan, manage risk, and trade smart! ๐๐
๐ #AMSC #NASDAQ #LongTrade #TradingView #ProfittoPath ๐ฐ๐
AMSC โ 30-Min Short Trade Setup!๐ ๐
๐น Asset: American Superconductor Corporation (AMSC)
๐น Timeframe: 30-Min Chart
๐น Setup Type: Bearish Breakdown Trade
๐ Trade Plan (Short Position)
โ
Entry Zone: Below $18.60 (Breakout Confirmation)
โ
Stop-Loss (SL): Above $19.61 (Invalidation Level)
๐ฏ Take Profit Targets:
๐ TP1: $17.29 (First Support Level)
๐ TP2: $15.93 (Extended Bearish Move)
๐ Risk-Reward Ratio Calculation
๐ Risk (SL Distance): $19.61 - $18.60 = $1.01 per share
๐ Reward to TP1: $18.60 - $17.29 = $1.31 (1:1.3 R/R)
๐ Reward to TP2: $18.60 - $15.93 = $2.67 (1:2.64 R/R)
๐ Technical Analysis & Strategy
๐ Symmetrical Triangle Breakdown โ Price is testing the lower trendline, signaling potential downside.
๐ Volume Confirmation Needed โ A strong bearish candle below $18.60 confirms entry.
๐ Momentum Shift Expected โ Breakdown could lead to $17.29, then $15.93.
๐ Key Resistance & Support Levels
๐ด $19.61 โ Resistance / SL Level
๐ก $18.60 โ Breakdown Level / Short Entry
โช $17.29 โ First Support / TP1
๐ข $15.93 โ Final Target / TP2
๐ Trade Execution & Risk Management
๐ Volume Confirmation โ Ensure strong selling pressure before entering.
๐ Trailing Stop Strategy โ Move SL to $18.60 (breakeven) after hitting TP1 ($17.29).
๐ฐ Partial Profit Booking Strategy:
โ Take 50% profits at $17.29, let the rest run to $15.93.
โ Adjust SL to breakeven ($18.60) after TP1 is hit.
โ ๏ธ Fake Breakdown Risk
โ If price moves back above $18.60, exit early to limit losses.
โ Wait for a strong bearish candle close below $18.60 before entering aggressively.
๐ Final Thoughts
โ Bearish Setup Forming โ Breakdown signals a potential downside move.
โ Momentum Shift Expected โ Watch for volume confirmation.
โ Favorable Risk-Reward Ratio โ 1:2.64 R/R at TP2 makes this a high-quality trade.
๐ก Stick to the plan, manage risk, and trade smart! ๐๐ฅ
๐ Follow @ProfittoPath for More Trade Setups!
#ProfittoPath ๐ | #AMSC ๐ | #StockMarket ๐ | #BreakdownTrade ๐ | #ShortSetup ๐ฐ | #RiskManagement ๐ | #MarketAnalysis ๐ | #SwingTrading
AMSC Double Cup & Handle Breakout: Big Targets in SightAmerican Superconductor (AMSC) is gearing up with not one, but two Cup & Handle formations, doubling down on its breakout potential.
Double Cup & Handle Power: The first Cup & Handle has already broken out with a target near $35. Now, the second, larger Cup & Handle breakout above $27 is setting sights on an ambitious target around $51โan 89% potential move if the momentum holds.
Bullish Channel & Momentum: AMSC is cruising up within a clean ascending channel, showing no signs of slowing. The SMA 150 is also catching up, suggesting a long-term trend shift could be underway.
Volume & RSI: Rising volume confirms the strength behind these moves, while RSI is flirting with overbought levels. A slight pullback wouldnโt be unexpected, but the bulls look firmly in control.
Bottom Line: With dual Cup & Handle breakouts, strong targets, and solid demand, AMSCโs chart is loaded with potential. This setup has serious momentumโone to watch closely.
My Watchlist: AMSCAMSC, which recently had high volume and now has a setup signal. I'm looking to enter long near the close of the day if the stock can manage to CLOSE above the last candle highs(1). If triggered, I will then place a stop-loss below (2) and a price target above it (3). Wish me luck!
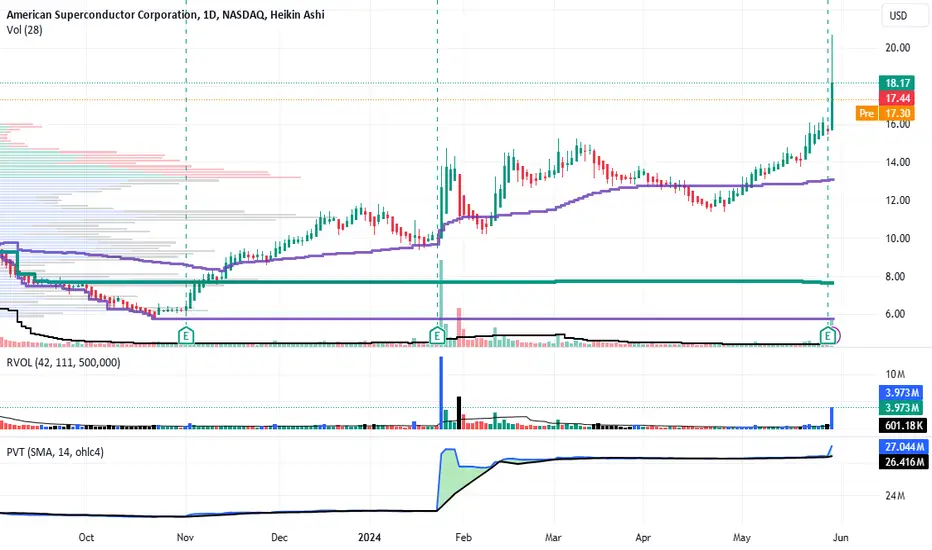
AMSC Computer medium cap beats earnings LONGAMSC on the daily chart has went 3X in 7-8 months on the strength of earnings beats and
the tailwinds of the AI supertrend. I see this as an excellent swing long trade to hold into
the next earnings in 3-4 months. AMSC is currently at its ATH and going higher means no
overhead resistance.
AMSC, 5/30-5/30, 10% PROFITAMSC (AMSC) reported earnings of $0.02 per share on revenue of $42.03 million for the fiscal fourth quarter ended March 2024. The consensus estimate was a loss of $0.06 per share on revenue of $36.75 million. The company beat consensus estimates by 133.33% while revenue grew 32.40% on a year-over-year basis.
5/29/24 - $asmc - sidelines, too much risk in this tape into EPS5/29/24 - vrockstar - $asmc - just added to my energy watchlist b/c the growth here L12 months q by q has been pretty impressive. stock has reacted to a lot of this, however, obviously. so $500-$600 mm valuation on $150 of sales is 3.5-4x sales (b/c profitability still scaling), which a. for this cap and b. those non software margins is quite frankly too much to take a position. add to this last time this year the seasonal quarter was a big revenue miss. i'm not close enough to know how much seasonality should be incorporated here, the bogey doesn't look *easy* per se (or difficult either based on recent trends). i'd prefer to keep this on my radar and get a greedier entry, however my bias here is more long than short in the MT/LT. hard enough to own larger caps with similar 20% growth trajectories and profitable - which is where the first bid will come in (generally) and in a risk off environment, these are the caps that get dropped fastest b/c liquidity, valuation/ rates etc.
Superconductor's Super R:RI like to say that spot (stock) is a superpower.
Trading options over the past few years has taught me a lot about being right at the right time AND being wrong at the right time.
If our absolute cutoff is $7.95 then it gives around -10% downside ignoring fees.
The play isn't soley based on the chart or the hype around LK-99.
It has to be on the overly pessimistic attitude of the average individual who has run across this story and now is convinced it's over because they say so.
They have bias, and perhaps so do I.
Managing risk while maintaining an optimistic view of the future is what excites me most about being in these markets.