Webull Corporation
No trades
No trades
In-depth trading ideas
๏ปฟWebull (BULL) 1DWebull (BULL) is currently trading at a point where the companyโs name feels almost ironic. The โbullโ has been walking downhill for months, compressing inside a descending wedge, while investors wait for the earnings report on March 4, 2026 to decide whether this is capitulation or accumulation.
Webull is a digital brokerage platform focused on retail traders. Revenue is primarily driven by options trading, margin interest, payment for order flow, market data services, and premium subscriptions. In simple terms: when retail traders are active and volatility is high, Webull performs well. When markets cool down, earnings become unpredictable.
Recent quarterly results showed improvement. In Q3 2025, EPS came in at $0.07 versus expectations near $0.02. Revenue was approximately $156M compared to forecasts around $132M. That was a meaningful beat. However, trailing twelve-month profitability remains volatile. The company is transitioning from inconsistent losses toward operational stabilization, but it has not yet proven structural earnings durability.
Strategically , Webull continues expanding its mobile trading ecosystem, strengthening options infrastructure, enhancing subscription analytics tools, and broadening international access. The focus is shifting from pure user acquisition to deeper monetization and retention. The question heading into earnings is simple: can improved margins persist in a less euphoric market environment?
Technically , the chart shows a persistent downtrend: lower highs, lower lows, and a contracting descending wedge. Price is testing the 5.5โ6.0 region - a historical support zone and potential accumulation area. The recent low around 5.47 marks the structural boundary.
RSI is emerging from oversold territory and showing early bullish divergence. Momentum histogram is contracting. ADX suggests weakening trend strength. Importantly, volume at the recent lows does not reflect panic capitulation. That often signals exhaustion rather than acceleration.
Key resistance levels sit at 7.96, 10.18, and 15.08. A strong earnings release could trigger short covering toward 8โ10. A weak report, however, opens downside below 5.47.
BULL is not priced as a growth darling. It is priced as a company under skepticism. And that is often where asymmetric opportunities begin.
March 4 decides whether this wedge resolves upward - or confirms continuation.
BULL | Continued stock growth- Timeframe: Weekly
- Trade type: Buy stop order
- Price: 7.53
- Take Profit: Open
- Stop Loss: 6.94 (-7.90 %)
Idea: Long on a breakout above last week's high - bullish momentum continuation.
Entry: Buy stop above last weekโs high.
Stop-loss: Below the low of the same candle.
If the weekly candle closes below this level, the trade is invalidated.
Take Profit: Trailing stop following the lows of new weekly candles.
Webull Is Trying to Break Out of Its DowntrendNASDAQ:BULL Webull Corporation, ticker BULL, has had a rough run since its April 2025 IPO. After coming public during a volatile market backdrop, the stock has spent much of its short trading history moving lower.
Now, the chart is starting to show something more interesting.
On the weekly chart, BULL appears to be working its way out of a descending channel. The upper and lower boundaries of that channel line up with several prior resistance and support points, including a recent test near the end of June. A breakout from a descending channel does not automatically mean a new uptrend has started, but it is enough to put the stock back on the watchlist.
The key level to watch first is around $7.50. This zone has mattered before, acting as both support and resistance. A clean weekly close above that level would be the first sign that buyers are starting to regain control.
The next test sits close by: the 200-day simple moving average, currently around $7.68. If BULL can reclaim both the $7.50 zone and the 200-day moving average, the technical picture gets much more constructive.
In that bullish scenario, the next major upside target could be around $16.50. That area has acted as resistance in the past, making it a natural place to watch if momentum continues. From current levels, that would represent a significant move, so confirmation matters.
There is also a catalyst on the calendar. Webull has earnings coming up in August, and that could help push the stock higher if the market likes the results. Of course, the opposite is also true: earnings could trigger a retest of the lows if the reaction is negative.
For now, BULL is a momentum setup that needs proof. The descending-channel break is interesting, but the stronger signal would be a confirmed move above $7.50 and the 200-day moving average. Until then, it remains a watchlist idea rather than a fully confirmed breakout.
If you liked this article, please consider boosting it! It only costs you a mouse click.
This is not financial advice. Always do your own research and manage risk carefully.
$BULL - Cup and Handle Pattern๐ก Swing setup idea
50 SMA cross
๐ Analysis summary:
The stock crossed the 50 SMA and is closing a cup and handle pattern. Wait for the breakout with volume to confirm the move.
๐ Levels to watch:
Entry trigger: Break above $7.52
Target: $10.57
Stop: Under the breakout level
๐ฌ What do you think of this setup? Let me know in the comments! ๐
Good luck!
โ ๏ธ Note: This is for educational purposes only and is not financial advice.
Webull Corp (NASDAQ: BULL)Webull Corp has recently released its latest set of financial and operational metrics, painting a nuanced picture of a fast-growing fintech disruptor that is successfully scaling its user base while simultaneously grappling with the harsh realities of a volatile macroeconomic climate. The company continues to demonstrate formidable top-line momentum and deepening client relationships; however, aggressive growth investments and market-specific softness are placing tangible pressure on its near-term profitability margins.
Examining the Bullish Drivers (Positive Points)
At the heart of Webull's current narrative is a remarkable 36% year-over-year surge in revenue, propelling the firm's total top-line figures to an impressive $160 million. This robust growth underscores the effectiveness of its expanding product ecosystem and its ability to monetize a rapidly growing user base. Bolstering this financial achievement, total customer assets under administration have skyrocketed by an eye-catching 90% compared to the previous year, now standing at a substantial $24 billion. This exponential increase not only signals a significant capture of market share within the retail investment space but also highlights an elevated level of customer trust and sustained portfolio engagement.
Demonstrating strong conviction in its underlying business value and future prospects, the board of directors has authorized a sizeable share repurchase program totaling up to $100 millionโa definitive signal to the investment community that management views the current valuation as compelling. On the global expansion front, Webull has made significant regulatory strides, having successfully secured permissions to operate across 22 additional European markets. This strategic broadening of its geographic footprint diversifies revenue streams and reduces dependency on any single region. Furthermore, the platform achieved a stellar record-high quarterly retention rate of 98.4%, a standout metric that serves as a testament to exceptional customer loyalty, superior user interface design, and an overall satisfying trading experience that keeps clients coming back quarter after quarter.
Confronting the Challenges and Risks (Negative Points)
Despite these impressive top-line accomplishments, the company faces several notable headwinds that investors must weigh carefully. Foremost among these is a steep 64% year-over-year escalation in adjusted operating expenses. This sharp cost inflation is primarily driven by heightened spending on global marketing campaigns and branding investments aimed at sustaining the company's rapid user acquisition trajectory, but it has inevitably squeezed operational efficiency.
Moreover, while the year-over-year asset growth is commendable, customer assets have actually experienced a slight sequential decline when measured from the beginning of the current fiscal year. This dip is largely attributable to persistent turbulence and sell-offs across global equity markets, which have eroded portfolio valuations independent of user behavior. Compounding this issue, the company has reported sequential pullbacks in both customer net deposits and overall trading volumes. These declines serve as clear indicators of a cautious and risk-off sentiment prevailing among retail traders, who are scaling back their market activity in the face of a challenging interest rate environment and geopolitical uncertainties.
Unsurprisingly, the confluence of rising costs and subdued trading activity has led to a contraction in the adjusted operating profit margin, which now sits at 9.3%โa notable reduction from previous periods. This margin compression highlights the classic "growth-over-profitability" dilemma facing the firm. Lastly, Webull's cryptocurrency vertical remains a distinct laggard in its otherwise diverse revenue lineup. Currently, crypto-related revenues contribute a mere 2% to the firmโs total revenues, significantly underperforming relative to dedicated crypto exchanges and even some peer retail platforms. This minimal contribution suggests that Webull has yet to effectively capture the digital assets trading wave, representing a missed opportunity in an increasingly popular asset class that will require strategic reevaluation moving forward.
BULL: Trend Structure Price is following the trend structure shared in our June update. We prefer to see more right-side development and a local consolidation within the 7.70โ6.20 region over the coming weeks.
A subsequent breakout above 8 would then open the door toward 10+.
Chart:
Our note in WeBull on Jun 15:
"A very constructive recovery off the June 10th low, which reached a mid-term support zone and allowed a higher low to form.
The V-shaped nature of the recovery looks prone to more right-side consolidation, especially if it reaches the 7.40โ7.70 resistance levels this week. Seeing this right-side consolidation would substantially improve the stability of the structure that's forming โ preferable to a continuous, uninterrupted upside momentum from here."
Chart:
Covered call on BULL....NICE 10% plus day. I usually don't sell covered calls THIS far away. This does cover 2 free days of theta.
100 sma on daily will be resistance along with the 200 sma. I wouldn't be SO mad if I sold BULL at $10.10. This stock is still a buy out candidate. But with bitcoin staying low and weak..this stock probably stays below $10 before aug.
$BULL, just announced earnings:NASDAQ:BULL , just announced earnings:
Strong growth everywhere:
Revenue +36%
Customer assets +90%
Equity volume +104%
But profitability weakened sharply as expenses and marketing spending exploded higher.
Still like the long-term Webull story.
I remain long. A dip below this range at this location usually gets bought, especially since the reversal was strong and the bear trend had already become extended.
Expecting something like this:
NASDAQ:IBKR NASDAQ:HOOD
BULL Webull Corporation Options Ahead of EarningsAnalyzing the options chain and the chart patterns of BULL Webull Corporation prior to the earnings report this week,
I would consider purchasing the 7.50usd strike price Calls with
an expiration date of 2026-5-29,
for a premium of approximately $0.23.
If these options prove to be profitable prior to the earnings release, I would sell at least half of them.
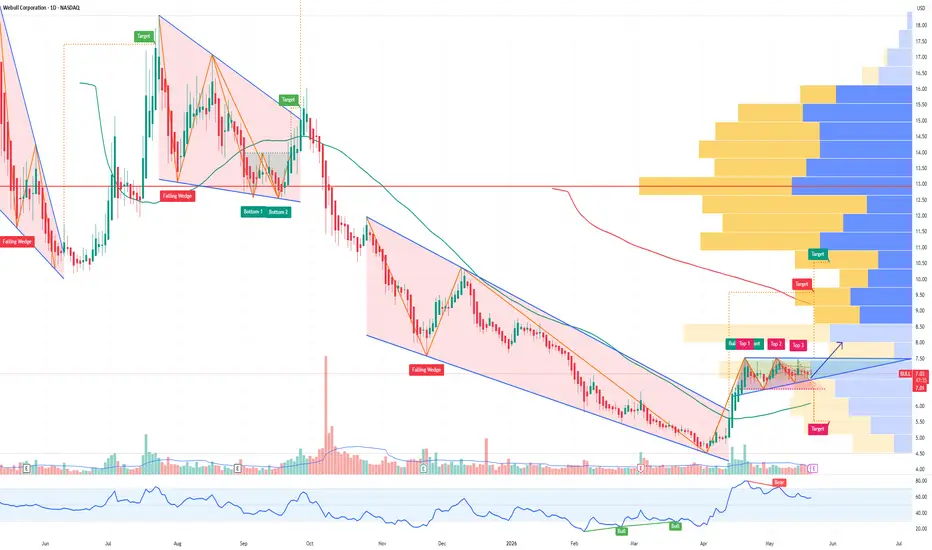
BULL is consolidating near its highs, forming a bullish flag patDuring April, the price surged from the $4.81 level up to the recent local peak at $7.52, creating the flag's "pole." We are currently in the consolidation phase, which is developing within the upper third of the move, indicating efficient supply absorption and quiet accumulation ahead of a potential breakout. A resistance zone in the $7.43 to $7.44 range has been tested multiple times recently, while underneath, an ascending trendline connects the recent lows, generating dynamic buying pressure at higher price levels as the price currently trades around $7.
A breakout will be confirmed by a daily candle close above the $7.44 level on high volume to invalidate a false breakout scenario and trigger the bullish flag, with a price target around $8.28. The support zone is at $6.53 - $6.73.
Not financial advice.
BULL Structure Study โ Fibonacci Behavior Through ZonesPrice behavior continues to respect the broader retracement framework.
After establishing a base in the lower red zone (0โ0.236), price began to stabilize and rotate higher. That initial move into the yellow zone (0.236โ0.382) was brief, showing limited acceptance and continued structural pressure.
More recently, price has transitioned into the green zone (0.382โ0.5), where weโre now seeing back-and-forth movement. This type of behavior typically reflects early-stage balance, where buyers are attempting to build structure while sellers are still active from the higher trend.
From a structure standpoint:
The red zone acted as exhaustion / base formation
The yellow zone showed initial reaction but weak acceptance
The green zone is now acting as a decision area
Acceptance or rejection here will matter.
Sustained movement and acceptance above this zone would suggest continued structural improvement
Rejection would reinforce that this is still a retracement within a broader downtrend
This is a good example of how Fibonacci levels are not just lines โ they represent behavioral zones where participation shifts.
โญ Final Clarity Note โญ
Fibonacci is most effective when viewed as zones of interaction, not precise levels. Focus on how price behaves within each zone โ thatโs where the real information is.
$BULL โ NO PDT -Webull is moving first!!If you've ever been PDT flagged and locked out of a trade, this post is for you.
On April 14 the SEC officially eliminated the Pattern Day Trader rule. The $25,000 minimum. The day trade counter. The 90-day account freezes. All of it gone. Effective June 4, 2026. That's 25 years of retail traders getting handcuffed โ finally over.
Webull was the first broker to announce support for the new rules. One day after SEC approval they were already out front with a statement. BULL stock surged 11.2% on that news alone.
โโโโโโโโโโโโโโโโโโโโโโโโโโโโโโโโโ
WHY BULL SPECIFICALLY
โโโโโโโโโโโโโโโโโโโโโโโโโโโโโโโโโ
Webull built its entire platform around the younger retail trader. Social sharing features, clean UI, commission free โ they grabbed that demographic hard when they launched and the PDT rule was always the ceiling on how much those accounts could actually trade. That ceiling just got removed.
More day trades from smaller accounts means more volume through Webull's platform. That's the direct business impact. And with June 4 as the hard effective date, this is a catalyst with a clock on it.
The stock had a bloated IPO and got punished for it. It's been quietly building back. Now it's flagging right on the 9 EMA on the hourly with a clean defined risk level.
โโโโโโโโโโโโโโโโโโโโโโโโโโโโโโโโโ
THE SETUP
โโโโโโโโโโโโโโโโโโโโโโโโโโโโโโโโโ
Bull flag sitting on top of the 9 EMA. Tight consolidation, clean pattern. This is a speculative position โ I'm not betting the house on it. Small size, 1% of account risk max.
โโโโโโโโโโโโโโโโโโโโโโโโโโโโโโโโโ
TRADE PLAN
โโโโโโโโโโโโโโโโโโโโโโโโโโโโโโโโโ
Entry: Break and hold above the flag
Stop: $6.60 on the hourly chart
Size: Small โ spec play, 1% account risk
Catalyst date: June 4, 2026 โ PDT officially dead
โโโโโโโโโโโโโโโโโโโโโโโโโโโโโโโโโ
THE RISK
โโโโโโโโโโโโโโโโโโโโโโโโโโโโโโโโโ
This is speculative. The market is extended and frothy and could pull 5-10% any day. If the broader tape rolls BULL rolls with it regardless of the setup. Small size is non-negotiable on this one.
The june 18th 7.5 are going for 75 cents or so.
$BULL, the stock trading platform of the year. Webull expanded its international footprint across 14 different countries so far (North America, South America, Europe, and Asia).
Became public a year ago and has been profitable with surging revenue and user growth ever since.
We're early!
We are on a large open profit and we haven't sold anything.
Buy Idea โ WebullStock is starting to look bullish after holding strong above support.
Why I like it:
โข Making higher lows (early uptrend)
โข Good momentum building up
โข Holding strong above 6.70 support
Entry:
7.00 โ 7.20
Targets:
7.70 / 8.50 / 9.30
Stop Loss:
Below 6.59
Idea:
If it breaks 7.50, we could see a strong move up ๐
What a clean breakout setup looks likeOn the 1-hour timeframe, BULL is showing a textbook transition from compression into expansion, supported by alignment across structure, momentum, and participation.
Structure (EMA Alignment):
Price is now trading above the 10 / 20 / 50 EMAs, all stacked above the 200 EMA
This reflects short-term trend control with higher timeframe support building underneath
Prior consolidation phase created a tight base โ now resolving higher
Momentum (RSI):
RSI holding in the upper range (~80+)
Indicates sustained momentum rather than a single spike
No major bearish divergence present โ momentum remains intact
Participation (OBV):
OBV continues trending higher
Confirms buyers are actively supporting the move, not just price drifting upward
Expansion (ATR):
ATR is beginning to rise after a period of contraction
Signals volatility expansion โ trend continuation environment
๐ What This Setup Represents
This is a classic structure sequence:
Compression โ Breakout โ Momentum Hold โ Expansion
When all four phases align:
Structure leads
Momentum confirms
Participation validates
Volatility expands
Thatโs when moves tend to sustain rather than fade quickly
โ ๏ธ Context Note
At current levels, price is extended short-term, so this becomes more about:
Monitoring pullback structure
Watching if EMAs continue to act as support
Observing whether momentum stays elevated or begins to fade
โญ๏ธ Final Clarity Note โญ๏ธ:
This isnโt about predicting the next move โ
itโs about recognizing when market structure, momentum, and participation are all aligned.
That alignment is what turns simple breakouts into sustained trends.
BULL - Webull Corporation | Bullish Falling Wedge Breakout Classic falling wedge formed from December 2025 to April 2026, compressing from 10.37$ all the way down to 4.70$ before breaking out to the upside. The measured move target sits at 7.57$
A move above on volume opens the door to the full pattern target at 10.00-10.37$.
Stop: 6.20$ - back inside the wedge invalidates the breakout.
โ ๏ธ Not financial advice.