Fluence Energy Inc FLNCPsalm 37:23 — "The steps of a good man are ordered by the Lord: and he delighteth in his way."
FLNC — the ones who walked in darkness were few. The steps were ordered by silence.
Yet the Chart delighteth in those who entered when no one watched. When the price was disdained.
14.4 is where the delight is made manifest. Where the ordered steps reach the summit.
The way was long. The way was true.
In-depth trading ideas
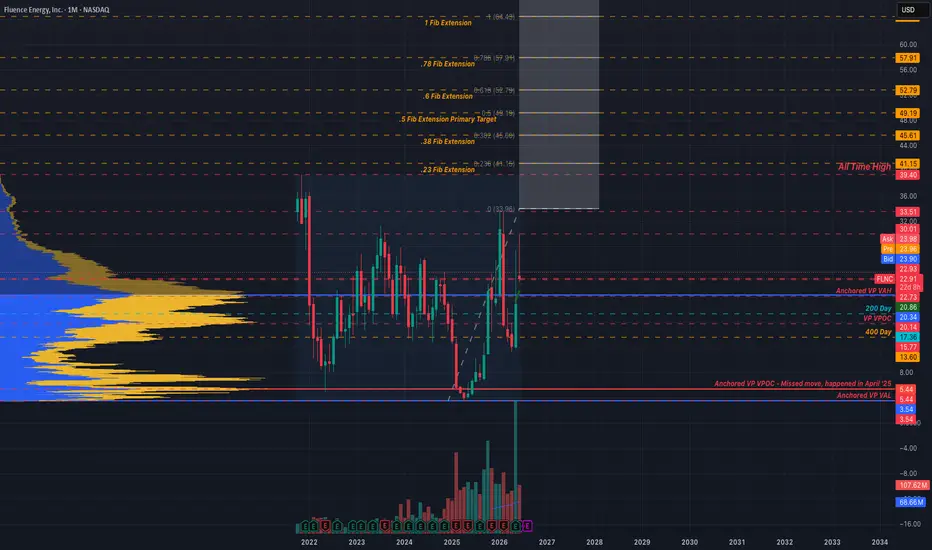
Fluence or FlatulenceFLNC closed at a very important level on Friday. Price closed around 22.91, which keeps it pinned near the anchored VP VAH at ~22.88 and just above 22.73. That matters because this is the area that needs to hold if this move is going to turn into something more meaningful than a round trip back to the couch.
The main battle zone is now tighter and cleaner. Bulls want to stay above 22.88-22.73 and keep building over the 200 Day at 20.50, the VP VPOC at 20.14, and the 400 Day at 17.36 below. Above these prices, the first upside levels are 30.01 and 33.51. Above that sits the all-time high at 39.40, then the extension ladder at 41.15, 45.61, 49.19, 52.79, and 57.91.
Below the current structure, the downside opens back into 20.50, 20.14, 17.36, 15.77, 13.60, 6.88, and then the lower memory zone at 5.44-3.54. If price starts trading sideways above 22.88-22.73, that looks like a base. If it starts chopping below it, then that same area starts looking like a ceiling.
Bullish case:
Bulls need to hold 22.88-22.73 and stop giving back the entire move every time this stock gets a little excited. If FLNC can build time and volume above that zone, then the first real upside target is 30.01. Clear that, and 33.51 becomes the next gate. If buyers can get through 33.51, then the chart starts leaning back toward the all-time high at 39.40. Above 39.40, the bigger swing thesis opens toward 41.15, 45.61, 49.19, 52.79, and 57.91. The bullish thesis is simple: hold 22.88-22.73, keep defending the reclaim over 20.50-20.14, and use 30.01 and 33.51 as proof this thing is actually trying to trend.
Bearish case:
Bears want this move to fail back under 22.73 and start treating 22.88 like a ceiling instead of support. If price loses 22.73, then I’m looking for a move back into 20.50 and 20.14. If that area fails too, then the next downside levels are 17.36, 15.77, and 13.60. Lose 13.60, and the stock can start pointing back toward 6.88 and the lower memory zone around 5.44-3.54. The bearish swing setup is a failed reclaim of 22.88-22.73 or a breakdown back below 20.14 after all this recent excitement. If buyers cannot hold this stack after a move like this, then they probably were not serious in the first place.
So the read is pretty straightforward:
Above 22.88-22.73 with acceptance, bulls have something to work with.
Below 22.73, this move starts looking weak again.
Clear 30.01, and the chart can start leaning toward 33.51.
Clear 33.51, and the bigger thesis opens toward 39.40, 41.15, 45.61, 49.19, 52.79, and 57.91.
Lose 20.14 and fail to reclaim, and the chart starts pointing back toward 17.36, 15.77, 13.60, 6.88, and maybe 5.44-3.54.
No need to overcomplicate it. FLNC needs to prove that 22.88-22.73 is support and not just another level the stock wanted to sniff before acting stupid again.
This is not financial advice, I'm just a guy with an interest and a Celsius addiction.
~The Villain
Panduhh's FLNC After-Market MoversHi, wanted to start a new thing where I post After-Market movers. Mainly as a study for myself, but I think it should be useful for anyone trading them.
Please if you would like levels for your favorite stock and I haven't already done it, let me know,
Also, if you need me to update levels for a previous idea that has already played out, let me know.
Let me know if you have any stocks you are looking at, I will happily provide pivots.
---------------------------------------------------------------------------------------------------------------------
These are the equilibrium levels for the current structure in FLNC
Levels are derived from internal framework using structure and geometric relationships—not time-based inputs.
Focus is not on prediction, but on order flow response at price.
Reaction at each level determines outcome:
– Acceptance → continuation within value
– Rejection → rotation away
– Failure → discovery beyond the range
FLNC 1W: Energy doesn’t disappear - it accumulates.Fluence Energy builds large-scale battery storage systems for modern power grids. While markets debate rates and cycles, Fluence operates in infrastructure - the backbone of renewable integration. Batteries are designed to store energy. Right now, the chart is testing whether price can store demand.
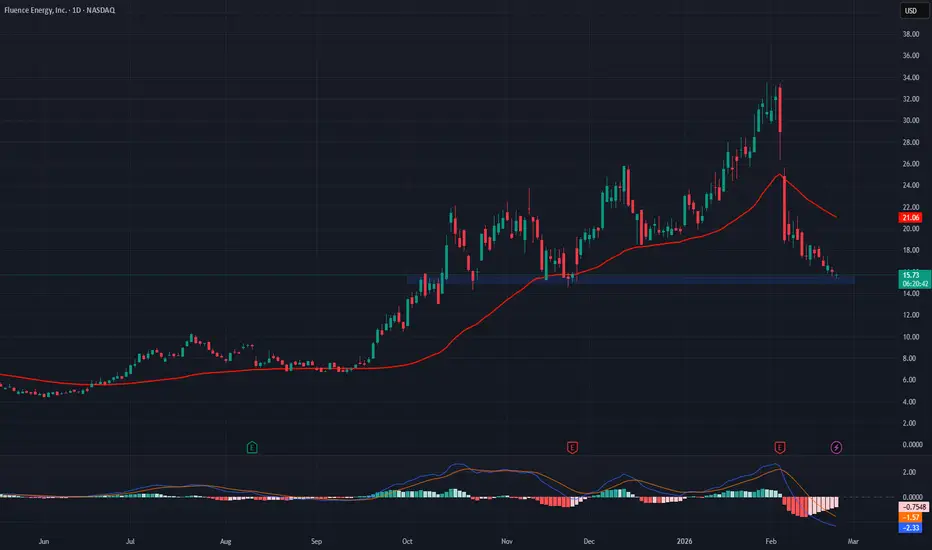
On the weekly timeframe, FLNC completed a full impulse toward 33.5 and is now in a deep corrective phase. Price has reached the 14.8–16.2 Confluence Zone — not just a level, but a structural decision point.
This zone combines:
• 0.618 Fibonacci retracement of the entire impulse (14.94)
• MA100 as dynamic support
• Historical accumulation range
• Descending trendline intersection
• Volume profile node
Five factors. One area.
The decline is occurring without expansion in volume. ADX is falling, indicating weakening downside momentum rather than acceleration. There is no evidence of panic distribution. This looks like pressure on support - not a structural collapse.
Now the asymmetry:
Below 14.5 → probability shifts toward 0.786 retracement near 9.89.
Above this zone → upside rotation toward 18.49, then 22.03, with 33.5 as the broader recovery level.
The risk/reward profile begins to favor buyers precisely in this range. Not higher. Not later. Here.
Fundamentally, scale remains intact:
TTM revenue ~2.55B.
Last quarter ~475M.
Q2 2026 revenue estimate ~640M.
EPS estimate −0.15 - profitability remains volatile as the company continues scaling.
This is infrastructure, not hype. Infrastructure moves in cycles — but cycles begin at compression points.
The 0.618 zone is not just a retracement. It’s a decision.
No fluff, just alpha 🚀
FLNC: Monthly Double Top & Trendline BreakdownThe Setup:
Fluence Energy ( NASDAQ:FLNC ) is exhibiting severe technical deterioration across multiple timeframes. Zooming out, the macro picture reveals a massive monthly double top , a classic distribution pattern signaling a major long-term trend reversal. This topping process has now triggered a decisive trendline break , violating primary structural support. On the daily timeframe, the stock is actively trading below a falling 50MA , which is acting as heavy dynamic resistance and suffocating any attempted relief rallies. Compounding this weakness, it is also trapped under the 10MA on the monthly chart, confirming that the bears are in full control of the larger macro trend and the path of least resistance is down.
Reasoning:
Monthly double top (Massive macro distribution pattern)
Trendline break (Major structural support failure)
Trading below falling 50MA daily (Dynamic resistance capping relief rallies)
Under 10MA monthly (Confirmation of long-term downtrend)
FLNC 1D – The power comeback!On the daily chart, Fluence Energy (FLNC) shows a clean cup and handle formation followed by a golden cross (MA50 crossing above MA200) - a textbook bullish reversal setup.
Price broke out of the structure and is now pulling back into the buy zone ($14.57–$16.80) - a confluence of Fibonacci support and previous resistance.
✅ Golden cross confirms trend reversal
✅ Rising volume supports the move
✅ MAs below price - bulls are in control
The first target sits near $27.43, while the second projection extends to $40.28 if momentum continues.
Fundamentally, Fluence remains a leader in energy storage and grid technology - a hot spot for global investment as the renewable sector accelerates.
Let’s just say - this chart looks fully charged ⚡️
Fluence Energy (FLNC) AnalysisFluence Energy NASDAQ:FLNC is a global leader in grid-scale energy storage, combining advanced battery systems with AI-enabled software to strengthen renewable integration, grid reliability, and peak-demand management.
Key Catalysts:
Record Backlog = Revenue Visibility
$5.5B backlog fully covers the midpoint of FY26 revenue guidance ($3.2–$3.6B), signaling strong contracted demand and long runway for deployments.
AI + Data Center Power Demand Expands TAM
Fluence’s storage platforms are increasingly aligned with hyperscaler and data center power needs, plus long-duration storage initiatives.
Opportunity pipeline grew ~30% (~$7B), led by U.S. demand—expanding growth beyond renewables alone.
Order Momentum Confirms Recovery
Q3 2025 new orders: $750M, with $500M+ from the U.S., highlighting strong domestic contracting activity.
Supports scaling of Fluence’s software-enabled storage and digital optimization offerings.
Investment Outlook:
✅ Bullish above: $15.00–$15.50
🎯 Upside target: $34.00–$35.00
Driven by backlog strength, AI-driven storage differentiation, and accelerating grid + data center demand.
FLNC - BullishFLNC – Volatility Expansion Thesis
The chart shows a multi-year range with two critical Volatility Expansion levels acting as the fulcrum of every major move. Price has repeatedly expanded away from these levels and then reverted back into them. They function as the midpoint of the entire structure.
1. Primary Setup
Price is attempting to reclaim the upper Volatility Expansion band near 17.40–17.76. Historically, every time price reclaimed this zone, it triggered a multi-month expansion leg to the upside (yellow arrow reference). When price failed this zone, the move unwound back into the lower expansion level at 14.83.
This is the same mechanic repeating now.
2. Why This Area Matters
This 17–18 zone is where prior expansions initiated and where prior failures collapsed. It is the single most important decision-making level on the chart. It represents:
• structural acceptance or rejection
• volume re-accumulation or distribution
• volatility compression or release
Holding above it converts the entire multi-year range into bullish continuation.
3. Current Structure
Price swept the lower expansion level at 14.83, held, and impulsively rotated back toward the upper expansion band. The current rejection wick only matters if price cannot reclaim 17.40–17.76. Reclaiming it confirms buyers stepping back into control and signals a new expansion cycle.
4. Expansion Target
The next untested zone is the large inefficiency at 36–38. This is the same grey box drawn on the chart. It is the only clean upside magnet left once price accepts above the expansion band. Liquidity is thin above 22, so the move accelerates quickly once the reclaim is secured.
5. Trigger
The trade is binary:
• Reclaim 17.40–17.76 → expansion toward 36–38.
• Fail the reclaim → mean reversion back toward 14.83.
Price is sitting right under the trigger and volatility is compressing, which usually leads to an expansion move.
$FLNCCompany Profile: A Leader in the Energy Transition
Fluence Energy, Inc. ( NASDAQ:FLNC ) is a pivotal player at the intersection of technology and the global energy transition. Founded in 2021 as a Siemens and AES company, the organization specializes in providing critical infrastructure and software for a sustainable future. Its core business is divided into two synergistic areas:
Energy Storage Products and Services: The company designs and delivers large-scale battery-based energy storage solutions that help stabilize electrical grids, integrate renewable energy, and replace fossil-fuel peaker plants.
AI-Enabled Digital Applications: Leveraging artificial intelligence, Fluence offers a suite of software platforms that optimize the performance and monetization of renewable and storage assets, creating an intelligent and responsive energy ecosystem.
As a relatively young public company, Fluence is positioned in a high-growth market, but its stock can exhibit significant volatility as it navigates its path to sustained profitability.
Technical Analysis: Navigating a Critical Juncture with Fibonacci Support
From a technical perspective, NASDAQ:FLNC is currently trading in a manner that requires close attention to key support levels derived from Fibonacci analysis. These levels act as a roadmap, indicating where buyers have historically stepped in and where the risk of a deeper decline increases.
The Fibonacci Framework: A Hierarchy of Support
The application of Fibonacci retracement levels to a significant prior price move (likely the swing from a major low to a high) has identified a clear ladder of potential support zones. These are critical for managing risk and identifying potential reversal points.
First Line of Defense (0.382 Fib - $15.99): This is the initial and most shallow key support level. A successful bounce here suggests that the underlying bullish momentum from the prior uptrend remains partially intact. It represents a healthy and shallow pullback where buyers are expected to defend the trend.
Secondary Support (0.500 Fib - $13.60): A break below the first support leads to this more significant level. The 50% retracement is a psychologically important midpoint and often serves as a strong battleground between bulls and bears. Holding here would still be consistent with a potential trend reversal or a deeper consolidation.
Critical Support (0.618 Fib - $11.21): This is known as the "Golden Pocket" and represents a deep retracement. A failure to hold at $11.21 would signal a substantial weakening of the bullish structure. It suggests that the prior upward move may have been fully retraced and opens the door for a test of even lower price levels, potentially revisiting the origins of the prior rally.
Synthesis and Strategic Outlook
The price action of NASDAQ:FLNC is at a critical point where these Fibonacci levels will determine its near-term trajectory.
Bullish Scenario: For the bullish case to regain strength, the price must find solid support at or above the $15.99 (0.382) level and begin to form a base for a new leg higher.
Neutral/Cautionary Scenario: A descent to test the $13.60 (0.50) and $11.21 (0.618) levels indicates a period of significant consolidation or distribution. While these can be areas for a potential bounce, they also signal increased selling pressure.
Bearish Scenario: A decisive and high-volume breakdown below the $11.21 (0.618) support level would be a strongly bearish technical development, invalidating the prior uptrend's strength and likely leading to a search for new, lower support.
Conclusion:
For NASDAQ:FLNC , the identified Fibonacci support zones at $15.99, $13.60, and $11.21 provide a clear and disciplined framework for navigating its inherent volatility. Investors and traders should monitor the price action around these levels closely. A hold at any of these zones could present an opportunity, but a break below the critical $11.21 level would necessitate a fundamental re-evaluation of the technical outlook.
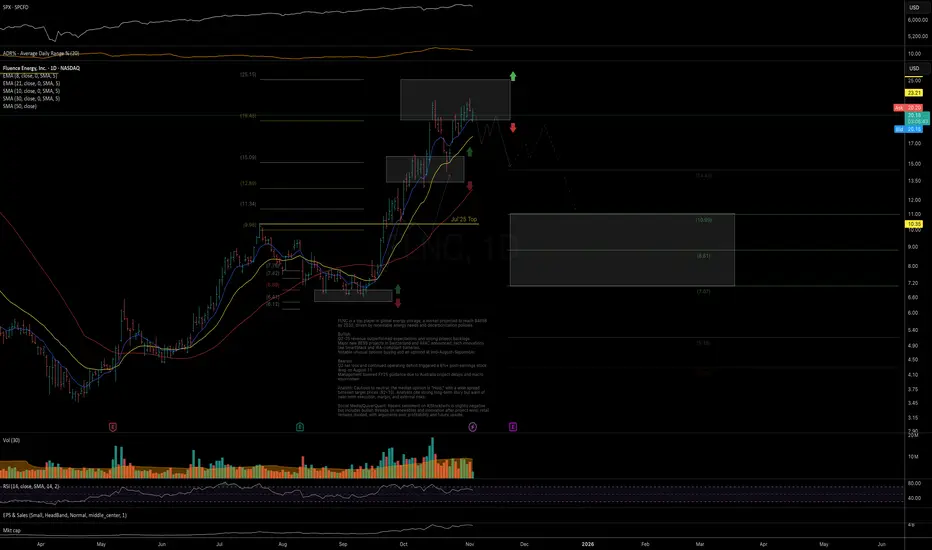
FLNC: double top potential Price has reached the key macro resistance target and may be forming a potential double top.
As long as price remains below 22, I’m watching for the first leg of downside to unfold toward the 21dEMA, with potential for a deeper move if bearish momentum starts to build.
Chart:
Previously:
• On bullish macro potential (Sep 18):
www.tradingview.com
• On follow-through (Sep 22):
www.tradingview.com
7/9/25 - $flnc - Does the AES offer...7/9/25 :: VROCKSTAR :: NASDAQ:FLNC
Does the AES offer...
- AES *apparently* got a takeout offer y day (check stock px)
- i'd believe it, as long as they don't get coreweave'd (*sigh*)
- that aside, i can swear i was reading about grid scale M&A in my newsflow and Grok isn't helping tn
- I think FLNC is super interesting given it's AES/ siemens ownership and given this AES topic/ buyout
- perhaps this asset gets divested
- i'd guess *if* and that's a h3ll of a guess... maybe a lot higher 30-50%
- probably a stock to have on high alert... if breaks the $9/$9.50 level i may ape with a bit more conviction.
V
oversold?shitter stock on my radar longed this break see if it can run. Ill be out if it on pullback below 4.50. 90% cut to Ebidta guidance. Has a domestic supply chain but capacity-constrained so 30% of revenue will be affected by the China tariffs. Although $4.5B backlog, 50% revenue growth despite some of their practices it's a very real company with a good bit of hate but insiders are buying sub $5 **
Short % of Shares Out 12.60%
Short % of Float 35.96%
Short Ratio (days to cover) 4.06
Fluence Energy, Inc. Stock Quote | Chart & Forecast SummaryKey Indicators On Trade Set Up In General
1. Push Set Up
2. Range Set up
3. Break & Retest Set Up
Notes On Session
# Fluence Energy, Inc. Stock Quote
- Double Formation
* (A+ Set Up)) At 40.00 USD | Completed Survey
* Wave Feature & Ongoing Wave (3)) | Subdivision 1
- Triple Formation
* (EMA Settings)) + Gap Fill | Subdivision 2
* (TP1) | Subdivision 3
* Daily Time Frame | Trend Settings Condition
- (Hypothesis On Entry Bias)) | Logarithmic Settings
- Position On A 1.5RR
* Stop Loss At 5.00 USD
* Entry At 3.50 USD
* Take Profit At 1.00 USD
* (Downtrend Argument)) & Pattern Confirmation
* Ongoing Entry & (Neutral Area))
Active Sessions On Relevant Range & Elemented Probabilities;
European-Session(Upwards) - East Coast-Session(Downwards) - Asian-Session(Ranging)
Conclusion | Trade Plan Execution & Risk Management On Demand;
Overall Consensus | Sell
2/10/25 - $flnce - Doing some work AH -38%...2/10/25 :: VROCKSTAR :: NASDAQ:FLNC
Doing some work AH -38%...
- i need to get up to speed here, so any comments appreciated
- but given the net cash balance... a -40% move basically translates to reducing 1 bn in implied enterprise value e.g. -60%.
- so i ask "is the result/ down guidance worth -60% on implied valuation"
- this is one of those situations where i think all else equal the chart doesn't help
- i'd like to get more fundamental basis here... but i'll take the "over" at the stock near $8. don't think there's much more than say 5-10% downside here in the ST whereas the upside might be 2x this.
- given my being new to this name, i'm keeping the trade (very) small and it's more for sport trading px action nothing else
V
FLNC Possible long ideaI closed CSIQ with some small loss, I didn't like how the stock acted once it broke the previous known resistance. I am also monitoring DORIAN LPG for closure if it doesn't start reversing on the current drop. I know you are not here to read about my missed trades but to find an idea where to go next.
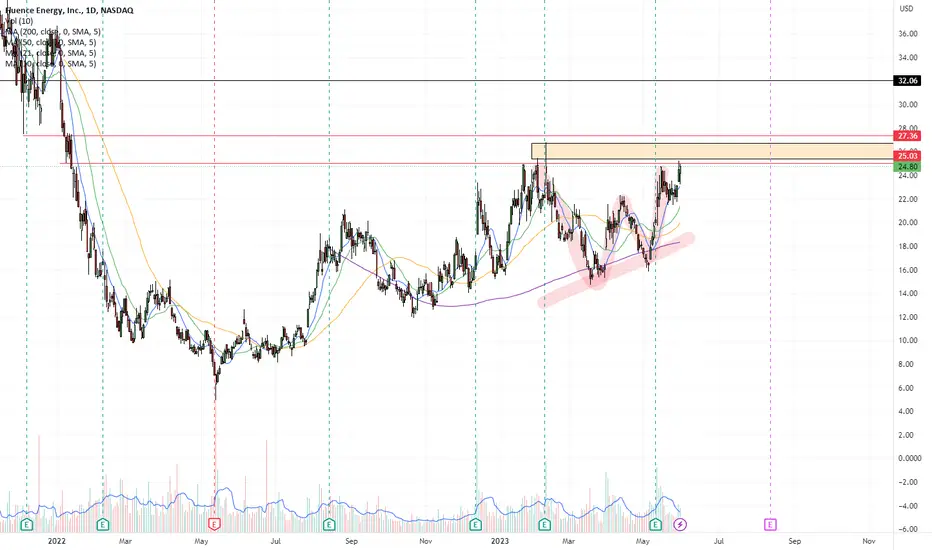
New stock which IPO-ed in October 2021 is currently on path to break it's resistance zone sitting at $25.33 level.
Some things to consider:
1. The resistance level is a bit bigger than usual, it goes from $25.33 to $26.77 level, so I am considering in adding to the position partially.
2. My first, smaller buy will be made this week surely. I am watching the stock and aiming for the $25 level for first potential buy.
3. I plan to add smaller positions all the way up, of course, that is if the stock goes up. Next buy level will be around $25.5
4. Exit plan will be set at $21.5 price level, which is just below the 10SMA on Daily level.
5. Next big adding point for me would be break of the $27.54 price level, since this line represent a significant resistance level. That level extends all the way up to $28.26 price level.
6. The last and the most important note is that the pattern we are having right now, known as double bottom, is about to break. If it breaks, nice run of the stock is to be expected.
Of course, as always, this is not financial advice nor I am eligible to provide some. This is just my two cents. Happy trading guys.
$FLNC Strong IPOcame across $FLNC this weekend so haven't have a chance to see it trade so not sure how spready it is but a strong looking alternate energy IPO that is acting very well.
Broke its down trending line (red dotted) and putting in a sideways cheat shelf.
looking for an inside day below supply line to give us a bit lower risk entry.