Greenpower Motor Company Inc. | Chart & Forecast SummaryKey Indicators On Trade Set Up In General
1. Push Set Up
2. Range Set up
3. Break & Retest Set Up
Notes On Session
# Greenpower Motor Company Inc.
- Double Formation
* Descending Triangle & 0.786 | Subdivision 1
* 1.15 | Center Setting | Short Continuation
- Triple Formation
* Pennant Structure & 0.236 | Hypothesis | Subdivision 2
* 345 Template | Trend Scale Setting(Short)
* 012345 | Wave Template Area | A+ Set Up | Subdivision 3
Active Sessions On Relevant Range & Elemented Probabilities;
London(Upwards) - NYC(Downwards)
Conclusion | Trade Plan Execution & Risk Management On Demand;
Overall Consensus | Sell
GreenPower Motor Company Inc.
No trades
No trades
In-depth trading ideas
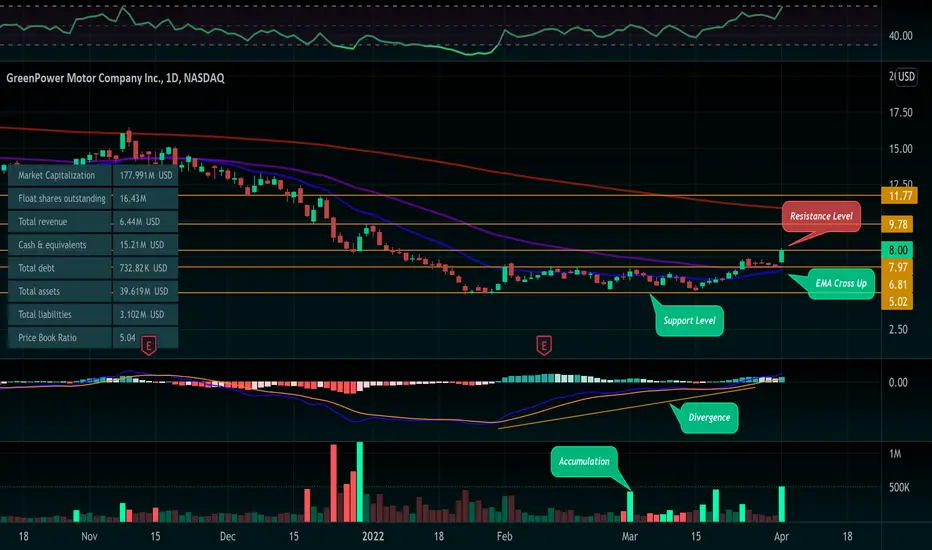
GreenPower Motor Swing IdeaGreenPower Motor appears to be in a reversal from a strong support at $5.
Reviewing the weekly chart, you can find upcoming resistance levels.
Good Balance Sheet in a hot sector.
Entry target: $8.23
Exit target: $9.61 (adjust accordingly with price action)
~14% swing idea.
Using $8 level as risk management if entry target hits.
$GP - Inv SHS Opportunity.GreenPower Motor Co., Inc. engages in designing, manufacturing, and distributing electric powered vehicles for commercial markets.
It offers electric-powered school buses, vans, charter buses, and double-deckers.
The company was founded by Fraser Atkinson and Phillip W. Oldridge on March 30, 2010, and is headquartered in Vancouver, Canada.
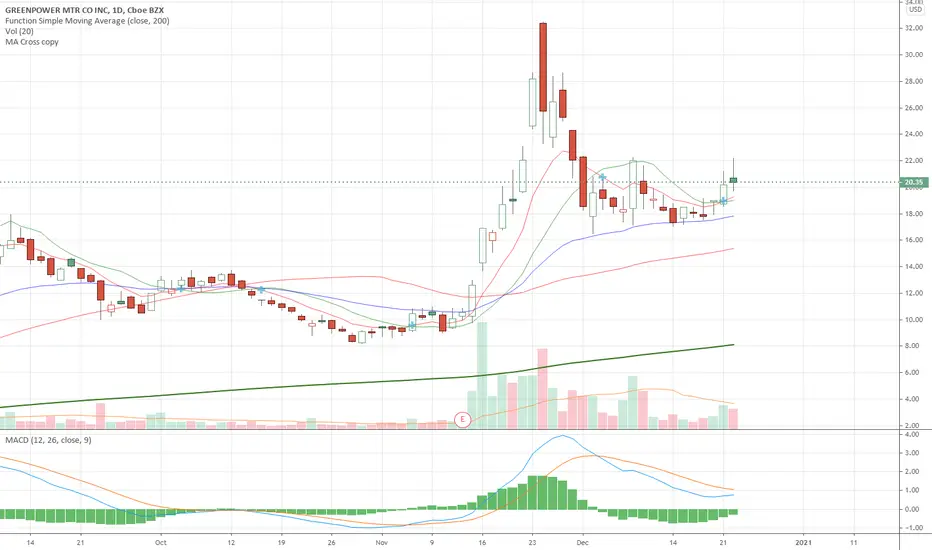
Stabilizing above 20$ is essentially required.
Main support - 18$.
I do not recommend buy or sell GP stocks.
$GPV.V and $GPV BreakOut Idea Related to the EV momentum growing1: Commercial EV Maker ( EV industry is strong and full of momentum)
2: Stage 1: Trendline flatten from 2015 to Jun 2020
3: stage 2: 20MV crossing 50MV and line from flatten to trend upward and big volume up
4: Forming TRUE cup with handle
TRUE Conditions:
volume support for the base of
the cup @ point A ;
the wedge down handle
formed @ point B
5: tight area/tight 7 weeks/ consolidation (support: volume dry-up)
6: AWAITING VOLUME BREAK OUT @ tight area; it will be a buy point
7: stop loss will be the lowest price of the break out day/ the base of tight area
It is my first idea to publish. Welcome to comment below.
GP (Was GPVRF in the OTC Markets)This thing went from $0.1x to $1 not too long ago in the OTC Markets and then I believe had a reverse split, not that it shouldn't have appreciated but I think it will come back down and I bet the ascending triangle will play out before everyone is driving an electric vehicle... Can you stay solvent longer than the market can stay irrational? I guess we will see if this particular idea can.
Pattern update Posted a chart about this stock a couple a weeks back (Link below).. here's a close up break down of the cup and handle formation needed to now push it through the symmetrical triangle. this triangle has been forming for 5 months so the breakout should be huge. Note the last candlestick is sitting right on weekly support line (Whiteline). I'm closing my positions if support line doesn't hold or if drops below 29$
Red shade area : Cup
yellow area :Handle
Purple line inside yellow area : Resistance/Double bottom breakout
White lines : Symmetrical triangle lines
Greenpower about to ride the EV trendRSI increasing, 20 serving as a first ceiling, with the marketcap of 300 million this company is way undervalued compared to competitors who have a California HQ presence but no product. One of two major players in the ev market that is currently generating revenue. The other one is $tsla.