MCHP | Continued stock growth- Timeframe: Weekly
- Trade type: Buy stop order
- Price: 75.16
- Take Profit: Open
- Stop Loss: 70.94 (-5.60 %)
Idea: Long on a breakout above last week's high - bullish momentum continuation.
Entry: Buy stop above last week’s high.
Stop-loss: Below the low of the same candle.
If the weekly candle closes below this level, the trade is invalidated.
In-depth trading ideas
$MCHP: Wave (5) Completed — False Breakout, Triggers Pullback📉 📉 📉
The semiconductor sector has enjoyed an incredible run, but sophisticated capital tracks when the trend exhausts.
If you are looking for an aggressive momentum pivot to compound capital, Microchip Technology Inc.
#MCHP is presenting a textbook structural short setup.
The daily chart shows a clean, completed macro 5-wave Elliott structure.
Friday's aggressive breakdown volume has officially confirmed a structural bull trap.
1. The Technical Setup: False Breakout & Liquidity Sweep Looking closely at the daily structure price finished its multi-month expansion at Wave (5), briefly sweeping liquidity just above the 105.38 High.
The Trap: MCHP attempted to sustain momentum above the vital 2024 high of 95.25, but completely failed to attract institutional follow-through.
Instead, it formed a massive distribution cluster.
The Confirmation: Friday’s -8.27% liquidation event slammed price straight down to 88.34. In a single daily session, sellers wiped out weeks of grinding price action, plunging straight back below the 95.25 structural floor on massive volume expansion.
The trap has sprung.
2. The Fundamental Catalysts: Re-Rating Premium Valuations.
A technical trap needs macro headwinds to sustain a downward move.
Friday gave us the ultimate fundamental double-whammy: The Sector Overhang: Broadcom's recent guidance data reset expectations regarding the blistering pace of macro #hyperscaler and #AI chip spending.
This removed a core growth catalyst that was keeping high-multiple semiconductor stocks afloat.
The Discount Rate Shift: Friday’s stronger-than-expected US jobs report (172,000 payrolls) effectively crushed immediate hopes for interest rate cuts.
Stocks trading at premium multi-year forward P/E valuations are hyper-sensitive to these macro discount rate changes.
When rate cuts are delayed, high-multiple semi valuations contract rapidly.
🎯 Tactical Short Execution Plan
Because the daily candle closed right at its session lows (88.34), shorting directly into the hole carries near-term execution risk if the broader index attempts a Monday morning relief bounce.
We want to execute on a low-volume retest of the broken floor.
The Entry Zone: Look to establish a short position on a lower-timeframe dead-cat bounce back toward the 91.50 – 93.00 cluster (retesting the breakdown value area).
The Stop Loss (Invalidation): Strict stop placement on a daily close back above 95.25 (the broken 2024 high line).
If the bulls manage to re-claim this level, the bearish thesis is instantly invalidated and we preserve capital.
Take Profit (TP) Target 1: The pink consolidation zone between 80.00 and 83.00.
This marks the peak of the previous Wave (3) cluster and serves as natural structural support.
Take Profit (TP) Target 2: The blue structural liquidity pool down at 68.00 if the tech sector encounters a deeper macro ABC correction.
💬 What's Your View on Semis?
Is MCHP signalling a broader tech rotation, or do you think the dip buyers step back in at the 80s support block?
Drop your targets and perspectives in the comments section below!
If you want to follow the compounding journey and catch updates on this short trade, make sure to hit that Follow button!
(Disclaimer: Not financial advice.
Manage your risk according to your own capital allocation rules.
If you don't have any Rules make them before entering financial markets)
MCHP | Continued stock growth- Timeframe: Weekly
- Trade type: Buy stop order
- Price: 81.41
- Take Profit: Open
- Stop Loss: 75.06 (-7.80 %)
Idea: Long on a breakout above last week's high - bullish momentum continuation.
Entry: Buy stop above last week’s high.
Stop-loss: Below the low of the same candle.
If the weekly candle closes below this level, the trade is invalidated.
MCHP: Massive Cup & Handle Formation Nearing BreakoutEarnings Could Be the Catalyst 🚀
Microchip Technology has been building a multi-year Cup & Handle pattern on the weekly chart. After completing the cup below the trendline resistance, the stock is now forming a tight, downward-sloping handle, often the final consolidation before a potential impulsive move.
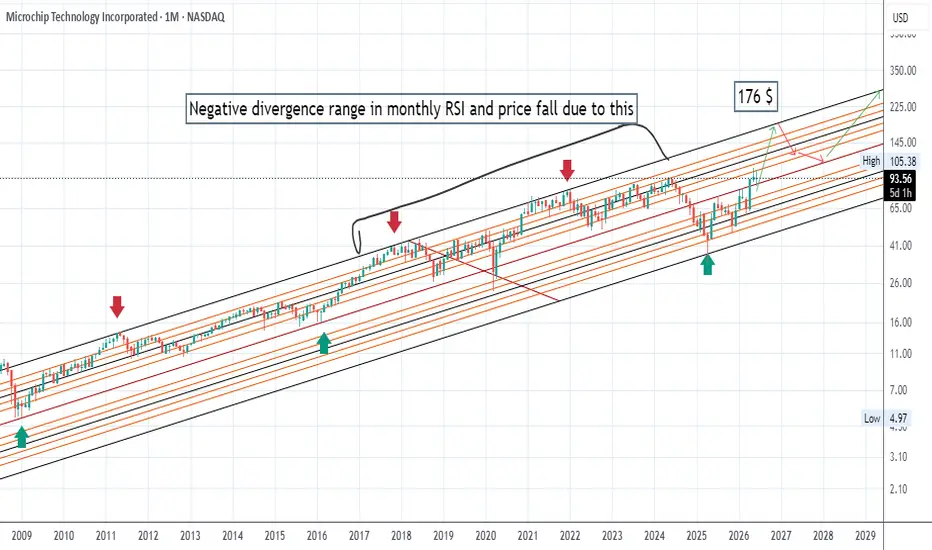
The handle is narrowing, volatility is contracting, and price is approaching the key breakout level. A sustained move above $104 would confirm the pattern and open the door for the measured target near $170, representing a potential gain of more than 60% from the breakout zone.
Today's earnings may provide exactly the catalyst bulls have been waiting for.
📊 Earnings Update
✅ Beat on both revenue and EPS
Revenue exceeded Wall Street expectations as industrial, automotive, aerospace and AI-related data center demand continued to improve.
EPS also came in above consensus.
Management issued stronger-than-expected guidance for the next quarter, signaling that the semiconductor recovery is gaining momentum. Shares rallied in after-hours trading following the report.
Technical Levels
🔹 Breakout Confirmation: Weekly close above $104
🟢 Support: ~$70
🎯Target: ~$120-150
🎯🎯 Measured Target: ~$170
As always, confirmation is key. The best setups are those that combine strong fundamentals, positive earnings surprises, and high-probability technical structures. MCHP is attempting to align all three.
Will this week's candle become the breakout that completes the pattern? 👀
MCHP | June, 2026 | Continued stock growth- Timeframe: Weekly
- Trade type: Buy stop order
- Price: 101.93
- Take Profit: Open
- Stop Loss: 93.92 (-7.90 %)
Idea: Long on a breakout above last week's high - bullish momentum continuation.
Entry: Buy stop above last week’s high.
Stop-loss: Below the low of the same candle.
If the weekly candle closes below this level, the trade is invalidated.
Take Profit: Trailing stop following the lows of new weekly candles.
Microchip Technology Rebounds as Buyers Step In on PullbackMCHP continues to attract buying interest following its recent retracement. The stock remains in a bullish trend, forming higher highs and higher lows while trading above its well-aligned 20 and 50 moving averages, reflecting sustained upward momentum.
Microchip Technology, Inc. engages in the provision of semiconductor products and operates through the Semiconductor Products and Technology Licensing segments. The Semiconductor Products segment focuses on the design, development, manufacturing, and marketing of microcontrollers, development tools, analog and interface products, mixed-signal solutions, connectivity devices, and timing products. The Technology Licensing segment generates revenue through license fees and royalties related to SuperFlash embedded flash and SmartBits one-time programmable technologies.
MCHP is regarded as a wide economic moat company, supported by its strong position in embedded control and analog semiconductor markets. The company has delivered revenue and EPS growth in two of the last three quarters. Operating margin and net margin stand at 17% and 11%, respectively, while ROE and ROIC are 3% and 2%. In addition, the company maintains a healthy balance sheet with a current ratio of 2.1x and a debt-to-equity ratio of 0.9x.
The Dynamics Behind Price action for Buy ZonesAs you become more proficient in your trading you need to add to your education and start understanding the dynamics behind price action. You need to learn more than just candlestick patterns or indicator patterns.
Asking WHO is on CONTROL of PRICE is the first step. This will tell you with a high degree of accuracy what price is most likely to do in the near term.
Don' try to "predict". In fact get rid of that term altogether in your trading as all it does is mess with your emotions and establishes the wrong mental attitude.
Professionals do not predict. Only amateurs and wanna be famous retail gurus and of course the famous financial people who want YOU to do the buying or selling in panic so they can become richer.
Instead focus on who is in control of price over the past few days to about a week for swing trading. Study the history on the daily chart also so you can understand the information the chart is revealing to you over time.
Once you understand who controls price, you can see in the past months what happened afterward. Then you can determine with a high degree of PROBABILITY a math term and used in many areas of research, the probability of the direction, gap or no gap risk, strength of the run, duration of the run, and point gain potential of swing trading that stock, as well as the risk to Profit ratio which you should always do before buying or selling short a swing style run.
MCHP Shows Upward Momentum, Target $77 (15% Move)MCHP has been trading in a sideways wedge range between roughly $62/68 since July, forming a descending wedge pattern. The price is approaching a breakout above the upper boundary of this consolidation, near the 1.618 Fibonacci level. It sits slightly above both the 50 and 200 day SMAs, offering dynamic support. Indicators show mild bullish signals: RSI at 57, MACD positive, but Stochastic in overbought territory suggests a possible short-term pullback. Volume shows buying dominance, though overall levels remain low. The recent breach of the descending trendline with a possible confirmation for by October 23th hints at a potential upward move, targeting around $77 , assuming the current momentum continues. Key support lies near $62/63, with immediate resistance around $68/69.
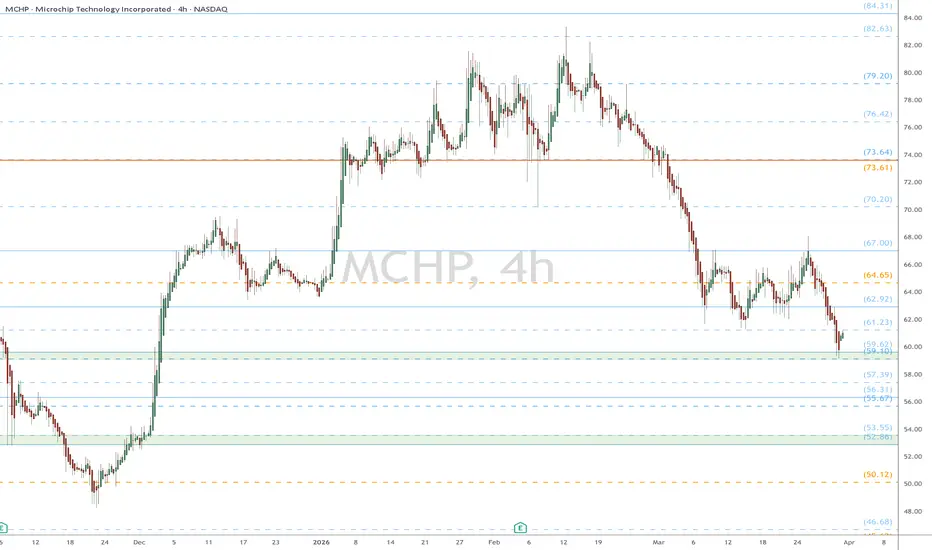
MCHP watch $52.86-53.55: Dual Fib support zone may hold the DUMPMCHP apparently had a disappointing earnings report.
It dumped into a significant support at $52.86-53.55
Look for consolidation above the zone then recovery.
.
Previous Analysis that caught a PERFECT entry AND exit:
Hit BOOST and FOLLOW for more such PRECISE and TIMELY charts.
=========================================================
.
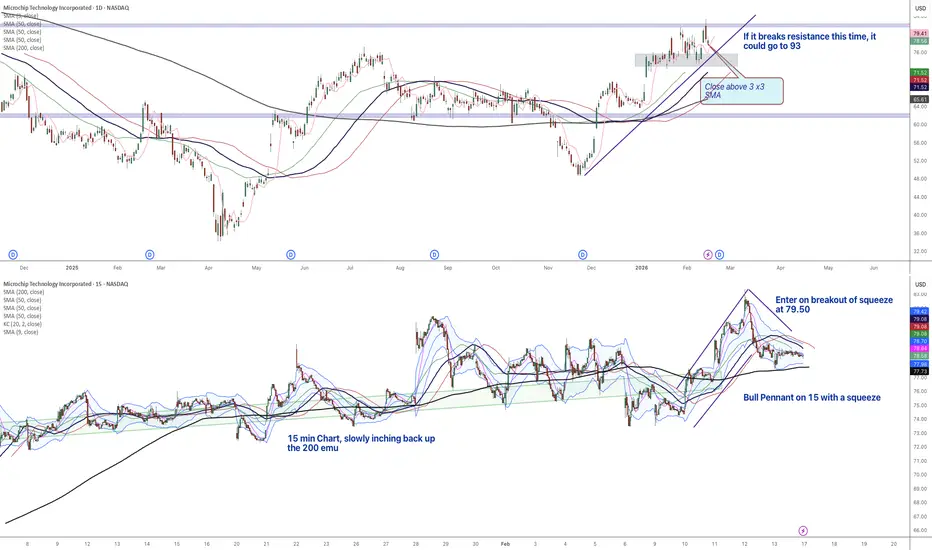
MCHP: accumulatelooking good here on the daily as it broke out of its price wedge and took out its volume shelf. lower indicators all look positive. Really want to see a good candle build into week's end along with stronger volume bars (hence accumulate). Everyone focused on direct AI plays at the moment. Dotted lines are where I would like to add. Daily close below 60.84 invalidates. First target is 71ish then the gap at 73.50ish. Overall market notwithstanding, id like to see >20% move.
$MCHP | Microchip Technology — Monthly Macro PlaybookNASDAQ:MCHP | Microchip Technology — Monthly Macro Playbook
This chart illustrates the multi-decade rhythm of NASDAQ:MCHP , highlighting how past cycles and technical structure provide clarity on the current setup.
Historical Market Cycles & RSI Trends
Each gray circle marks a key market structure low with:
A bounce from macro Fibonacci retracement zones
A bullish RSI crossover through its signal line (white MA)
A recovery from oversold or mid-40 RSI levels, signaling trend reversal
We’ve now entered the fourth identical cycle dating back to 2009.
Current Technical Structure
Price just bounced off the 0.618–0.786 retracement zone from the 2020–2021 cycle.
Strong reversal candle printing off volume support, reclaiming major EMAs.
RSI is breaking through its signal line, just as it did in 2012, 2016, and 2019 — each of which led to multi-year rallies.
Fibonacci-Based Price Targets
Using prior extensions from similar fractals:
PT1: $102.77 — 1.0 extension of the last impulse
PT2: $148.71
PT3: $238.30
These are not short-term targets, but structural projections if this macro cycle repeats.
Macro Thesis
When price + momentum + Fib structure + RSI rhythm align like this, it usually sets the stage for multi-year compounding upside.
This chart doesn’t predict the future.
It just reminds us the past leaves footprints.
And NASDAQ:MCHP ’s footprint says: “This is where cycles begin.”
MCHP – 30-Min Long Trade Setup!📈
🔹 Ticker: MCHP (NASDAQ)
🔹 Setup: Falling Wedge Breakout + Oversold Bounce
🔸 Breakout Zone: ~$40.74 (yellow zone breakout)
📊 Trade Plan (Long Position)
✅ Entry Zone: $40.60–$40.80
✅ Stop Loss (SL): Below $39.08 (white key level)
✅ Take Profit Targets:
📌 TP1: $43.27 (red zone – resistance shelf)
📌 TP2: $46.10 (green zone – gap-fill target)
📐 Risk-Reward Breakdown
📉 Risk:
$40.74 - $39.08 = $1.66
📈 Reward to TP1:
$43.27 - $40.74 = $2.53 → 1.52:1 R/R
📈 Reward to TP2:
$46.10 - $40.74 = $5.36 → 3.22:1 R/R
🔍 Technical Highlights
Oversold bounce with bullish reversal candle
Falling wedge breakout forming
Yellow zone reclaim signals strength
Heavy sell-off likely overextended = high bounce potential
⚙️ Trade Management
🔄 After TP1:
– Move SL to breakeven
– Book partial gains
📈 Let rest run to TP2 with trailing stop under rising support
⚠️ Invalidation Triggers
❌ Break and close below $39.08
❌ Rejection with heavy volume at yellow zone
❌ Bearish engulfing back into wedge range
MCHP – 30-Min Long Trade Setup!📈
🔹 Ticker: MCHP (NASDAQ)
🔹 Timeframe: 30-Min Chart
🔹 Setup Type: Falling Trendline Break + Support Reclaim
🔸 Breakout Price: ~$48.47
📊 Trade Plan (Long Position)
✅ Entry Zone: $48.40–$48.50 (bullish breakout + yellow resistance zone retest)
✅ Stop Loss (SL): Below $47.62 (white support zone – structure low)
✅ Take Profit Targets:
📌 TP1: $49.63 (red line – minor resistance/supply zone)
📌 TP2: $50.81 (green line – previous high / major resistance)
📐 Risk-Reward Ratio
📉 Risk per Share:
$48.47 - $47.62 = $0.85
📈 Reward to TP1:
$49.63 - $48.47 = $1.16 → 1.36:1 R/R
📈 Reward to TP2:
$50.81 - $48.47 = $2.34 → 2.75:1 R/R
🔍 Technical Confluence
📌 Falling Trendline (pink): Finally broken with volume picking up
📌 Demand Zone Support: Bounce from ~$47.60, confirming buyers stepped in
📌 Yellow Zone: Acts as breakout retest + confirmation trigger
📌 Volume Observation: Look for volume continuation above yellow zone
⚙️ Execution & Risk Management
🔄 After TP1 Hit:
— Move SL to breakeven
— Book 50% profits
📈 Let the rest ride to TP2
📉 Use a trailing stop method above each support level
⚠️ Invalidation Signals
❌ Close below $47.62
❌ Breakout without follow-through
❌ Sharp rejection from yellow zone = fakeout risk
🦅 Final Thoughts
✔ Textbook reversal pattern
✔ Strong structure + tight risk = smart setup
✔ High potential for upside as market reclaims control