In-depth trading ideas
E-Commerce King Recharges: Why MELI is a Buy at Trendline
The Bull Case Description
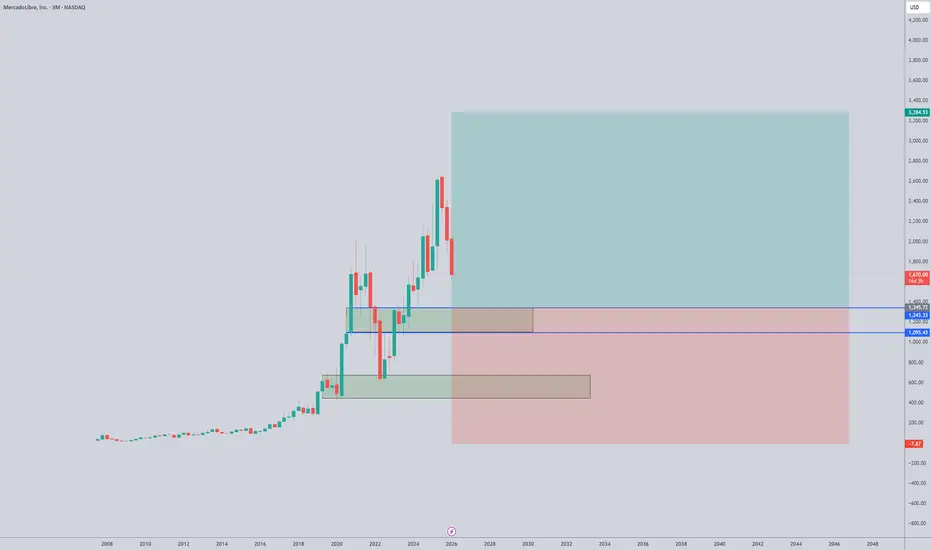
Technical Setup: The monthly chart for MercadoLibre (MELI) shows one of the most consistent long-term growth trajectories in the market. We are currently seeing a healthy consolidation phase where the price is interacting with a major multi-year ascending trendline.
From a Fibonacci perspective, the $2,020 level (Fib 1) acted as a crucial pivot. As long as the price maintains its structural integrity above the $2,000–$2,100 zone, the path of least resistance remains upward. The next major technical milestone is the 1.618 extension at $4,274, followed by a blue-sky target at the 2.618 level ($14,373) for the patient long-term investor.
Fundamental Drivers:
E-commerce Dominance: MELI continues to widen its moat through Mercado Envios. With nearly 75% of items delivered within 48 hours across a challenging Latin American geography, its logistics network is virtually impossible for competitors to replicate.
Fintech Tailwinds: Mercado Pago has evolved from a simple payment tool into a full-scale financial ecosystem. The rapid expansion into credit and yielding accounts is driving massive ARPU (Average Revenue Per User) growth, even in high-inflation environments.
New Frontier Potential: Recent news regarding the reopening of the Venezuelan market offers a massive, untapped e-commerce and fintech frontier that could fuel the next decade of growth.
Margin Resilience: Despite heavy investments in logistics and credit expansion, the company’s ability to maintain high revenue growth ($7.41B in Q3, up ~40% YoY) demonstrates the power of its ecosystem.
The Verdict: We are looking at a "Best in Breed" compounder trading at a technical "buy zone." The combination of an unmatched logistics moat and a high-growth fintech engine makes MELI a cornerstone for any growth-oriented portfolio.
MercadoLibre, Inc. MELIMercadoLibre, Inc. has built the largest e-commerce and fintech ecosystem in Latin America, combining online retail, digital payments, consumer credit, logistics, and merchant solutions into an integrated platform. Its diversified business model provides exposure to the region's ongoing digital transformation while benefiting from the growing adoption of online commerce and financial technology.
From a long-term technical standpoint, the broader market structure continues to reflect a constructive trend. The higher-timeframe pattern remains intact and serves as the primary reference for evaluating the stock's longer-term direction. As long as this framework remains technically healthy, the larger trend deserves continued attention.
The lower timeframe, however, has not yet delivered the degree of confirmation that would strengthen alignment with the broader picture. Rather than assuming that the higher-timeframe trend will immediately continue, it may be prudent to wait for the technical evidence discussed in previous analyses to become visible on the shorter-term chart.
The following developments may help reinforce the broader technical framework:
• Formation of a well-defined bullish structure on lower timeframes.
• Increasing evidence that buyers are gradually gaining control of price action.
• Improvement in momentum following periods of consolidation.
• Better synchronization between lower- and higher-timeframe market structure.
• The 200-period moving average gradually shifting beneath price, providing one of the simplest objective references for trend confirmation.
Charts can provide valuable information about market behavior, but they represent only one side of the investment process. Combining technical analysis with fundamental research—including Discounted Cash Flow (DCF), Free Cash Flow to Firm (FCFF), Free Cash Flow to Equity (FCFE), and other intrinsic value methodologies—may provide a more comprehensive understanding of both timing and business quality.
Rather than approaching the market solely through the lens of short-term trading, some participants choose to focus on identifying fundamentally strong businesses and allowing time to become an ally. In that framework, technical analysis serves to improve execution, while long-term value creation remains the primary objective.
This publication reflects a personal interpretation of market structure and publicly available information. It is intended solely for educational and informational purposes and should not be interpreted as financial advice or as a recommendation to buy, sell, or hold any financial instrument. Readers should conduct their own independent research, evaluate valuation assumptions, and apply appropriate risk-management practices before making any investment decision.
MELI Analysis (Waiting for June 2026)MELI remains structurally bullish on higher timeframes. The weekly chart still looks like a healthy correction within a broader uptrend rather than a trend reversal. On the 4H timeframe, the recent drop looks like an exhaustion move and a potential absorption zone, but I still want confirmation before entering.
My forecast is to enter around June 16th near 1400, give or take, but only after confirmation. That means I would prefer to see price reclaim strength, hold support, and print clear bullish confirmation before taking the trade. If that happens, the setup could offer a strong continuation move; if not, I would stay patient and wait for a cleaner signal.
MercadoLibre Bounce Setup: Dip Buyers Target $1,630 This WeekCurrent Price: 1546.81 (Analysis was generated on Monday Morning)
Direction: LONG
Confidence level: 64%(Professional traders describe the pullback as consolidation after a melt-up while X sentiment shows more bullish than bearish posts. However margin compression and recent volatility reduce conviction.)
Targets
Target 1: 1595
Target 2: 1630
Stop Levels
Stop 1: 1510
Stop 2: 1485
Key Insights:
Here’s what’s driving the setup right now. Several professional traders described the broader market pullback as a healthy consolidation after an extended melt‑up rather than a structural breakdown. In that context, high‑growth names like MercadoLibre often experience sharp pullbacks before stabilizing and bouncing.
The second factor is social momentum. On X, bullish posts significantly outnumber bearish ones among trading‑focused accounts. Many traders are framing the recent drop as a “buy‑the‑dip” scenario following strong revenue growth. When sentiment stays optimistic during a correction, it often creates short‑term rebound setups.
What really stands out is how the stock is sitting relatively close to a clear support zone near the $1,495–$1,510 region. That’s close to the recent 52‑week low and the level many traders are watching as a structural floor. When price approaches support while sentiment remains constructive, bounce trades become more attractive.
Recent Performance:
The recent price action has been dramatic. MELI dropped sharply after its May earnings report, including a single session decline of more than 12%. Over the last week the stock slid from around $1,870 to the current $1,546 area as investors reacted to margin compression from aggressive investment in logistics and credit products. Despite the selloff, the company still reported revenue growth near 49% year‑over‑year — a key reason many traders still see upside potential.
Expert Analysis:
Several professional traders emphasize that the selloff looks more like a growth‑stock reset than a trend reversal. The market punished the stock because operating margins dropped, but traders point out that the company intentionally increased spending to expand its fintech and logistics ecosystem across Latin America.
Technically, traders are watching the $1,594 area as the first meaningful resistance — it was the recent intraday high after the earnings drop. A push through that level could trigger short‑term momentum buying toward the $1,630 region, which aligns with prior support that may now flip into resistance.
News Impact:
Recent headlines focused heavily on margin pressure, which explains the rapid selloff. MercadoLibre expanded credit card issuance and logistics investment, temporarily compressing margins to around 6.9%. At the same time, revenue growth, payment volume, and marketplace activity all accelerated strongly. That combination — strong growth but weaker margins — often creates volatility in the short term while leaving the long‑term story intact.
Trading Recommendation:
So where does this leave us? I’m leaning LONG for a short‑term rebound trade. The stock is sitting close to major support while trader sentiment remains optimistic and analysts still see large upside over time. My plan would be to look for continuation above $1,560–$1,570 and target a move toward $1,595 first, then potentially $1,630 if momentum picks up. Risk management matters here — if price breaks below $1,510, the bounce thesis weakens quickly.
MELI MAY 2026MELI remains under institutional selling pressure after rejecting the upper range. Price is trading below the 1850 target zone and far below the 2020 resistance, which keeps the structure defensive.
The key support remains 1520, aligned with the double-bottom and gap protection area. If buyers defend 1520, MELI could attempt a retest toward 1850 and then 2020. A reclaim above 2020 would open the higher EPS target zone near 2400.
If 1520 fails, the next downside liquidity area is near 1300, where monthly support and prior institutional orders are located.
Upside targets:
1850
2020
2400 if momentum improves EPS
Downside targets:
1520
1300 if support breaks
Institutional bias: neutral to bearish below 1850. Bullish only with strong volume reclaim above 2020.
MercadoLibre: Dominant Platform, Uncertain Returns on CapitalExecutive Summary:
MercadoLibre is a high quality platform business with powerful ecosystem advantages across Latin America. Growth has been strong and the company has built a formidable competitive position. However, at roughly $1,870 per share, the available valuation evidence does not clearly show a sufficient margin of safety for disciplined long term value investors.
One Stock, Dozens of Voices:
This view does not come from a single analyst. CrowdWisdom aggregated 5 independent sources for MELI (1 live market intelligence feeds; 3 prior CrowdWisdom analysis snapshots (internal archive); 1 verified financial data checks (Yahoo Finance)) and synthesized the shared thesis: where traders, investors, and researchers broadly agree, where opinions diverge, and what the market might be overlooking.
The evidence was then stress tested by placing opposing views side by side: a bull case, a bear case challenging the consensus, and an assessment of what expectations already appear embedded in the stock price. Financial metrics were cross validated against live market data.
The goal is straightforward: identify where the narrative holds together, where it breaks down, and whether today’s price leaves any real margin of safety.
Business Quality and Moat Durability:
MercadoLibre runs the most comprehensive digital commerce ecosystem in Latin America. Its platform combines online marketplaces, digital payments, logistics infrastructure, merchant financing, and consumer credit into a single integrated system. In many ways it resembles a hybrid of Amazon, PayPal, and Shopify, but built specifically for emerging markets.
The strength of the business comes from several reinforcing network effects.
At the core is the two sided marketplace. Buyers attract sellers and sellers attract buyers. Once enough liquidity forms on both sides, the platform tends to become the default destination for online commerce.
The second layer is logistics. Latin America has historically suffered from fragmented shipping networks, inconsistent delivery infrastructure, and unreliable addressing systems. MercadoLibre spent heavily building fulfillment centers and coordinating deliveries through its logistics network. The result is faster and more reliable shipping for both merchants and customers.
The third layer is digital payments. Mercado Pago began as a payment processor inside the marketplace but has grown into a broader digital wallet and merchant payments network used across both online and offline commerce.
The fourth layer is credit. Using transaction data generated across the ecosystem, the company can extend loans to merchants and consumers based on behavioral data rather than traditional credit histories.
Together these layers create a powerful flywheel. Merchants come for marketplace traffic, adopt payments for convenience, access credit tied to transaction history, and increasingly depend on the platform for logistics.
Today the moat appears stable and gradually widening. Each additional merchant or user increases network density and raises switching costs. The key question, however, is whether the infrastructure investments supporting that moat ultimately earn returns above the cost of capital.
Return on Invested Capital (ROIC):
For long term investors, the most important issue is the trajectory of incremental returns on capital.
Historically the marketplace business was relatively asset light. Once the software infrastructure existed, additional transactions required minimal incremental capital. Businesses like that can produce exceptionally high returns on invested capital.
Over the past several years the strategy has shifted. MercadoLibre has invested aggressively in logistics networks, fulfillment centers, and fintech credit portfolios. These areas require significant capital.
Precise ROIC figures were not available in the verified forensic dataset used for this report. That absence is notable because ROIC is one of the clearest indicators of a company’s long term compounding ability.
Conceptually, the economics could evolve in two different directions.
If logistics density continues to improve and payments adoption expands, the infrastructure could support much higher transaction volumes without proportional cost increases. In that scenario, returns on incremental capital remain attractive.
But if the logistics network behaves more like a traditional delivery operation, returns could drift toward the lower levels typical of retail logistics and lending businesses.
In other words, the company is gradually moving from a pure software platform toward a hybrid model combining ecommerce, payments processing, logistics, and consumer lending. The long term returns profile of that mix remains uncertain.
Quality of Earnings:
Evaluating earnings quality means comparing accounting profits with underlying cash generation.
Available financial data shows annual revenue approaching $29 billion with gross margins around 50 percent and operating margins slightly above 10 percent. At face value, that profile suggests a profitable platform operating at meaningful scale.
However, signals around free cash flow are mixed. One dataset indicates negative free cash flow, while other analysis suggests cash generation has improved materially in recent years. That inconsistency highlights limitations in the available evidence.
Several structural factors can create divergence between reported earnings and cash flow.
Capital expenditures tied to logistics infrastructure require continued spending on warehouses and transportation systems.
Working capital requirements increase as payment volumes and merchant activity expand across the ecosystem.
Growth in the lending portfolio can also absorb cash temporarily, even when the lending operation itself is profitable.
If accounting earnings continue rising while free cash flow lags, the implication may be increasing capital intensity. Investors should pay close attention to whether reported profits translate into durable owner earnings.
Capital Allocation Scorecard:
MercadoLibre currently favors reinvestment over shareholder distributions.
The company does not pay a dividend and share repurchases appear limited relative to its market capitalization. Instead, capital has largely been directed toward expanding logistics infrastructure, payment systems, and fintech products.
That strategy makes sense during periods of strong growth, provided incremental returns remain above the cost of capital.
The risk is that these infrastructure investments become structurally expensive. Logistics and credit businesses typically generate lower returns on capital than pure software platforms.
From a value investor’s standpoint, the capital allocation approach looks sensible but still unproven over a full cycle.
Customer and Revenue Concentration:
MercadoLibre does not face the traditional customer concentration risk common in enterprise technology businesses. Revenue is spread across millions of buyers and sellers on the platform.
Geographic concentration, however, is meaningful.
Brazil, Mexico, and Argentina account for the majority of platform activity. Economic instability in any of these markets can affect ecommerce demand, payment volumes, and credit performance at the same time.
That exposure introduces currency volatility, inflation cycles, and shifting regulatory environments across multiple jurisdictions.
Management Alignment:
MercadoLibre has long been associated with founder leadership and a management team that takes a long term strategic view. Founder led companies often show stronger alignment with shareholder value creation over extended periods.
Detailed insider ownership and compensation structures were not included in the dataset used for this analysis. Investors should review regulatory filings to confirm the level of insider ownership and the structure of long term incentives.
10-Year Durability Test:
For long term investors, the key question is whether the competitive landscape remains reasonably predictable over the next decade.
Several structural forces support MercadoLibre’s durability.
Ecommerce penetration across Latin America remains well below levels seen in developed markets. As internet connectivity and smartphone adoption continue rising, online commerce has substantial room to grow.
Digital payments are also gaining traction. Cash heavy economies are gradually shifting toward digital wallets and online payment networks.
These trends create a long runway for both the marketplace and fintech segments.
Still, several risks could disrupt the business.
Global competitors may increase investment in the region. Amazon already operates in Brazil and Mexico and has the financial capacity to subsidize logistics or merchant incentives.
Regulation is another uncertainty. Governments could impose restrictions on digital wallets, payment processing, or consumer lending practices.
Currency volatility also matters. Even if revenues grow rapidly in local currencies, exchange rate swings can reduce returns for investors measuring results in US dollars.
Despite these uncertainties, the industry’s structure is relatively understandable. Network driven commerce platforms tend to consolidate rather than fragment.
MercadoLibre’s combination of marketplace liquidity, logistics density, and payments infrastructure would be extremely expensive for new entrants to replicate at scale.
Multi-Year Thesis (3 to 7 years):
Base Case Scenario
Probability: 50 percent
Assumptions:
Revenue growth gradually slows from roughly 30 percent toward the high teens as the platform matures. Logistics investments create moderate operating leverage. Mercado Pago continues expanding into offline commerce but at a measured pace.
Normalized earnings multiple: approximately 25 times earnings.
Estimated intrinsic value: about $2,100 per share.
Bull Case Scenario
Probability: 30 percent
Assumptions:
Digital payments adoption accelerates across Latin America. Mercado Pago becomes a dominant payment network both on and off the marketplace. Logistics infrastructure reaches high density and significantly improves margins.
Revenue growth remains above 20 percent for several years.
Normalized earnings multiple: approximately 30 times earnings.
Estimated intrinsic value: roughly $3,000 per share.
Bear Case Scenario
Probability: 20 percent
Assumptions:
Revenue growth slows to the mid teens. Credit losses rise during economic downturns. Logistics investments generate lower returns than expected.
Normalized earnings multiple: approximately 18 times earnings.
Estimated intrinsic value: roughly $1,200 per share.
Probability weighted intrinsic value across these scenarios is approximately $2,130 per share.
Margin of Safety Verdict:
With the stock trading around $1,870, the probability weighted intrinsic value suggests only a modest discount. That gap falls short of the traditional value investing requirement of at least a 20 percent margin of safety.
As a result, the investment case relies more on continued execution and growth than on buying the business well below intrinsic value.
Peak Margin Stress Test:
Current gross margins around 50 percent are strong relative to traditional retail but not unusual for a platform that includes payments and services.
However, if fintech margins compress or logistics costs rise, consolidated operating margins could decline meaningfully.
If operating margins dropped toward the mid single digits while revenue growth slowed to the mid teens, valuation multiples could compress at the same time. In that environment the equity could plausibly see downside of 30 percent to 50 percent even if revenues continue to grow.
Valuation Framing:
At current valuation levels the market appears to assume several favorable outcomes.
Sustained revenue growth near or above 20 percent.
Continued leadership in major markets such as Brazil and Mexico.
Successful expansion of Mercado Pago beyond the core marketplace ecosystem.
Operating leverage emerging from logistics infrastructure as transaction volumes scale.
What seems less reflected in the valuation is the possibility that incremental returns on capital decline or that credit losses rise during periods of regional economic stress.
Perception vs Reality:
Perception: MercadoLibre is a pure technology platform similar to other high margin software driven marketplaces.
Reality: The company increasingly operates as a hybrid ecosystem combining ecommerce, logistics infrastructure, payments processing, and lending.
Each of these businesses carries its own economics and capital requirements.
Why This May Be Misunderstood:
Many investors focus primarily on revenue growth and the company’s dominant platform position.
But over long periods, shareholder returns tend to follow returns on invested capital more closely than revenue expansion alone.
If logistics and credit operations deliver lower incremental returns than the legacy marketplace, the company’s overall economics could gradually shift toward a lower return profile.
Three Measurable Things to Watch Next Quarter:
Growth in total payment volume processed through Mercado Pago, particularly outside the core marketplace.
Credit performance metrics including delinquency rates and loan loss provisions within the credit portfolio.
Operating margin trends as logistics infrastructure scales relative to revenue growth.
Historical Conviction Drift:
Market sentiment toward MercadoLibre remains broadly positive. Analyst coverage is overwhelmingly bullish, and retail investor discussions frequently describe the company as a dominant platform with a long growth runway.
At the same time, the narrative has begun to evolve. Investors increasingly recognize that the company is no longer just an asset light marketplace. Logistics and fintech are becoming larger parts of the model, bringing greater capital intensity with them.
Disconfirming Evidence:
The strongest argument against owning the stock is that the business could be shifting from a high return platform into a more capital intensive hybrid ecosystem.
Logistics networks require sustained investment, and credit portfolios introduce cyclical risk. If those segments ultimately earn lower returns on capital than the original marketplace business, valuation multiples could decline even while revenue continues to grow.
In that scenario, investors who purchased shares at premium growth multiples may face disappointing long term returns.
Risks:
Macroeconomic instability across Latin America affecting consumer spending and credit quality.
Currency volatility reducing US dollar denominated returns.
Rising loan losses within the credit portfolio during economic downturns.
Regulatory changes affecting digital payments or fintech lending.
Competitive pressure from global ecommerce platforms capable of subsidizing logistics and pricing.
Summary:
MercadoLibre remains one of the most impressive platform businesses in emerging markets. Its integrated ecosystem spanning marketplace commerce, payments infrastructure, logistics, and credit services creates powerful network effects that would be difficult to replicate.
The central question, however, is no longer whether the company can grow. The more important issue is whether incremental capital continues to earn high returns as the business expands into more capital intensive areas.
At roughly $1,870 per share the stock does not appear dramatically overpriced. But it also does not offer the clear margin of safety traditional value investors typically look for.
The most balanced conclusion is that MercadoLibre is an exceptional business trading at a price that already reflects a substantial portion of its future potential.
Data Snapshot:
Company: MercadoLibre
Metric: Value
Current Price (MELI): $1,870.01
Market Capitalization: $94.80 billion
Shares Outstanding: 50,697,182
Trailing P/E: 47.39x
Forward P/E: 27.58x
Enterprise Value (EV): $99.91 billion
EV/EBITDA: 24.86x
Revenue (TTM): $28.89 billion
Gross Margin: 50.68%
Operating Margin: 10.15%
Free Cash Flow (FCF): $-2.46 billion
FCF Yield: -2.59%
52-Week Range: $1,593.21 to $2,645.22
Sector: Consumer Cyclical
Industry: Internet Retail
References:
This analysis reviewed approximately 54 article sources and 14 video transcripts.
1. ChartMill. MercadoLibre Fundamental Analysis. www.chartmill.com
2. Reddit r ValueInvesting. Mercadolibre MELI is my 1 conviction right now. www.reddit.com
3. GuruFocus. MercadoLibre Intrinsic Value Projected FCF. www.gurufocus.com
4. Reddit r ValueInvesting. MELI thoughts. www.reddit.com
5. AlphaSpread. MercadoLibre Summary. www.alphaspread.com
6. Simply Wall St. MercadoLibre Valuation. simplywall.st
7. The Investor’s Podcast. Intrinsic Value Analysis MercadoLibre. www.theinvestorspodcast.com
8. Finbox. MELI P E LTM Explorer. finbox.com
9. Yahoo Finance. Does MercadoLibre Offer Value. finance.yahoo.com
10. YouTube. www.youtube.com
11. The Investor’s Podcast. Intrinsic Value Investing Tools. www.theinvestorspodcast.com
12. Yahoo Finance. MercadoLibre Become More Attractive. finance.yahoo.com
13. Moomoo. Intrinsic Calculation for MercadoLibre. www.moomoo.com
14. ValueSense. Ben Graham Value for MELI. valuesense.io
15. Validea. Factor Report MELI. www.validea.com
16. Simply Wall St. MercadoLibre Company Overview. simplywall.st
17. Morningstar. MercadoLibre Quote. www.morningstar.com
18. Seeking Alpha. MercadoLibre World Class Execution and Undervalued. seekingalpha.com
19. Yahoo Finance. Calculating Fair Value for MercadoLibre. finance.yahoo.com
20. FinanceCharts. MELI DCF Calculator. www.financecharts.com
21. KoalaGains. MercadoLibre Business and Moat. koalagains.com
22. Yahoo Finance. MercadoLibre Reports Q4. finance.yahoo.com
23. YouTube. www.youtube.com
24. Motley Fool Discussion. MELI Maintaining Strong Growth But Margins Under Pressure. discussion.fool.com
25. KoalaGains. MercadoLibre Company Analysis. koalagains.com
26. Potential Multibaggers. MercadoLibre The Moat Deepens. www.potentialmultibaggers.com
27. Macrotrends. MercadoLibre Revenue History. www.macrotrends.net
28. ChartMill. MELI Earnings Overview. www.chartmill.com
29. AlphaSpread. MELI Economic Moat. www.alphaspread.com
30. Seeking Alpha. Valued Like Ecommerce Earning Like Fintech. seekingalpha.com
31. Northwise Project. MELI Forecast. northwiseproject.com
32. FinancialContent. The Continental Moat Unpacking MercadoLibre Spending. markets.financialcontent.com
33. Digital Commerce Capsule. MercadoLibre Flywheel Infrastructure. digitalcommercecapsule.medium.com
34. Heavy Moat Investments. The Company That Divides Long Term Investors. heavymoatinvestments.substack.com
35. Yahoo Finance. Bull Case MercadoLibre. finance.yahoo.com
36. Reddit r ValueInvesting. Why I Think MELI Is a Great Business. www.reddit.com
37. FinanceCharts. Revenue CAGR Data. www.financecharts.com
38. MarketBeat. MELI Forecast. www.marketbeat.com
39. Benzinga. MELI Analyst Ratings. www.benzinga.com
40. Wall Street Journal. MELI Research Ratings. www.wsj.com
41. Financhill. MELI Stock Overview. financhill.com
42. AnaChart. MELI Ticker Overview. anachart.com
43. Perplexity Finance. MELI Overview. www.perplexity.ai
44. TipRanks. MELI Forecast. www.tipranks.com
45. MarketBeat. MELI Stock Overview. www.marketbeat.com
46. Barrons. MELI Research Ratings. www.barrons.com
47. MarketScreener. MercadoLibre Analyst Consensus. www.marketscreener.com
48. Tickeron. MELI Stock Data. tickeron.com
49. Seeking Alpha. MELI Symbol Page. seekingalpha.com
50. Investing.com. MercadoLibre Consensus Estimates. www.investing.com
51. Yahoo Finance. MELI Quote Page. finance.yahoo.com
52. CNN Business. MELI Stock Overview. www.cnn.com
53. TipRanks. MELI Stock Analysis. www.tipranks.com
54. Tavily Search API. api.tavily.com
55. YouTube. StasTalksStocks. www.youtube.com
56. YouTube. ThinkingCrypto. www.youtube.com
57. YouTube. FamilyHobbiesandCards. www.youtube.com
58. YouTube. OscarRamos. www.youtube.com
59. YouTube. Fxempirenetwork. www.youtube.com
60. YouTube. WolvesAndFinance. www.youtube.com
61. YouTube. CommonSenseCryptoYT. www.youtube.com
62. YouTube. MylesGInvestments. www.youtube.com
63. YouTube. Perry8k. www.youtube.com
64. YouTube. ripplemoonwatch. www.youtube.com
65. YouTube. ripplemoonwatch. www.youtube.com
66. YouTube. ZipTrader ZETA. www.youtube.com
67. YouTube. NCash. www.youtube.com
68. YouTube. TraderNick. www.youtube.com
Disclaimer:
This material is provided for informational purposes only and does not constitute investment advice. Investors should conduct their own research and consult qualified financial professionals before making investment decisions.
MELI – Watching a potential shift in structureAfter a prolonged downtrend from the highs, price is now stabilizing around the $1,700–$1,800 zone, which previously acted as a key demand area.
Key observations:
• Lower highs are still intact → trend not fully reversed
• Strong reaction from the recent lows → buyers stepping in
• Volume spike suggests potential accumulation rather than continuation selling
What I’m watching next:
• Break above $1,900–$2,000 → possible trend shift
• Failure to hold $1,700 → continuation to downside
Right now, this looks more like a range / early accumulation phase, not a confirmed reversal yet.
Patience here is key — let the market prove direction.
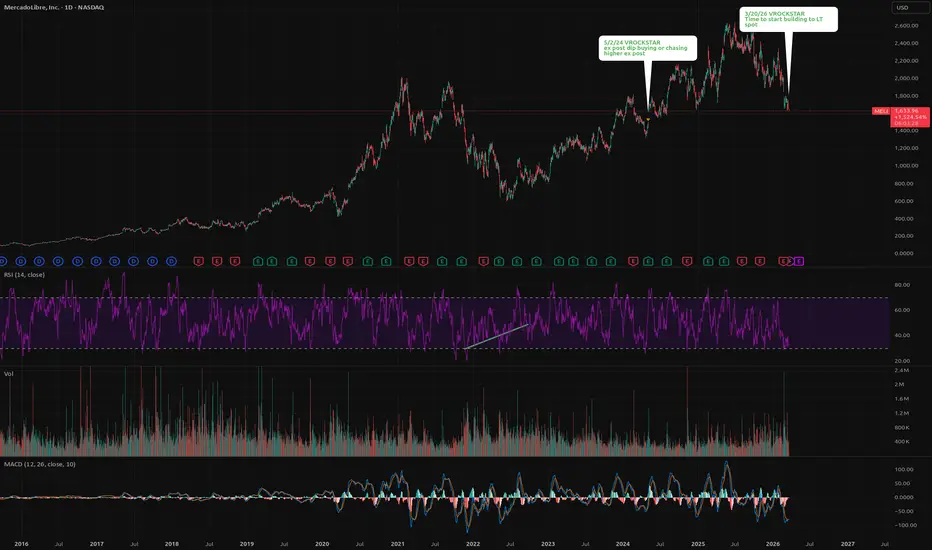
3/20/26 - $meli - Time to start building to LT spot3/20/26 :: VROCKSTAR :: NASDAQ:MELI
Time to start building to LT spot
- fastest consistent grower perhaps in the public markets
- N of 1 company and founder
- investing to continue that growth (markets want cake and eat it too... i'll take cake and then i'll eat it too, later)
- HSD fcf yields (even w/ this investment)
- this is one of those "buy at reasonable price and let it compound over the years" type stocks, similar to NYSE:NU and NASDAQ:DLO (that's the three-horse-men of latam winners)
V
MercadoLibre (MELI)MELI is a rare example of a company that manages to maintain over 30% growth while becoming increasingly profitable.
Fintech engine: Mercado Pago is no longer just a wallet for purchases, but a full-fledged digital bank. This brings higher margins on the trade itself.
Logistical advantage: They have the fastest delivery network in Latin America, which protects them from the penetration of Amazon.
Mathematical: Despite the high P/E, when we look at the ROIC (28.4%) and ROE (44.8%), we see a company that is extremely efficient. It "prints" money faster than the market can value it.
Squeeze Fired Into Breakdown at 34% Range With OBV DrainingMELI trades at 1,994.03 with a 56.9% bearish structural score across 112 signals, classified as tight. The supply-demand split reads 43.7% to 56.3% favoring sellers at 1.29x intensity with 52% clarity. Price has retraced -1.3% with a 0.3% bounce at 0.2x strength, classified as breakdown. A squeeze has fired. The structure is marginally bearish with a breakdown bounce and a squeeze releasing into quiet volume. The market has made its directional statement but the energy behind it is thin.
Price and Bias
Price sits at 34.4% of its measured range between 2,104.43 and 1,936.01, classified as lower. The -1.3% retrace is shallow but the 0.3% bounce at 0.2x strength is structurally insignificant. The breakdown classification means even this minor pullback has been met with zero buying response. The none tag on the structural panel reflects the absence of any meaningful bounce or breakout signal.
EMA alignment reads 1:11, a near-complete bearish sweep. Ichimoku prints 4:10 against bulls. These two trend-following components are decisively bearish. Candle patterns read 11:3 bullish, creating a sharp divergence against the EMA and Ichimoku framework. The counter-trend score at 6:8 favors bears from the reversal signal side. The spread metric reads just 13.8%, tagged as tight, confirming the overall structure lacks strong conviction despite the directional signals.
DD/SS at 2:6 favors bears. Star at 2:0 leans bullish. Harami at 1:1 is neutral. Pattern total at 3:1 favors bulls. Engulfing at 0:0 is absent. The pattern-level signals are mixed, with star, pattern total, and the candle count leaning bullish while DD/SS, EMA, and Ichimoku lean bearish. The tight classification at 13.8% spread reflects this internal conflict.
The 11:3 candle count diverging against the 1:11 EMA sweep is the central tension. Short-term price patterns are producing bullish formations even as the broader trend structure has turned bearish. This configuration often appears when a market is attempting to base after a decline but has not yet convinced the trend-following indicators.
Squeeze and Momentum
The squeeze has fired. Momentum reads bearish and declining with Bollinger bandwidth at 1.45%. The squeeze releasing into bearish declining momentum at the lower portion of the range confirms the directional bias of the release is downward. Squeeze momentum contraction reads 568.8% and rising, an extraordinarily elevated reading indicating the compression that built the squeeze was extended. Bandwidth at 1.45% means the range was extremely compressed before the release, and the expansion should be proportional.
No volume squeeze is active. The fired squeeze is price-based, meaning the compression and release are occurring in the price structure without volume participation confirming the move.
Volume and Participation
Volume Z-score reads -0.65, classified as quiet. Dollar volume sits at 39.88K against just 20 in raw terms. The 1-to-5 timeframe volume Z range of -0.65 to -0.69 shows uniformly quiet participation across all timeframes with no improvement anywhere. Volume momentum is rising at 0.03, barely positive and essentially flat. The bull-bear volume Z split reads -0.41 versus -0.43, perfectly balanced with both sides equally suppressed.
No whale activity is detected. Directional flow reads neutral. No volume squeeze is active. The volume landscape offers zero directional information. Both sides are equally quiet at the same level of suppression.
OBV Z-score reads -0.02, classified as outflow. The Z-score is essentially flat at zero but the outflow classification means the directional trajectory is negative. Cumulative flow is draining marginally. The near-zero reading means previous accumulation and distribution have roughly offset, but the current trend is toward further outflow. OBV divergence reads normal.
No futures data is available, so leverage and premium analysis cannot be applied.
Scenarios
The bearish continuation case is defined by the squeeze fire aligning with the dominant trend signals. A 1:11 EMA sweep, 4:10 Ichimoku, 6:8 counter-trend, 2:6 DD/SS, breakdown bounce at 0.2x, bearish declining momentum, and OBV outflow collectively support the downside. If the squeeze expansion generates volume with the bull-bear split tilting toward sellers and OBV deepening its outflow, the move targets the 1,936 range low from the current 34.4% position. The 568.8% squeeze contraction reading means the expansion should be significant once participation arrives. A sustained move below 1,975 with rising bearish volume confirms the release has conviction.
The basing reversal case relies on the candle pattern divergence. An 11:3 candle count, 2:0 star, and 3:1 pattern total at the lower portion of the range suggest the price action is forming a base even as the trend indicators remain bearish. If volume Z recovers above -0.3 with the bull-bear split tilting toward buyers and OBV flipping from outflow to inflow, the squeeze fire could exhaust quickly as the candle-level bullish signals prove more forward-looking than the lagging EMA and Ichimoku reads. A move above 2,020 on rising volume with the 11:3 candle count holding would be the first confirmation that the basing pattern is converting to recovery.
The tight classification at 13.8% spread means neither scenario carries high structural conviction. The squeeze fire provides the catalyst but the market's response in volume will determine the outcome.
Watch Levels
Below 1,975 with volume Z turning above -0.3 on the sell side and OBV deepening outflow confirms the squeeze release is genuine and targets the 1,936 range floor. Above 2,020 on buying volume with the candle divergence holding and OBV flipping to inflow negates the bearish squeeze release and validates the basing pattern. The 568.8% contraction reading guarantees the move from here will be outsized relative to the recent 1.45% bandwidth compression. Direction depends entirely on which side volume favors when it returns.
Risk Note
A fired squeeze into a breakdown bounce with quiet volume at 34.4% of the range and a tight structural spread is a move that needs participation to sustain. The squeeze provides the ignition but the uniform quiet across all volume metrics means the fuel is not yet present. The 11:3 candle divergence against the 1:11 EMA sweep creates genuine uncertainty about whether the release continues downward or gets absorbed by the basing pattern underneath. The first volume signal after the fire determines the trade. Without it, the squeeze may expand briefly and stall, leaving both the bulls and bears waiting for the same thing: someone to show up.
More analysis on my profile.
Tags: MELI, MercadoLibre, stocks, squeeze, volume, OBV, breakdown, structure, candle, momentum
MercadoLibre – Daily StructureMercadoLibre – Daily Structure
Price is interacting with a major confluence zone: rising support (red) and long-term descending resistance (green). The yellow horizontal level (~1945) is the critical pivot.
Technical View
• Holding above the yellow level → structure remains constructive
• A controlled retest of the yellow zone is technically valid
• Stability after retest → increases probability of upward rotation
As long as price maintains acceptance above this support, the chart favors continuation toward the descending trendline resistance.
Invalidation
• Sustained daily closes below the yellow level → weakens bullish scenario
Bias stays cautiously bullish while support holds.
— Avo.Trades
Long-term trend is still bullish and the main channel remains inLong-term trend is still bullish and the main channel remains intact.
• The recent drop looks like a healthy correction, not a structural breakdown.
• Key resistance at 2,220–2,230: this level decides the next move.
• A daily close above 2,220 would signal renewed momentum and open upside.
• Below that level, price action stays weak and corrective, with capital working inefficiently.
• If it fails to reclaim resistance soon, reducing exposure is a rational risk-management choice.
Encouraging note: the structure is still solid — it just needs confirmation before pushing high
Pullback exactly on the diagonal support. MercadoLibre bounced…Pullback exactly on the diagonal support.
MercadoLibre bounced strongly from the 1950–2000 area up to 2210, and this move was correctly identified in advance.
The reaction confirms the importance of the diagonal as a key technical level.
MELIMercadoLibre is a complex ecosystem integrating a marketplace, logistics, fintech (Mercado Pago), and digital advertising.
Company Strengths
MELI's main competitive advantage lies not in its individual services, but in their deep integration, creating a "closed loop" for users.
Logistics (Mercado Envíos): Its own network of fulfillment centers, whose capacity has grown by 41% year-on-year, ensures the fastest delivery in the region.
Fintech (Mercado Pago): It is a full-fledged digital bank with 72 million monthly active users. Mercado Pago's credit card has become the most widely used on its own platform in Brazil, with over 50% of its turnover coming from external transactions, demonstrating its intrinsic value.
Advertising (Mercado Ads): The fastest-growing segment, leveraging unique, first-party data for targeting.
Operational and Financial Performance
Revenue in Q3 2025: $7.4 billion (+39% YoY)
Total Payment Volume (TPV): $71.2 billion (+41% YoY)
Loan Portfolio: $11.0 billion (+83% YoY)
Assets Under Management: $15.1 billion (+89% YoY)
At the same time, the company maintains an investment-grade credit rating (BBB- from Fitch), providing access to affordable capital.
Weaknesses and Risks:
Credit Risks and Profit Pressure
The most significant risk comes from the fintech segment. Rapid loan portfolio growth (+83%) is outpacing revenue growth, and doubtful debt provisions for the first nine months of 2025 increased by 58%. This directly impacts net profit, which grew by 13% significantly below revenue growth (+37%).
Net interest margin after deductions (NIMAL) decreased by 320 basis points to 21%. Investors rightly fear that aggressive lending expansion could lead to a wave of defaults in the event of a macroeconomic downturn.
Margin compression due to strategic investments 🔎
Compelling Opportunity to Load MELIMercado Libre has five main business units: MarketPlace (its product-selling platform), Mercado Pago (online payments), Mercado Publicado (advertising), Mercado Shops (tools that enhance the platform ecosystem), and Mercado Crédito (its credit line).
1. Multi-Year Trend Line Support
2. Historical levels of price to sales ratio where under 4 is "margin of safety" support
3. share price is currently under the 50, 100, and 200 moving average.