MRVL: Bullish Sequence Target at Point CAfter completing an extended downward move into the lower bearish Point C target zone, NASDAQ:MRVL established a structural floor and transitioned into a new bullish order flow sequence. This initial upward momentum defined clean A and B structural points, laying the foundation for a higher-degree expansion.
Current price action is pulling back toward the designated bullish BC reload zone. Maintaining structural integrity within this demand region allows buyers to absorb localized sell-side liquidity and preserve the upward sequence geometry.
Looking ahead, the primary structural objective sits at the bullish Point C target. Notably, this completion target resides directly within a major macro Whole Correction Level (WCL), marking a high-confluence region for overall sequence balance.
In-depth trading ideas
MRVL Soared 350%+ in Months, Then Fell. What Its Chart Says HereSemiconductor-chip designer Marvell Technology NASDAQ:MRVL has been remarkably volatile this year, rising 350%+ in just four months to hit a June 18 all-time high, then pulling back some 35% since then. Let's see what its chart and fundamentals can tell us about what might happen next.
Marvell's Fundamental Analysis
The whole semiconductor group has been hot and cold over recent months, but it seems like MRVL has been among either the leaders or the losers within the Dow Jones U.S. Semiconductors Index DJ:DJUSSC on almost a daily basis.
After a nasty sell-off that lasted into late July, MRVL reacted well this week to the firm unveiling new products to support AI memory infrastructure.
The new offerings expanded Marvell's portfolio for AI storage, rack-scale memory expansion and optical shared memory.
For instance, the firm introduced a new Bravera SC6 PCIe 6.0 SSD controller that doubled the performance of Marvell's previous controller and improves AI-inference efficiency by accelerating KV cache workloads.
MRVL also announced new Photonic Fabric memory modules and chiplets aimed at enabling multi-rack optical-shared-memory architectures for next-generation AI infrastructure.
These new products came out at a time when Marvell is preparing to release fiscal Q2 results in late August.
Wall Street is expecting the firm to report $0.40 in GAAP earnings per share and $0.93 in adjusted EPS on roughly $2.7 billion of revenue. Results like that would be good for almost 35% in annual sales growth, as well as an 81.8% gain from the $0.40 in GAAP that Marvell posted for the same quarter last year.
Meanwhile, analysts' consensus estimate for adjusted EPS would represent a 38.8% y/y expansion from fiscal Q2 2026's $0.67.
All in, 25 of the 32 sell-side analysts that I know of who cover MRVL have revised their current-quarter earnings estimates higher since the period began, while just three have reduced their numbers. (Five have left their estimates unchanged.)
Marvell's Technical Analysis
Now let's go to Marvell's chart going back to April and running through Thursday morning (Aug. 6):
Readers will first notice that MRVL came out of a double-top pattern of bearish reversal in late June and early July, marked with red lines and pink shading in the chart's center. This pattern worked quite well.
After completing that set-up, the stock went on to develop a double-bottom pattern of bullish reversal. That's where we are now some three weeks ahead of earnings.
This pattern's upside pivot stands at $215 (the apex of "W" shape's center). Marvell might be in the process of taking and perhaps holding that level, with the stock trading above $215 for part of this week before closing Wednesday at $211.02.
Should Marvell hold the pivot, shares would face their next test at the stock's 50-day Simple Moving Average (or "SMA," marked with a blue line at $240).
Moving on to the other technical indicators shown above, Marvell's Relative Strength Index (the gray line marked "RSI" at the chart's top) has been improving and has reached above the neutral line.
Marvell's daily Moving Average Convergence Divergence indicator (or "MACD," denoted by blue bars, a black line and a gold line at the chart's bottom), has started to look better as well.
The histogram of the 9-day Exponential Moving Average (or "EMA," marked with blue bars) recently reached above the zero-bound for the first time in more than six weeks. That's bullish.
In addition, the 12-day EMA (the black line) has now overtaken the 26-day EMA (the gold line) -- a bullish signal as well.
However, this signal can be somewhat muted when both lines remain below zero, as they do above. The pattern's bullishness would become considerably stronger if the black line holds above the gold line and both of them move together into positive territory.
(Moomoo Technologies Inc. Markets Commentator Stephen "Sarge" Guilfoyle had no position in MRVL at the time of writing this column.)
This article discusses technical analysis, other approaches, including fundamental analysis, may offer very different views. The examples provided are for illustrative purposes only and are not intended to be reflective of the results you can expect to achieve. Specific security charts used are for illustrative purposes only and are not a recommendation, offer to sell, or a solicitation of an offer to buy any security. Past investment performance does not indicate or guarantee future success. Returns will vary, and all investments carry risks, including loss of principal. This content is also not a research report and is not intended to serve as the basis for any investment decision. The information contained in this article does not purport to be a complete description of the securities, markets, or developments referred to in this material. Moomoo and its affiliates make no representation or warranty as to the article's adequacy, completeness, accuracy or timeliness for any particular purpose of the above content. Furthermore, there is no guarantee that any statements, estimates, price targets, opinions or forecasts provided herein will prove to be correct.
Moomoo is a financial information and trading app offered by Moomoo Technologies Inc. In the U.S., investment products and services on Moomoo are offered by Moomoo Financial Inc., Member FINRA/SIPC.
TradingView is an independent third party not affiliated with Moomoo Financial Inc., Moomoo Technologies Inc., or its affiliates. Moomoo Financial Inc. and its affiliates do not endorse, represent or warrant the completeness and accuracy of the data and information available on the TradingView platform and are not responsible for any services provided by the third-party platform.
Marvell Tech back to previous highThe brutal semicon correction seems to be over or in its last 2-3 days. The overall wave strucutre of majority stocks seem to have already made their highs for few months with Marvell being one such stock.
Basis the wave structure and divergence, I expect Marvel to reach its previous highs at 310-335 levels and then correct by 50% or slighltly more to 150-160 odd levels.
For now, stay long in Marvell and other semicon names and watch for top signals in mid Sep-Oct timeframe.
MRVL – Elliott Wave Analysis: Primary ABC Correction Marvell Technology is currently at a particularly interesting point from an Elliott Wave perspective. The strong advance into the June high around $332 completed a clean five-wave impulsive structure and can therefore be interpreted as a higher-degree Wave (1) .
The key question now is whether the subsequent correction has already completed — or whether one final corrective leg is still missing.
This creates two valid Elliott Wave scenarios.
Primary Count – Wave (2) Still in Progress
In the primary scenario, the decline from approximately $332 represents an ongoing ABC correction .
The first sell-off into the $155–160 region can be counted as Wave (a) . The current recovery would therefore represent Wave (b) .
An important short-term level is located around:
$242.87
A move into or slightly above this region would fit well with a developing B-wave recovery. However, as long as MRVL remains below the previous major high, another corrective decline cannot be excluded.
The projected Wave (c) would lead price back into the deeper Fibonacci retracement zone of Wave (1).
The most interesting levels are:
50.0% retracement: $203.67
61.8% retracement: $173.42
78.6% retracement: $129.35
The deeper $129–140 region is especially important because the projected Wave (c), the 78.6% Fibonacci retracement and the rising long-term VWAP are converging in approximately the same area.
That would create a very strong technical zone for a potential final Wave (2) low.
The Orange Alternative Count
The alternative count shown in orange is considerably more bullish.
In this interpretation, Wave (2) has already completed with the recent sell-off into the $155–160 region.
If this count is correct, the current advance is not merely a corrective B-wave. Instead, MRVL has already started the next impulsive sequence.
The orange structure therefore assumes that the market is currently building the early stages of a new five-wave advance.
The first relevant hurdle remains:
$242.87
A sustained breakout above this level would add momentum to the alternative scenario.
The decisive level, however, is the previous Wave (1) high at:
$332.52
A breakout above $332 would strongly favor the orange count and indicate that the larger Wave (3) is underway.
Bullish Projection
Once $332 is cleared, the upside structure becomes particularly interesting.
The Fibonacci extension targets shown on the chart are located around:
138.0% extension: $430.71
161.8% extension: $492.05
The orange count therefore allows for a Wave (3) expansion toward approximately $430–440 .
This could subsequently be followed by a Wave (4) correction toward roughly the $370–380 region before a final Wave (5) pushes toward approximately $470–492 .
Invalidation
Despite the difference between both scenarios, the larger bullish Elliott Wave structure remains valid as long as MRVL stays above the origin of Wave (1).
The critical invalidation level is located around:
$92.54
A sustained break below this level would invalidate the presented higher-degree bullish impulse and require a complete reassessment of the structure.
Conclusion
MRVL currently offers two technically valid interpretations.
The primary count expects the current rebound to develop as Wave (b), followed by another Wave (c) decline — potentially into the powerful $129–140 Fibonacci/VWAP confluence.
The orange alternative count , however, suggests that the correction is already complete and MRVL has begun the next major impulsive advance.
This makes the next two resistance levels especially important:
$242.87 = first bullish confirmation
$332.52 = major structural confirmation
Above $332, the probability would shift significantly toward the orange bullish scenario, opening the door toward the $430–492 extension zone .
Until then, both counts remain on the table.
Marvell Tries to Break Out Before EarningsMarvell Technology reports earnings in two weeks, but the stock could be breaking out now.
The first pattern on today’s chart is the falling trendline that began on August 4. MRVL opened above that resistance on August 10 and 12, only to close below. However, it could now be pushing through that line.
Second, the 8-day exponential moving average (EMA) is crossing above the 21-day EMA. MACD and Wilder’s Relative Strength Index (RSI) are also rising. Those signals may reflect increased short-term bullishness.
Third, the 50-day simple moving average (SMA) is above the 100-day SMA. Both are above the 200-day SMA. That arrangement, with faster SMAs above slower SMAs, could reflect long-term bullishness.
Next, the chip stock has been consolidating above the July 31 weekly high of $201.35. That may confirm short-term support is in place.
Finally, the late-July low of $162.90 was near the May 19 weekly low. Could rebounding quickly from such a level confirm long-term support is in place?
TradeStation has, for decades, advanced the trading industry, providing access to stocks, options and futures. If you're born to trade, we could be for you. Learn more here about TradingView’s Broker of the Year!
Past performance, whether actual or indicated by historical tests of strategies, is no guarantee of future performance or success. There is a possibility that you may sustain a loss equal to or greater than your entire investment regardless of which asset class you trade (equities, options or futures); therefore, you should not invest or risk money that you cannot afford to lose. Online trading is not suitable for all investors. View the document titled Characteristics and Risks of Standardized Options at www.TradeStation.com . Before trading any asset class, customers must read the relevant risk disclosure statements on www.TradeStation.com . System access and trade placement and execution may be delayed or fail due to market volatility and volume, quote delays, system and software errors, Internet traffic, outages and other factors.
Securities and futures trading is offered to self-directed customers by TradeStation Securities, Inc., a broker-dealer registered with the Securities and Exchange Commission and a futures commission merchant licensed with the Commodity Futures Trading Commission). TradeStation Securities is a member of the Financial Industry Regulatory Authority, the National Futures Association, and a number of exchanges.
TradeStation Securities, Inc. and TradeStation Technologies, Inc. are each wholly owned subsidiaries of TradeStation Group, Inc., both operating, and providing products and services, under the TradeStation brand and trademark. When applying for, or purchasing, accounts, subscriptions, products and services, it is important that you know which company you will be dealing with. Visit www.TradeStation.com for further important information explaining what this means.
MRVL | SemiConductor Summer? | Q3 2026 - Day ChartMarvell Technology, Inc. ||
MARKET-BEATING SCORE = 6/10
Dividend yield (indicated)
0.11%
"engages in the design, development, and sale of integrated circuits. Its products include data processing units, security solutions, automotive, coherent DSP, DCI optical modules, ethernet controllers, ethernet PHYs, ethernet switches, linear driver, PAM DSP, transimpedance amplifiers, fibre channel, HDD, SSD controller, storage accelerators, ASIC, and Marvell government solutions. "
-----------------------------------
PEGY 2.00 — overvalued vs growth.
EPS growth 48.1% — above-market.
Revenue growing 42.1% YoY — strong.
Gross margin 51.5% — strong moat.
FCF margin 29.0% — real cash generation.
D/E 0.27 — conservative leverage.
PROFITABLE / OVERVALUED
-----------------------------------
KEY RISK ASSESSMENT
"Could a policy change or major competitor disrupt growth in the next 2 years?"
Marvell faces potential disruption from escalating U.S.-China trade tensions and export restrictions, which threaten its significant revenue base in the region
Growth is further challenged by intense competition from Broadcom and the trend of hyperscale customers developing in-house custom silicon, potentially reducing demand for Marvell’s offerings
Additionally, its fabless model leaves it vulnerable to supply chain vulnerabilities and geopolitical instability affecting global shipping and third-party manufacturing
Risk Level:
Moderate
----------------------------------
POSITIVE CATALYST OUTLOOK
"Could a policy change or competitor headwinds create a positive catalyst in the next 2 years?"
Marvell is positioned as a primary beneficiary of the shift toward custom AI silicon and high-speed optical interconnects, with data center revenue projected to grow approximately 55% year-over-year through fiscal 2028
The company is emerging as the most credible rival to Broadcom, targeting a market share increase from 5% to 20% by 2028 as hyperscalers seek diversified custom chip providers (www.trefis))
Strategic partnerships with major cloud providers like Amazon and Google, combined with the recent acquisition of Celestial AI to address memory constraints, provide significant technological tailwinds for the next two years
Positive Outlook:
Moderate
-----------------------------------
Multiple Time-Frame Analysis; Color Code | Strength favors the higher timeframe.
Yearly timeframe = black
Monthly timeframe = pink
weekly = grey
daily = red
4hr = orange
1hr = yellow
15min = blue
5min = green if they are shown. (Level visibility on intervals is set to timeframe the level was found on and below to keep chart view organized.)
** Candle Science explained **
A Range = two or more consecutive color candles.
There are two types of ranges - accumulation and distribution. **A single candle is a range on a lower timeframe. *Find the range and define its, creation dates, prices, and risk parameters. A range is broken down into 4 candle, which create 6 levels that define the range and illustrate market structure.
Focus only on the first and last candle of each range. The last candle of each type of range has two levels - see FS & Inv. FS Candles below.
DISTRIBUTION RANGES DEFINED:
When price is above a distribution range, these candles/levels act as support.
(BS) BACKSIDE Candle - First distribution candle in a distribution range. Expectation = strong reaction to price. long wicks reaching to or away from level. high angle accumulation trends, f.v,g's
(FS) FrontSide Candle - Last distribution candle in a distribution range. Expectation = reversal, create a low angle accumulation trend. The top of Distribution candles are used as support. The bottom of the FrontSide candle is the SwingLow of the range. The FS candle wants to protect the SwingLow. When/if Price Action closes below the SwingLow, the level is invalidated. Find another range to trade.
ACCUMULATION RANGES DEFINED: When price is below an accumulation range, these candles/levels act as resistance.
INVERSE BACKSIDE (Inv.BS) - First Accumulation candle in an accumulation range. Expectation. = strong reaction to price. long wicks reaching to or away from level. Creates high angle distribution trends, f.v.g, protects the Inv.FS candle
INVERSE FRONTSIDE (Inv.FS) - Last accumulation candle in an accumulation range. Expectation = reversal, create a low angle distribution trend. The bottom of Accumulation candles are used as resistance.
The top of the Inv.FrontSide candle is the SwingHigh of the range. The Inv.FS candle wants to protect the SwingHigh. When/if Price Action closes above the SwingHigh, the level is invalidated. Find another range to trade.
Marvell Technology Daily: Bullish Reversal SetupMarvell is attempting a strong recovery after defending the 160–175 support area. A sustained move above 184–185 could confirm further upside toward 200, followed by 220 and the main target near 251.
A confirmed break below 161 would invalidate the bullish setup and signal renewed downside pressure.
Our view: cautiously bullish above 161, with confirmation above 185 required before targeting 251.
MRVLTechnical Overview
Current Price: Around $67.35
Major Uptrend Line: A long-term rising trendline from 2019 remains intact, supporting the broader bullish structure.
Key Support & Buy Zones
Primary Buy Zone: $63.34 – $61.44
This zone aligns with historical price congestion and the major uptrend support.
Secondary Buy Zone: $50.86 – $50.73
Deeper support from previous accumulation areas.
Stop Loss: A daily close below $46 would invalidate the bullish setup and signal potential trend reversal.
Resistance & Target Levels
Target 1: $92
Strong historical resistance; a break above this level could open the door for further upside.
Target 2: $127
The previous all-time high area and next major upside objective.
Trend & Momentum
Trend: Despite recent volatility, the long-term structure shows higher lows, indicating the primary trend is still up.
Momentum: The stock recently bounced from the buy zone near $63, suggesting buyers are active. Sustaining above $63 is key for the next bullish leg.
Trading Strategy Idea
Aggressive Entry: Accumulate near $63–61 with a stop below $46.
Conservative Entry: Wait for a clear break and daily close above $70 to confirm renewed momentum toward $92.
Summary:
Marvell Technology remains in a long-term uptrend with critical support at $63–61. Holding above this zone favors a move toward $92 and possibly $127, while a close below $46 would negate the bullish outlook.
MRVL BEFORE EARNINGS JUL 2026MRVL is testing the critical institutional demand zone between $220 and $250 after a sharp pullback. Holding this area keeps the bullish structure intact and increases the probability of a move toward $280. A recovery above $250 would confirm renewed buying momentum, while a daily close below $220 would expose the stock to a decline toward $200. The $220-$250 range remains the key liquidity zone where institutional buyers are expected to defend positions.
Key Levels:
Support: $220, $200, $130
Resistance: $250, $280, $330
Bullish Trigger:
Daily close above $250.
Bearish Trigger:
Daily close below $220.
Target:
$280
MARVELL TECH POWER PLAY
Coming from a huge Re-Accumulation Trading Range
Honestly i missed the crazy run @ 30th March 2026
-i was reluctant as i got few other stocks to consider
Back to Marvell, there was a velocity mark up >100% within 8weeks
Despite huge supply (Red arrow), price dropped <20% !
Position initiated as attached from the perspective of Selling Climax @ Bar 5th Jun
Marvell Technology Wave Analysis – 22 June 2026- Marvell Technology reversed from resistance level 320.00
- Likely to fall to support level 280.00
Marvell Technology recently reversed from the resistance zone between the resistance level 320.00 (which stopped the previous impulse wave 1) and the upper daily Bollinger Band.
The downward reversal from this resistance zone created the daily Japanese candlesticks reversal pattern Shooting Star.
Given the bearish divergence on the daily Stochastic indicator, Marvell Technology can be expected to fall to the next support level 280.00.
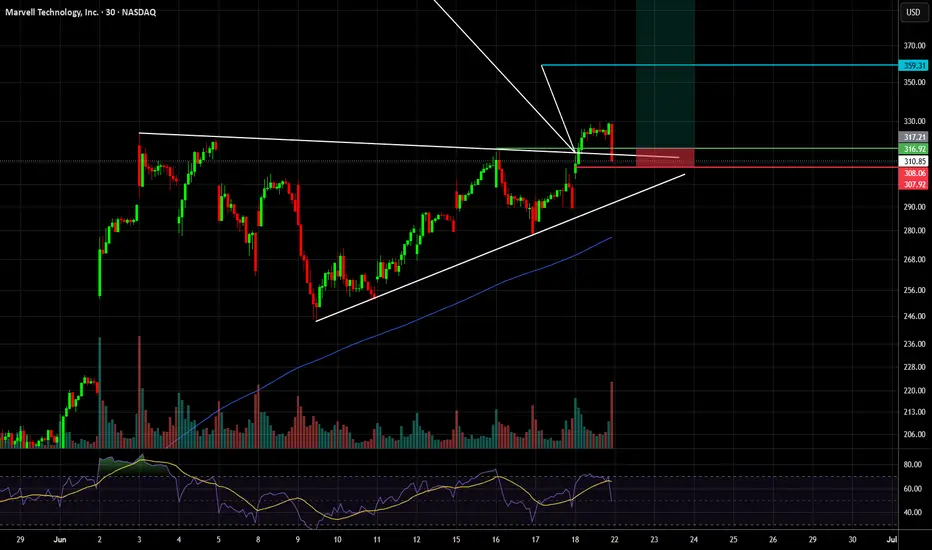
MRVL- Idea for a quick 13%-32% trade with great R/RMRVL has been one of the strongest performers in this market, rallying more than 220% over the last 3 months. Despite the massive move, I believe the stock still have gas in the tank to continue.
Over the past two weeks, price has been consolidating inside a symmetrical triangle, building a potential continuation setup.
On Thursday, MRVL attempted to break above the key breakout level at $316.92, heavy selling pressure during the final 15 minutes of the session pushed the price back below this important key point.
Using the classic symmetrical triangle measuring method (connecting the first high to the first low, and the second high to the second low), the potential targets are:
🎯 Target 1: $359.31 (+13.4%)
🎯 Target 2: $418.25 (+32%)
Trade Plan
The setup is attractive, but the breakout confirmation is the most important piece. The key level to watch is $316.92.
A convincing breakout and hold above this level would be my trigger to consider a long position either as a day trade or a swing trade depending on how the breakout develops.
Risk management:
🛑 Stop-loss: $307.92
Risk/Reward:
• Target 1: 4.64 R/R
• Target 2: 11 R/R
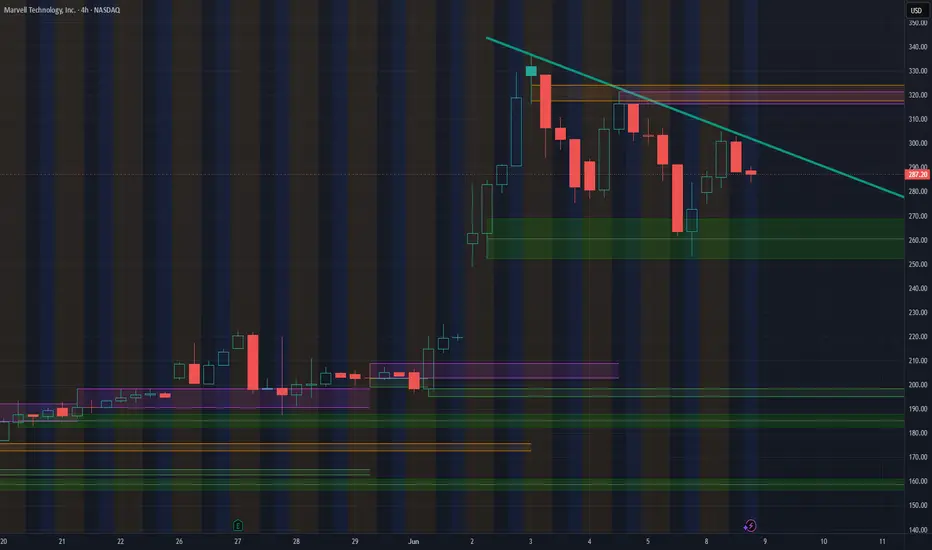
MRVL Long — $MRVL pulling back into prior breakout ledge ~$295 wHTF (4h) shows an unambiguous uptrend from ~$80 in Jan to a peak near $325 post-earnings on Jun 3–4, with higher highs and higher lows throughout. After the earnings-driven surge to $325, price pulled back hard to ~$245 (Jun 9 sell-the-news), then recovered and is now retesting the ~$295 area — a prior consolidation / breakout ledge from Jun 2–3 that also aligns with the Jun 8 recovery high cluster (~$293–$300). LTF (1h): today's session opened with a spike to $317, reversed sharply to $289 intraday low, and is now consolidating near $295. The last 1h bar (09:30) closed at $294.7 with a lower wick to $289, forming a pin/rejection off the $289 support zone — this is the LTF trigger. Stop placed below today's intraday low of $289.23 with ~0.25 ATR buffer: $284.50. Target is the Jun 4 closing area / recent supply cluster near $317, slightly in front of the $317–$321 congestion. R/R = (317−294.71)/(294.71−284.50) = 22.29/10.21 = 2.18 — clears the 2.0 gate. Regime is neutral (no adjustment). Scan hint agrees Pullback/LONG (+4). Research is strongly aligned: record Q1 beat, Q2 guidance raised to $2.7B, FY2027 ~$11B target, B. Riley PT $345, new CFO reaffirmed guidance — T1 confluent catalysts support the bull thesis (+10). Overvaluation note (T2 Seeking Alpha) is a soft cap but does not flip the chart read. Base 68; hint +4; research +10; regime 0 → 82, clamped to 82.
📍 Entry: 294.71
🛑 Stop: 284.50
🎯 Target: 317.00
⚖️ R:R: 2.18
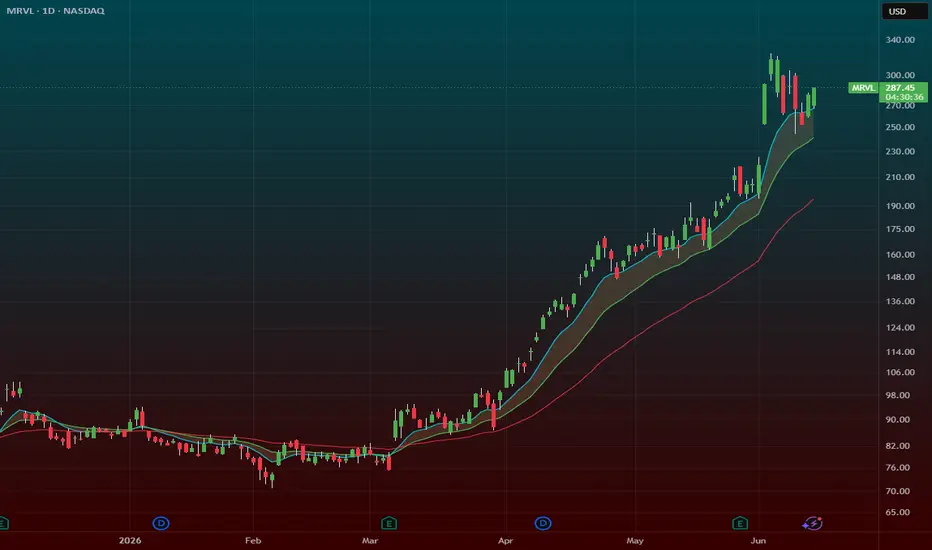
MRVL – Breakout Pullback SetupWe already did the big breakout move on MRVL. Now we're in the second chapter — the pullback and hold setup. This is actually a better entry than chasing the initial breakout.
Stock ripped nearly 100% in two weeks, pulled back, and found support right at the 9 EMA. That's exactly how a healthy momentum stock behaves. The pullback shook out weak hands. The base is resetting. I have a swing position on with a stop at $260.
─────────────────────────────────
WHAT CHANGED SINCE THE BREAKOUT
─────────────────────────────────
Three things happened after the initial move that make this hold even more meaningful.
Nvidia CEO Jensen Huang publicly called Marvell Technology "the next trillion-dollar company." The stock spiked more than 30% on that comment alone. When the most important person in the semiconductor industry points at a stock and says that publicly, you don't fade it on a pullback — you look for re-entries.
On June 8 Marvell was officially added to the S&P 500 effective June 22. That's a forced buying event. Every S&P 500 index fund on earth has to own this stock before the close on June 22. That's trillions of dollars in passive capital that must purchase MRVL on a specific date regardless of price. Hard catalyst. Hard date. Calendar it.
Marvell also just launched the Teralynx T100 — a 102.4 terabit per second switch chip built specifically for AI and cloud fabrics with 25% lower power consumption and industry-leading latency. That goes directly at the AI networking bottleneck every hyperscaler is trying to solve.
CFO transition was announced today — and the company simultaneously reaffirmed its Q2 guidance. Management putting out a reaffirmation the same day as a CFO change is a deliberate confidence signal. CoinDesk
─────────────────────────────────
THE SETUP
─────────────────────────────────
Classic momentum behavior — parabolic run from $165 to $316, violent snapback into the $260s, now stabilizing. The EMA clouds held. The 9 EMA held. The stock is starting to come out of the consolidation range with buyers stepping in at the lows. Yahoo Finance
This is the pullback-and-hold setup after a confirmed breakout. Better risk/reward than the initial entry because the stop is tighter and the fundamental story got bigger while the price came in.
─────────────────────────────────
TRADE PLAN
─────────────────────────────────
Entry: Swing position on — holding through the 9 EMA base
Stop: $260 — below the 9 EMA support
Hard catalyst date: S&P 500 inclusion effective June 22
Pattern: Breakout pullback and hold
─────────────────────────────────
THE RISK
─────────────────────────────────
MRVL is not cheap at these levels. Broad market pullback hits extended semis hard and fast. CFO transition is a wildcard even with guidance reaffirmed. Stop at $260 is non-negotiable — if that level breaks the pattern is broken.
MRVL obviously different traders with different perspectives can come up with various ways to use this info.
However for myself I've been using this mainly for placing scalps on the SHORT side of things. I have also played it long a few times as well as scalped a few options trades.
As for this evening i ran one short scalp since the close and am watching for a over night pop with the main idea being another short scalp.
Obviously if it breaks out and begins to run you'll want to adjust accordingly and or cut your losses and preserve your capitol.
Always remember there is always TWO sides to every trade.
One trader can see the reason to BUY while the other see's the reason to SELL.
ONLY YOU can make that decision and don't let anyone else make it for you.
Marvell (MRVL) in a bull flag consolidationNASDAQ:MRVL is showing a bull flag consolidation pattern after a strong prior run up. This is bullish if you take into account the decreasing volume.
June 4th saw a takeout due to last Friday's market slump. But the pattern has remained intact, meaning a possible bullish breakout is still on the table.
Note: Not financial advice - please do your own DD before making any trades/investments!
Jensen Huang names Marvell the next trillion-dollar companyMRVL | 4H Technical Analysis — Jun 3, 2026
Nvidia CEO Jensen Huang called out Marvell at Computex as a candidate for the next trillion-dollar company. Huang highlighted the critical role of networking infrastructure connecting data centers, and with Nvidia having already invested $2B in Marvell, the endorsement carries structural weight. Marvell manufactures the optical interconnect chips that convert electrical signals to light for high-speed data transmission across 100K+ GPU clusters. The stock surged 32.52% on the session.
MRVL spent the better part of 2025 in a prolonged base-building phase between 70 and 100, with price grinding sideways for months before a decisive breakout in late February. The subsequent advance has been relentless, clearing 120, 150, 190, and 220 in sequence. Price is currently trading around 290, with EMA21 (213.45) and EMA78 (171.75) in a sharply widening bullish cross, both trending steeply higher.
The 190 level had been the most recent consolidation ceiling before the huge gap, and the 220 zone marked the pre-gap high. The magnitude of today's move, gapping from the 220 area to 290, suggests a possibility of significant volatility as the market digests the move. RSI is at 87.26, deep in overbought territory and the highest reading on the entire chart.
Fibonacci extension levels at 309.90 (1.272) and 333.43 (1.618) are plotted as the next upside targets on any continuation.
Key levels to watch:
Resistance: 290 (gap high) / 309.90 (1.272 fib) / 333.43 (1.618 fib)
Support: 220 / 190 / 171.75 (EMA78) / 150 / 120
Bear case: RSI at 87 with price pulling back sharply from the gap high raises the risk of a full gap fill toward 220 or below. A close under EMA21 at 213 and a continued fade would bring 190 back into play as the next meaningful support.
Bull case: A hold above 220 and reclaim of the gap zone above 250 would signal the market is absorbing the move constructively. Follow-through above 290 reopens the path toward the 310 and 333 fib extension targets, backed by the Nvidia dependency narrative as a multi-year structural catalyst.
Bias is bullish on the structural breakout and Nvidia endorsement catalyst, but with RSI at extreme overbought levels and a sharp intraday reversal from the gap high, a consolidation or partial gap fill before continuation is the more probable near-term path.
MRVL Bounce Setup: Support Holding Near $198 Could Trigger PushCurrent Price: 198.70
Direction: LONG
Confidence level: 64%(Bullish AI narrative and call-heavy options flow support upside, while price is currently sitting near a strong support zone identified by traders around $198–$195. However, resistance overhead and mixed intraday sentiment lower confidence slightly.)
Targets
Target 1: 203.14
Target 2: 205.02
Stop Levels
Stop 1: 198.12
Stop 2: 195.08
Wisdom of Professional Traders:
This analysis synthesizes insights from thousands of professional traders and market experts, combining trader insights from professional video analysis with real‑time sentiment on X. The wisdom of crowds often provides a clearer view than a single analyst because it blends technical setups, options positioning, and short‑term momentum signals.
Today’s MRVL setup stands out because multiple traders are watching the same levels: strong intraday support around the $198 area and heavy sell orders around $203–$205. When many traders identify the same levels, those levels tend to matter more during the trading session.
Key Insights:
Here’s what’s driving today’s MRVL setup. The stock is heavily tied to the AI infrastructure theme. Many traders highlighted that Marvell’s networking and custom silicon chips are essential for AI data centers, which puts the company directly inside the NVIDIA‑driven infrastructure boom. That narrative continues to support demand for the stock.
What caught my attention in the social flow is the optimism around earnings and AI bookings. Several traders noted strong AI‑related revenue growth and raised forward guidance for fiscal 2027 and 2028. On X, traders are also pointing out the options activity — calls represent roughly 60% of the options volume today, which usually signals bullish positioning for the session.
That said, price action earlier showed a sharp move from about $220 down toward $199 before stabilizing. That type of flush often creates intraday support zones where buyers step back in.
Recent Performance:
MRVL has been one of the quieter winners of the AI rally. The stock has reportedly climbed more than 120% year‑to‑date and recently traded near all‑time highs before pulling back after earnings. Today’s price action shows volatility following that move, with the stock dipping sharply but now stabilizing around the $198 support shelf.
You can see buyers stepping in near that level during the session, which suggests traders are defending it.
Expert Analysis:
Several professional traders are focused on the microstructure of today’s order book. One commonly mentioned observation is the cluster of bid liquidity near $198 and $195, which is acting as the short‑term floor. As long as that bid zone holds today, buyers may attempt a rebound.
At the same time, traders repeatedly flagged heavy overhead supply at $203 and $205. Those levels are stacked with sell orders, so any rally today will likely pause there. If MRVL can push through $203, the path toward $205 opens quickly because short‑term momentum traders often chase those breakouts.
So the trade thesis today is pretty simple: support is defined, resistance is clear, and buyers appear to be defending the base.
News Impact:
Recent earnings and guidance updates are the main catalysts today. The company reported strong AI‑driven demand and raised revenue expectations tied to data‑center networking and custom silicon. Several analysts also raised price targets — some reaching as high as $275 to $300.
However, despite strong fundamentals, the stock experienced a “sell‑the‑news” reaction intraday. That kind of reaction often creates short‑term dip‑buy opportunities when sentiment remains broadly bullish.
Trading Recommendation:
Here’s my take for today’s trading session: MRVL looks like a tactical bounce setup as long as the $198 support continues to hold. I’d look for a push toward $203 first, which is the nearest liquidity band. If momentum builds, the next target sits around $205 where heavier supply appears.
Risk management is important here because the structure breaks if $198 fails. A move below $195 would likely trigger further downside selling.
So the trade idea is straightforward for today: lean long near support, target the resistance zone above, and keep stops tight below the liquidity shelf.