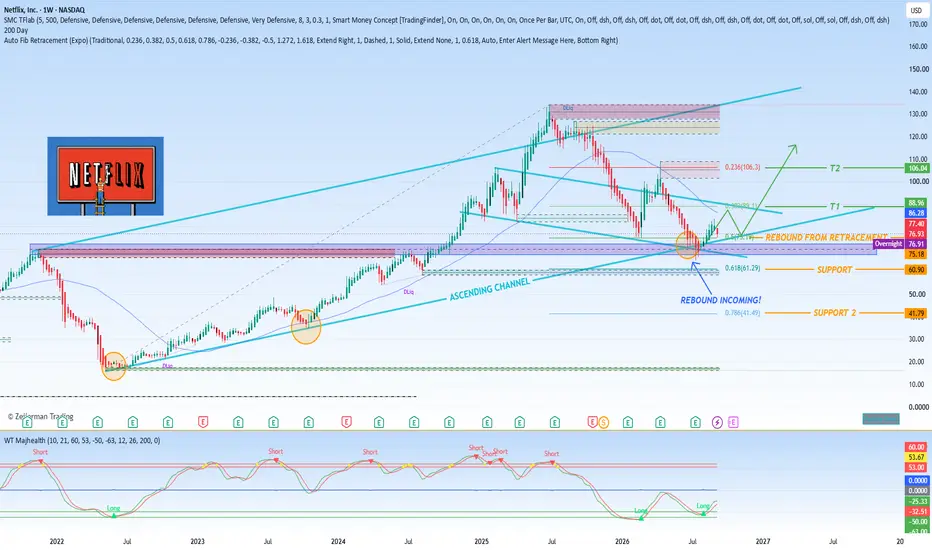
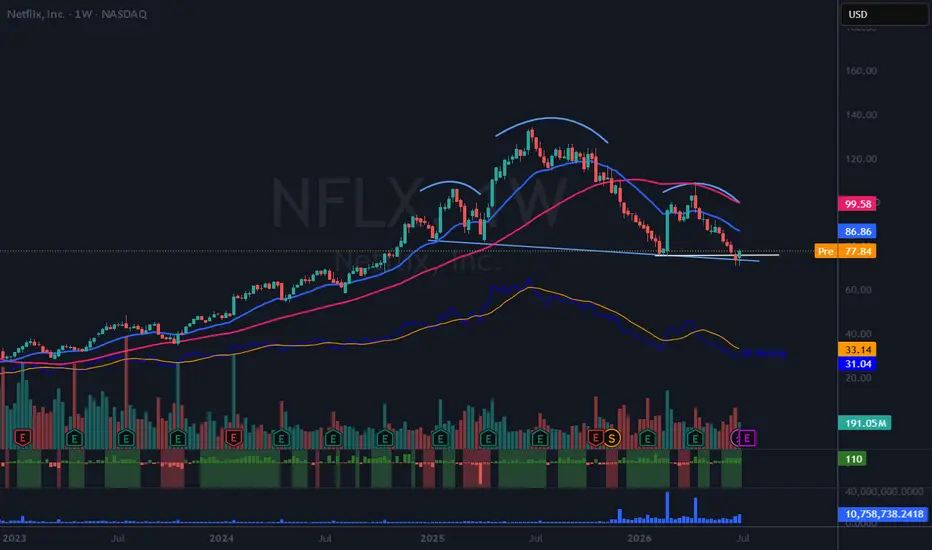
Netflix - Once again testing major support!🎥Netflix ( NASDAQ:NFLX ) still remains incredibly bullish:
🔎Analysis summary:
Just a couple of weeks ago, Netflix already retested the major confluence of support. And while you were already able to catch a first decent rejection, Netflix is printing even more money. All Netflix has to create is another retest and bullish confirmation at this support.
📝Levels to watch:
$70
Keep your #LONGTERMVISION🙏
— Phil (@TheTraderPhil)
In-depth trading ideas
Jade Lizard Trade Idea $NFLX 10/16 ExpyNFLX Jade Lizard
(Jade Lizard: 3-option trade involving a call credit spread above the price and a short put below the price such that the total premium to open the trade exceeds the max loss of the call credit spread buy-to-close, hence no risk to the upside).
Buy NFLX $75 Call 10/16
Sell NFLX $74 Call 10/16
Sell NFLX $69 Put 10/16
~$150 credit to open.
Day of expiration scenarios:
(1) Share price is >$75: Close for $100 (or between $1 - $100).
(2) Share price is between $69 and
NFLX: Is 4hrs TF Bullish Set Up In Place? Sure it is ladies and gentlemen but as of now it is only in the 4hrs TF but that might change by the end of week. We will follow the move.
For the next 2 weeks starting tomorrow we should expect a move to the upside with the 4hrs Zero Line target on the table.
Place your bets ladies and gentlemen and grab a beer because wild rides are coming.
Play it right...................Play it safe......................Play it The Numberfive Way.
Boost.......................Follow...................Share.
NFLX 2H - SUPPORT REVERSAL | LONG SETUP
NASDAQ:NFLX has been selling off from the $83–84 area and dropped into the $75 support zone before bouncing.
That bounce reached around $74, but price pulled back again and is now sitting directly on the $70.5–72 support zone.
This is the key area on the chart. I’ll take the long here if the support holds.
NASDAQ:NFLX LONG SETUP
ENTRY: $70.5 - $17
TP1: $73.5
TP2: $75
SL: $69.7
I’ll take the long around $70.5 - 71
First target is $73.5, which was the previous support before the lat
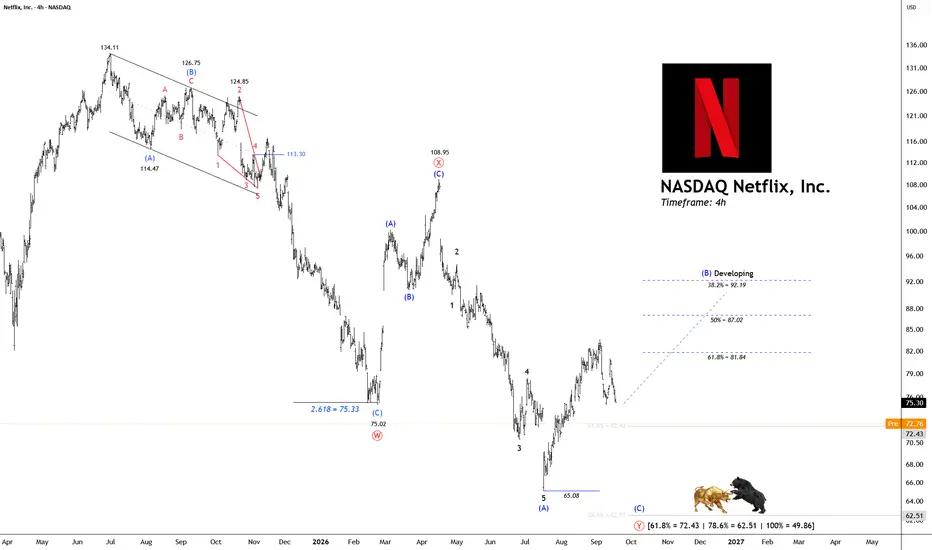
Netflix (NFLX): Is Wave (B) Heading Toward 80 - 86 - 92?📊 Netflix Stock: 4H W-X-Y Correction and Wave (B) Targets
Netflix appears to be developing a larger W-X-Y corrective structure on the 4-hour chart. The decline from 108.95 to 65.08 appears to have completed Wave (A) in five waves. Price has since started a recovery, which I am treating as a developing Wave (B) .
Netflix is currently at an interesting point in the larger corrective structure. If Wave (B) continues higher:
🎯 Target Levels
Target: 80
Target: 86
Target: 92
Wells Fargo downgraded Netflx target price to 57.00NFLX | 4H Technical Analysis — Sep 21, 2026
Netflix is sliding hard after Wells Fargo downgraded the stock from equal weight to underweight and slashed its price target from 80 to 57 dollars. The bank cited a worrying trend in subscriber engagement, warning that the platform's slate of major original series has been thin and that the impact is now showing up in the numbers. Wells Fargo specifically forecasts first half 2026 viewership to fall 8% versus the same period last year, framing the co
NFLX: Completion of Massive Head-Shoulder, Target Zones!Hello Community,
welcome to my new analysis of NFLX on the weekly timeframe perspective. In this stock, I have detected crucial signs of completion of the massive bearish head-and-shoulders formation. Now I have identified all the factors that will be highly necessary to consider next.
When looking at my chart, we can see how NFLX formed the breakdown below the neckline of this gigantic head-and-shoulders formation. Now, it is confirming this breakdown, with the bearish continuation formation
NFLX: 81.73 Gives Way, 79.85 Now in Focus81.73 has been the key level for NFLX for months now, and it's still driving price action. September's break of 79.85 was decisive - the subsequent retest and rejection there confirms it: old support now acting as resistance. Below 77.27 opens up even more room to the downside.
Quick note on the lines — red, orange and green, solid vs. dashed, aren't random. Each carries different meaning. I'll get into it as we go.
Long Netflix ($NFLX)From a technical point of view:
- Bullish action price : Price reclaiming EMA/SMA21 is very important for the stock. It's also showing lot of strength on a red day for the markets.
- Bullish RSI Divergence : Stock printed a good RSI divergence back in July and only moved up since then (until last week selloff). RSI also looks bullish
- Rejection from support : Stock rejected the $70 2021 ATH which wasn't touch for a long time
- Fibonacci retracement : Price also rejected the 0.5 Fibonacc
70.00 is still our support #NFLXNetflix (NFLX) grew revenue faster over the past twelve months than Amazon, Apple, Comcast, or Disney and earned a wider operating margin than all of them except Apple. Its shares still finished those twelve months down 38.9%, the last of the five. The fall has not made the stock cheap. That is the mismatch worth explaining.
Is There Anything Left for Netflix to Grow Into?
When the question turns to whether Netflix still has room to expand, management’s answer is unambiguous: most of the opport
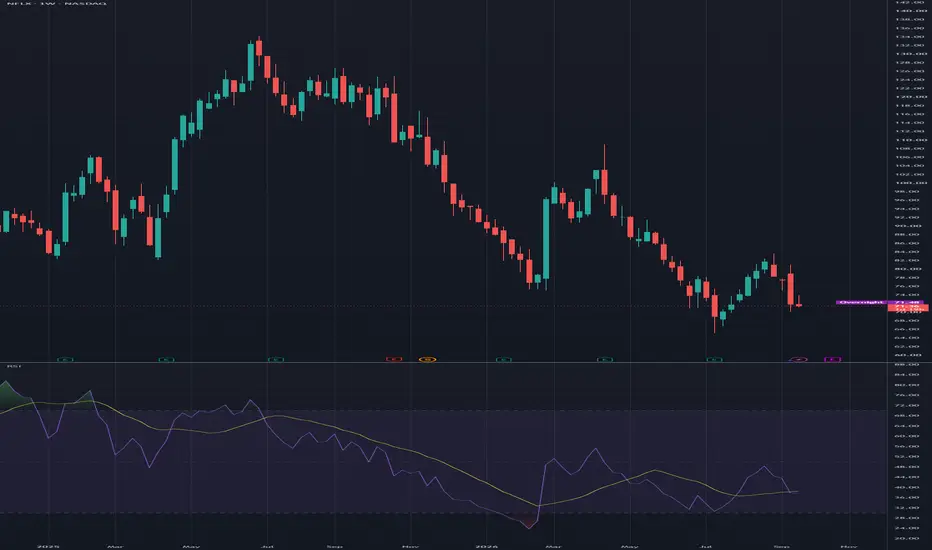
NFLX | Weekly Structure | Waiting for the Wave 2 PullbackThesis:
NASDAQ:NFLX is beginning to show what could be an important trend change after a long correction.
Price has already bounced from around $64 to $83.50 since the middle of July. That is a strong first move and, in my view, enough to potentially complete Wave 1 even though I was initially looking for a move toward the 200 Day MA around $88.
After such a move, a Wave 2 pullback would be completely normal and is now what I would prefer to see before building a position.
Current Structu
NFLX | Continued stock growth- Timeframe: Weekly
- Trade type: Buy stop order
- Price: 70.68
- Take Profit: Open
- Stop Loss: 66.69 (-5.70 %)
Idea: Long on a breakout above last week's high - bullish momentum continuation.
Entry: Buy stop above last week’s high.
Stop-loss: Below the low of the same candle.
If the weekly candle closes below this level, the trade is invalidated.
Take Profit: Trailing stop following the lows of new weekly candles.
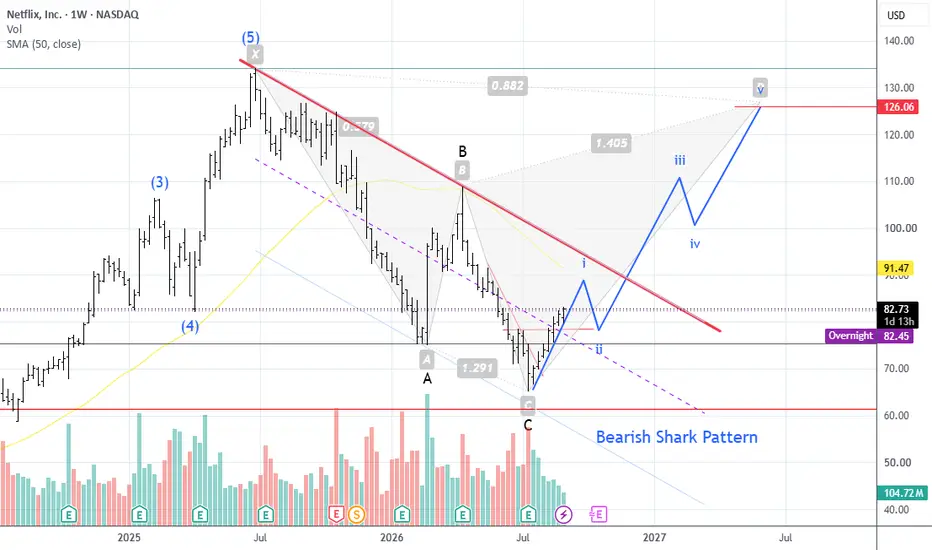
Netflix - Multiyear 5 Waves Ended?Netflix looks like its completed a nice 5 wave move over the last 20 years or so to the 2025 peak at $134 and has since retraced roughly 50% in what looks like another 5 wave move.
I think the 5 wave move is probably A wave of an ABC so possibly B wave has started that could push up to the 0.5/0.618 fib level before C wave starts to new lows to complete a multiyear correction.
$NFLX Failed H&S Pattern?NASDAQ:NFLX
This could be a failed breakdown of a head and shoulders pattern AND an undercut and rally. (White line shows undercut and rally area.) All TBD.
I am back from a much needed 2 week vacation. This one caught my eye. Maybe worth putting on your watchlist.
If I take a position, I'll update this post.
Netflix - This setup is playing out now!🎥Netflix ( NASDAQ:NFLX ) already rallied about +25%:
🔎Analysis summary:
Just a couple of days ago, Netflix nicely retested some major higher timeframe support. And while we already saw bullish confirmation, Netflix already rallied about +25% so far. Looking at the higher timeframe though, this bullrun on Netflix is clearly not over soon.
📝Levels to watch:
$70 and $140
Keep your #LONGTERMVISION🙏
— Phil (@TheTraderPhil)
NFLX - Reversal Strategy Long Setup
🍀Overview
I am not a discretionary technical analyst, so I rely on predefined setups rather than subjective chart analysis. I built the rules into a strategy to make the decision-making process more systematic.
This setup occurred before I developed the strategy. I am documenting it retrospectively and will continue to follow the trade until the strategy or I exit the position.
🍀Process
Ticker : NASDAQ:NFLX
Date : 26/06/2026
Timeframe : Daily
Direction : Long
Strategy : Rev
Netflix — Bearish Pressure Toward $47Netflix is currently showing signs of downside pressure, with sellers gaining strength across the recent price action. The bearish bias remains active, and the stock could extend its decline toward the $47 target if selling momentum continues.
The current structure suggests that buyers are struggling to regain meaningful control, while downward pressure continues to weigh on price. Instead of anticipating an immediate recovery, the focus remains on the potential continuation of the decline towa
NETFLIX Next 4-year Cycle targets $450.Netflix (NFLX) has been trading within a 24-year Channel Up since its IPO and since its June 30 2025 All Time High (ATH) has started a correction. Throughout this pattern, there have been another three such correction phases, which are typically bullish trend Pause Periods (Rectangles) as opposed to the stronger Bearish Legs (Bear Cycles).
The similarities of those Pause Periods are that they all pulled back to their respective 0.236 Fibonacci retracements, while holding the 1M MA50 (blue trend