ON: Bullish Engulfing Confirms Clean Cup & Handle Retest!🍵 Following a multi-month accumulation cup and handle breakout, price has completed a textbook Retest of the primary horizontal neckline at $68.00 – $70.00.
🕯️ A powerful 3D bullish engulfing candle formed right at the retest pivot, confirming strong institutional absorption at key support.
🛡️ Triple Confluence Support Floor ($69.00):
Cup & Handle Breakout Neckline Retest.
Multi-month Ascending Trendline Support.
Dynamic 200 EMA (Purple Line) floor.
📈 Progressive Upside Target Ladder:
🎯 Tar
In-depth trading ideas
ON Semiconductor: catalyst re-rating out of a correctionDifferent flavor: ON isn't at an extended high, it's re-rating out of a correction. Closed Friday $84.88 (+14.3% week, relative volume 2.02×) but still -10.4% over 3 months, with earlier-2026 highs well above $100 — real overhead supply to work through.
Catalyst: the Synaptics deal revised to all-cash $123/share (~$5.7B, down from ~$7B), immediately accretive to non-GAAP EPS per management. The stock jumped 6–7% on it — a genuine repricing event.
The plan: Monday zone $82.75–$85.50, no-chase a
ON: $90 Next or Gap Fade? | Oct. 5–9
ON enters the week following a sharp breakout, with revised Synaptics acquisition terms providing the catalyst. The October 1 agreement changes the transaction to $123 per Synaptics share in cash, valued at approximately $5.7 billion versus roughly $7 billion previously. Management expects the deal to increase adjusted EPS immediately upon closing, which remains targeted for mid-2027. This week’s focus is whether buyers can sustain the repricing.
The daily chart shows a meaningful change in st
ON: gambling with fibo numbersSince COVID shock it followed a massive growth to then ATH in Jul'23. Since ATH in Jul'23 it pulled back by 0.786 (look at 52 wk low on liberation day). Then it charged up by 1.272 to a historic ATH in May'26. Now on the heels of synaptics buyout it has retreated to as low as 70 i.e. by fibo 0.618 (last week there was a bad leak of confidential slides, it caused some intraday noise to 66 which is exactly 200 wk ema support where buying algos jumped in). If I extend to next year, it will shrug of
ON | Continued stock growth- Timeframe: Weekly
- Trade type: Buy stop order
- Price: 76.19
- Take Profit: Open
- Stop Loss: 68.79 (-9.70 %)
Idea: Long on a breakout above last week's high - bullish momentum continuation.
Entry: Buy stop above last week’s high.
Stop-loss: Below the low of the same candle.
If the weekly candle closes below this level, the trade is invalidated.
ON: Post-Earnings Dip – AI Growth Catalyst SetupIdea: Long ON (ON Semiconductor)
Entry: $80.00
**Stop Loss:** $66.00
Take Profit: $110.00
**Risk/Reward:** ~1:1.9 (Risk $14.00 / Reward $30.00)
Timeframe: Swing / Position Trading (Weeks to Months)
The Setup
ON Semiconductor delivered a strong Q2 2026 earnings beat on August 3, reporting non-GAAP EPS of $0.74, up 39.6% year-over-year and surpassing the $0.71–$0.72 consensus. Revenue climbed 9.2% to $1.604 billion, edging past the $1.59 billion FactSet estimate. The stock initially rallied over
ON Semiconductor (ON): Watching for a Reversal From Key SupportON Semiconductor (ON) remains on my watchlist after an extended pullback. While the stock has been under pressure over the past several months, the company continues to be one of the leaders in power semiconductors, silicon carbide (SiC), automotive electronics, industrial automation, and AI infrastructure.
The company recently delivered stronger-than-expected quarterly results, with management highlighting accelerating demand from AI data centers while maintaining its long-term position in aut
ON | Continued stock growth- Timeframe: Weekly
- Trade type: Buy stop order
- Price: 98.21
- Take Profit: Open
- Stop Loss: 86.47 (-11.90 %)
Idea: Long on a breakout above last week's high - bullish momentum continuation.
Entry: Buy stop above last week’s high.
Stop-loss: Below the low of the same candle.
If the weekly candle closes below this level, the trade is invalidated.
Take Profit: Trailing stop following the lows of new weekly candles.
ON Semiconductor (ON) Pullback Creates Buying OpportunityON is attracting buying interest following a recent pullback. The stock remains in a strong uptrend, characterized by higher highs and higher lows while continuing to trade above its 20-day and 50-day moving averages.
ON Semiconductor Corporation is a $47.66 billion market capitalization company that provides intelligent power and sensing solutions, with a primary focus on the automotive and industrial markets. The company operates through three segments: Power Solutions Group (PSG), Analog and
onsemi’s Strategic Pivot: Dominating Power and AIOnsemi is currently redefining its position in the global semiconductor landscape. The company recently achieved record milestones within its data center business. Analysts responded by maintaining strong "Buy" ratings and high price targets. They specifically highlighted margin expansion as a primary growth catalyst. This financial resilience underscores onsemi’s successful transition toward high-value, intelligent power solutions.
The AI and Data Center Revolution
Artificial Intelligence no
ON semi: accumulatingPlaying this one for a break of down trend on the weekly. Holding anchored VWAP from April lows. Clear consolidation pattern for the last nine weeks. If theres any meaningful strength tomorrow we will see a nice hammer form, so any adds will likely be late in the day. Williams% ticking higher and RSI neutral. MACD is meh.
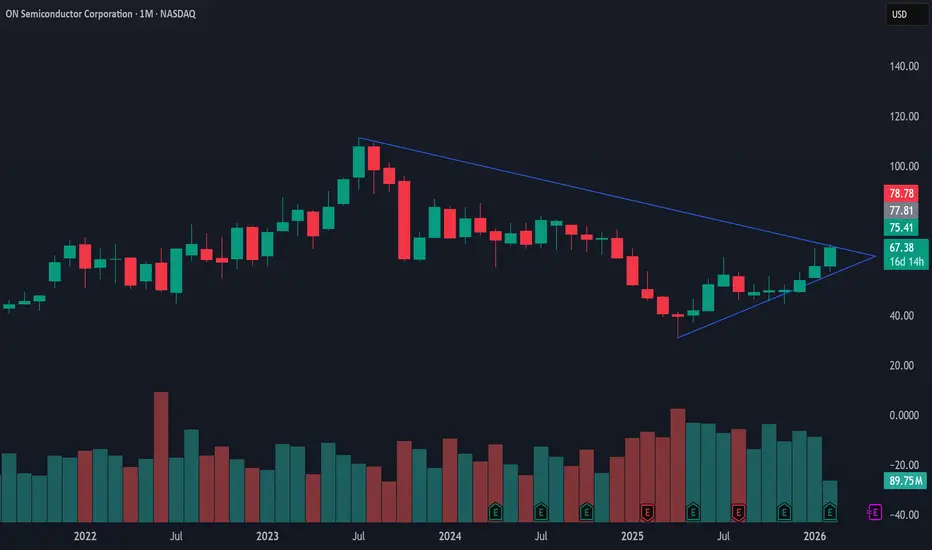
ON Semiconductor ($ON) – Breakout Potential Towards $67ON Semiconductor ( NASDAQ:ON ) is approaching a key breakout zone within a long-term descending resistance and ascending support trendline.
📊 Analysis & Setup:
The stock has been building higher lows since April, signaling strong bullish accumulation.
A decisive breakout above $62.30 could trigger a strong upside move.
Technical projection shows a potential rally of ~25% from the current base.
🎯 Targets:
First target: $62.30 (breakout level)
Second target: $67.20 (+7.7% after breakout)
❌
How to use Quantity aka Volume Indicators for high profits.There are 3 data sets that are using in technical analysis of a stock, index, or ETF BTC chart.
Price, Time, and Quantity.
Two of these data are required for an indicator.
Using volume bars completes the data for candlestick chart patterns. It is easy to learn how to read and understand the relationship between price action and volume.
When volume has a fading volume pattern, then the run up or down is at risk of suddenly reversing.
When volume surges to the top of the chart, this warns of eith
A Technical Review of ON: Trendlines and Potential TargetsBullish Trendline in Play : The price action since late April/early May clearly demonstrates an upward-sloping trendline (highlighted in light blue), indicating a sustained bullish momentum. The price has respected this trendline on multiple occasions, suggesting its significance as dynamic support.
Recent Breakout and Retest of Resistance : The chart shows a recent decisive breakout above the 57.50 level, which previously acted as resistance. Following the breakout, the price has seen a retes
Trade Plan (Short-Term Swing) for $ON🔍 Chart Setup & Trend
Timeframe: Daily chart
Trend: After a prolonged downtrend, NASDAQ:ON appears to be forming a base and attempting a short-term reversal.
It is testing resistance around $57, and a breakout could trigger bullish continuation.
Price is approaching the 50-day EMA, which is a key level to watch for confirmation.
📊 Key Indicators
RSI: ~52
↳ Neutral, but trending upward. Room to grow before hitting overbought levels.
MACD: Bullish crossover just occurred
↳ Momentum is shift
ON Semiconductor – Reaction at 78.6% Fib, Decision Time at $49.7NASDAQ:ON just reacted to a key 78.6% Fibonacci retracement from the April 2020 low to its all-time high.
After a make-or-break earnings on May 5, price has pushed into a major resistance zone at $49.75. Interestingly, analysts are averaging a price target of $47, slightly below current levels.
💡 Key Setup:
78.6% Fib retracement bounce (long-term move)
Resistance: $49.75
Average analyst target: $47
📅 Summer move will likely be decided in the next couple of weeks. Breakout or rejectio
Short Trade Setup – ON Semiconductor (ON)!🔻
Timeframe: 30-Minute Chart
Pattern: Rising Wedge Breakdown (Bearish Reversal)
📝 Trade Plan (Short Position)
📌 Entry: ~$45.22 (Breakdown confirmation below wedge)
🛑 Stop-Loss (SL): $47.26 (Above wedge resistance / structure invalidation)
🎯 Take Profit Targets:
TP1: $43.06 (First support level – red line)
TP2: $40.45 (Stronger base support – green line)
📊 Risk-Reward Calculation
Risk: $47.26 - $45.22 = $2.04
Reward to TP1: $45.22 - $43.06 = $2.16
Reward to TP2: $45.22 - $40.45 = $4.77
ON | Long Setup | Bullish Recovery Flow | (May 2025)ON | Long Setup | Breakout from Downtrend Channel + Bullish Recovery Flow | (May 2025)
1️⃣ Short Insight Summary:
ON Semiconductor (ON) is breaking out of its long-term downtrend channel, showing strong price action and renewed momentum. A recovery seems to be gaining speed, and May could be a key turning point.
2️⃣ Trade Parameters:
Bias: Long
Entry: Around current levels (post-breakout zone)
Stop Loss: $28 (providing extra room for potential liquidation wicks)
TP1: $56
TP2: $71
TP3: $76
TP4: