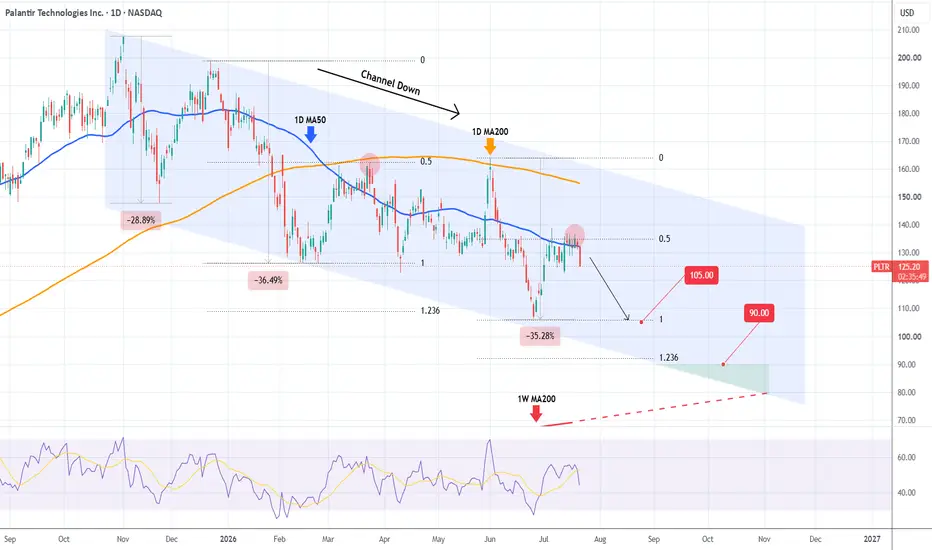
PALANTIR unable to escape this Channel Down towards $105.Palantir (PLTR) has been trading within almost a 9-month Channel Down following its November 03 2025 All Time High (ATH). Today it is declining heavily after a double rejection on both the 0.5 Fibonacci retracement level of the previous Bearish Leg and the 1D MA50 (blue trend-line).
Last time we saw this was on the March 24 2026 rejection, again on the 0.5 Fibonacci retracement level of a -36.49% Bearish Leg (similar to the previous one of -35.28%).
As a result, we expect Palantir to seek again it's recent Low, targeting $105.00. By October we can even see it testing $90.00 (just under the 1.236 Fibonacci extension as with the June 25 Low). As long as the 1W MA200 (red trend-line) supports, that should technically be a Buy Zone.
---
** Please LIKE 👍, FOLLOW ✅, SHARE 🙌 and COMMENT ✍ if you enjoy this idea! Also share your ideas and charts in the comments section below! This is best way to keep it relevant, support us, keep the content here free and allow the idea to reach as many people as possible. **
---
💸💸💸💸💸💸
👇 👇 👇 👇 👇 👇
Palantir Technologies Inc.
No trades
No trades
In-depth trading ideas
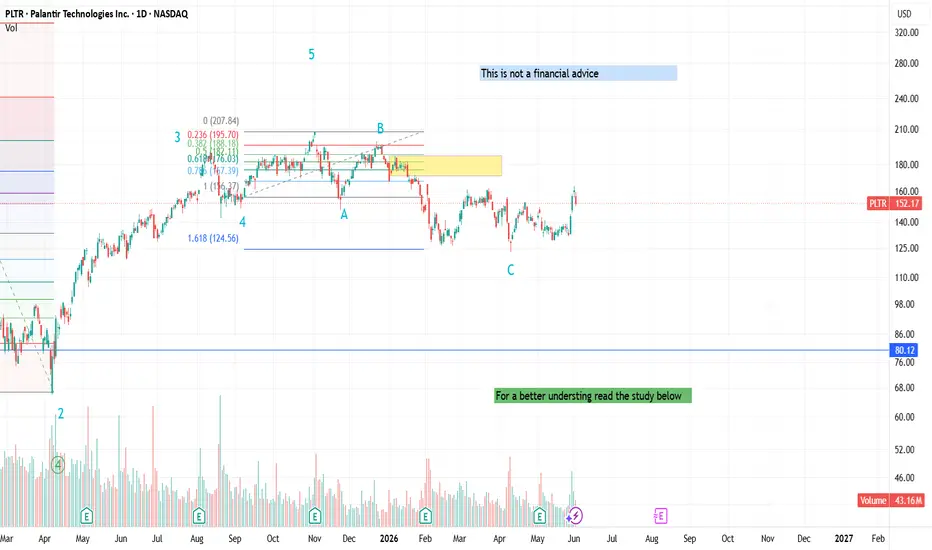
Palantir: Growth Acceleration and a Possible New Impulsive PhaseAfter the May 4 earnings report, Palantir delivered exceptionally strong results, with revenue reaching approximately $1.63 billion, representing 85% year-over-year growth. The most significant driver of performance was the U.S. business, which grew 104% overall, with U.S. commercial revenue accelerating sharply by 133% and government revenue increasing by 84%, highlighting strong momentum across both segments of the business. Profitability remained at very high levels for a rapidly growing software company, with an adjusted operating margin of around 60% and substantial net income supported by strong operating leverage. The company also reported continued expansion in deal activity and backlog, including growth in large contracts and remaining deal value, which contributed to an upward revision of full-year 2026 guidance to approximately $7.65 billion in expected revenue.
From a technical analysis perspective, the price structure appears to have completed a minor Elliott Wave cycle, although with the usual flexibility required when applying Elliott Wave Theory to single equities rather than indices, for which the framework was originally designed. Within this context, the recent consolidation and subsequent price action could be interpreted as the potential start of a new minor impulsive wave, suggesting that momentum may be entering a fresh phase following the completion of the prior structure.
Heading into the next quarterly release, these figures set an extremely high benchmark. The market is no longer pricing Palantir as a typical growth software company but as a key beneficiary of the artificial intelligence adoption cycle. As a result, even strong performance may be viewed as insufficient unless it is accompanied by further acceleration, particularly in U.S. commercial growth and additional upward revisions to guidance, which remain the primary focus for investors.
This is not a financial advice.
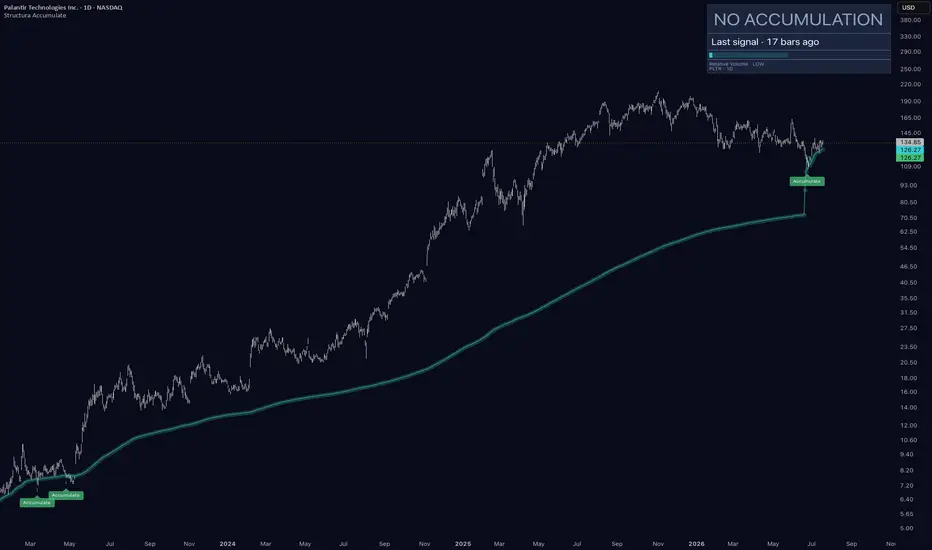
PLTR: Two Accumulation Zones, Three Years ApartThis chart shows two signals from the same structure tool, three years apart. Reading them together is a lesson in what accumulation zones are - and what they aren't.
The old zone: May 2023, around $8
Structura Accumulate marked a zone when PLTR was rebuilding structure near $8 - deep in the post-2022 reset, when attention on the name was minimal. What followed is one of the strongest advances of this cycle.
Here's the honest part: that zone did not predict the advance. It identified a structural condition - price rebuilding around a long-anchored reference after a major decline. The magnitude of what came after belongs to the market, not the tool. Zones can fail. This one didn't - and using a single spectacular example as proof would be exactly the kind of thinking structure analysis exists to replace.
The new zone: 17 bars ago
A fresh Accumulate signal fired about three and a half weeks back - the first on this chart in a long while. The tool's silence between the two zones matters as much as the signals: through the entire advance, no new zone. Accumulation is a rebuilding behavior; it appears where structure is being built, not where trends are extending.
How to treat a fresh zone - the protocol
A new zone is not a trigger. It is an area of interest with a binary question attached: acceptance or rejection.
Watch how price behaves around the zone over the following weeks - stabilization and reclaim, or failure and continuation lower.
Acceptance means structure is holding: the market is treating the area as a base.
Rejection is information too - it tells you the rebuilding attempt failed, and you learned it without predicting anything.
Either way, you stay objective. The zone defines where to pay attention; the market's reaction supplies the verdict.
The takeaway
Two zones in three years on one of the market's most-watched names - that selectivity is the feature. A structure tool speaks rarely, at structurally meaningful places, and stays silent everywhere else. What it never does is promise that the next zone rhymes with the last one.
Structura Accumulate is free and public - full framework in our profile.
Chart Whisperer | Intuitive Market AnalysisI don’t look at the markets the way everyone else does. I consider myself a bit of a chart whisperer—not because I have a secret algorithm, but because years of staring at the screens have given me a deeply personal, intuitive feel for price action. My trading style is anchored in reading the natural rhythm of the candles, and more often than not, the market moves exactly the way my intuition says it will.
If you are looking for high-probability predictions and want to watch these setups play out in real-time, hit that follow button.
Just to be completely transparent: I am absolutely not a professional financial advisor, and nothing I post is official trading advice. I’m simply a retail trader sharing my personal journey, ideas, and charts. Trade at your own risk, but feel free to follow along if you want to see how an intuitive approach tackles the market
Palantir - Look at this bullish fakeout!🔥Palantir ( NASDAQ:PLTR ) might create a nasty fakeout:
🔎Analysis summary:
Just last month Palantir created a nasty monthly candle of about -25%. With this massive drop, Palantir also broke major support towards the downside. This month however, bulls are stepping in aggressively and potentially turning this into a bullish false breakdown.
📝Levels to watch:
$130
Keep your #LONGTERMVISION🙏
— Phil (@TheTraderPhil)
Palantir (PLTR): Is It Time to Buy Again?Palantir’s stock price has fallen by almost 50% since its all-time high reached in November last year. A legitimate question arises: is it already time to start buying again, or is it still too early from both a technical and fundamental perspective?
To answer this question, I will focus on:
• Palantir’s valuation ratios
• Technical analysis signals from financial markets
Palantir Technologies is a US software company specializing in big data analytics, artificial intelligence, and decision-support platforms. Founded in 2003, it has been listed on the Nasdaq for two years under the ticker symbol PLTR and belongs to the information technology sector, more specifically the infrastructure software industry.
Unlike semiconductor companies such as NVIDIA or AMD, Palantir does not manufacture electronic components. Its business model is based on developing platforms capable of connecting, structuring, and analyzing large amounts of data from multiple sources — in other words, big data.
The company mainly offers three solutions: Gotham, used by governments, defense organizations, and intelligence agencies; Foundry, designed for companies to optimize their operations; and AIP (Artificial Intelligence Platform), which integrates generative artificial intelligence into decision-making processes.
The chart below displays the weekly Japanese candlesticks of Palantir’s stock (PLTR). The stock has lost almost 50% since its all-time high reached in November 2025.
Palantir works with both public and private sector organizations across various industries, including defense, healthcare, industrials, energy, and finance. Its competitive advantage lies in its ability to manage complex environments, secure data, and transform information into operational decisions. Its recent growth has been strongly supported by the rise of artificial intelligence, but the stock eventually entered a correction after reaching a record high last November.
So, is it time to buy again? From a fundamental perspective, despite the 50% decline, the stock remains extremely expensive — arguably too expensive — based on valuation metrics such as the Forward P/E, traditional P/E, and Price-to-Sales ratio.
The table below presents the ranking of US companies belonging to the AI software/infrastructure industry within the technology sector. The ranking criterion is the Forward P/E ratio, and despite its 48% correction over recent months, Palantir remains a very expensive stock market valuation.
From a technical perspective, the stock is still trading within a bearish structure. It would need to break upward out of this structure to generate a signal confirming a final bottom. This has not happened at the time of writing. According to Fibonacci ratios, an area of technical interest is located between $80 and $100.
DISCLAIMER:
This content is intended for individuals who are familiar with financial markets and instruments and is for information purposes only. The presented idea (including market commentary, market data and observations) is not a work product of any research department of Swissquote or its affiliates. This material is intended to highlight market action and does not constitute investment, legal or tax advice. If you are a retail investor or lack experience in trading complex financial products, it is advisable to seek professional advice from licensed advisor before making any financial decisions.
This content is not intended to manipulate the market or encourage any specific financial behavior.
Swissquote makes no representation or warranty as to the quality, completeness, accuracy, comprehensiveness or non-infringement of such content. The views expressed are those of the consultant and are provided for educational purposes only. Any information provided relating to a product or market should not be construed as recommending an investment strategy or transaction. Past performance is not a guarantee of future results.
Swissquote and its employees and representatives shall in no event be held liable for any damages or losses arising directly or indirectly from decisions made on the basis of this content.
The use of any third-party brands or trademarks is for information only and does not imply endorsement by Swissquote, or that the trademark owner has authorised Swissquote to promote its products or services.
Swissquote is the marketing brand for the activities of Swissquote Bank Ltd (Switzerland) regulated by FINMA, Swissquote Capital Markets Limited regulated by CySEC (Cyprus), Swissquote Bank Europe SA (Luxembourg) regulated by the CSSF, Swissquote Ltd (UK) regulated by the FCA, Swissquote Financial Services (Malta) Ltd regulated by the Malta Financial Services Authority, Swissquote MEA Ltd. (UAE) regulated by the Dubai Financial Services Authority, Swissquote Pte Ltd (Singapore) regulated by the Monetary Authority of Singapore, Swissquote Asia Limited (Hong Kong) licensed by the Hong Kong Securities and Futures Commission (SFC) and Swissquote South Africa (Pty) Ltd supervised by the FSCA.
Products and services of Swissquote are only intended for those permitted to receive them under local law.
All investments carry a degree of risk. The risk of loss in trading or holding financial instruments can be substantial. The value of financial instruments, including but not limited to stocks, bonds, cryptocurrencies, and other assets, can fluctuate both upwards and downwards. There is a significant risk of financial loss when buying, selling, holding, staking, or investing in these instruments. SQBE makes no recommendations regarding any specific investment, transaction, or the use of any particular investment strategy.
CFDs are complex instruments and come with a high risk of losing money rapidly due to leverage. The vast majority of retail client accounts suffer capital losses when trading in CFDs. You should consider whether you understand how CFDs work and whether you can afford to take the high risk of losing your money.
Digital Assets are unregulated in most countries and consumer protection rules may not apply. As highly volatile speculative investments, Digital Assets are not suitable for investors without a high-risk tolerance. Make sure you understand each Digital Asset before you trade.
Cryptocurrencies are not considered legal tender in some jurisdictions and are subject to regulatory uncertainties.
The use of Internet-based systems can involve high risks, including, but not limited to, fraud, cyber-attacks, network and communication failures, as well as identity theft and phishing attacks related to crypto-assets.
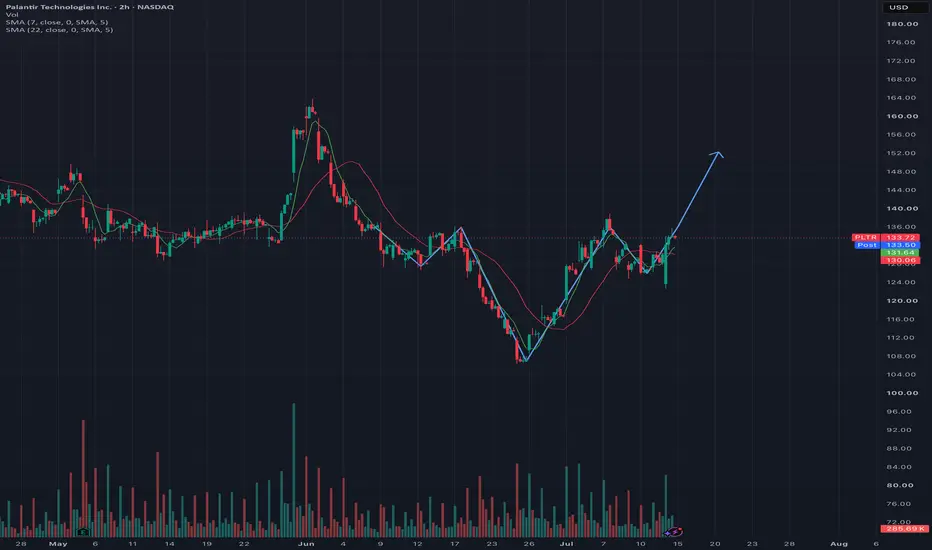
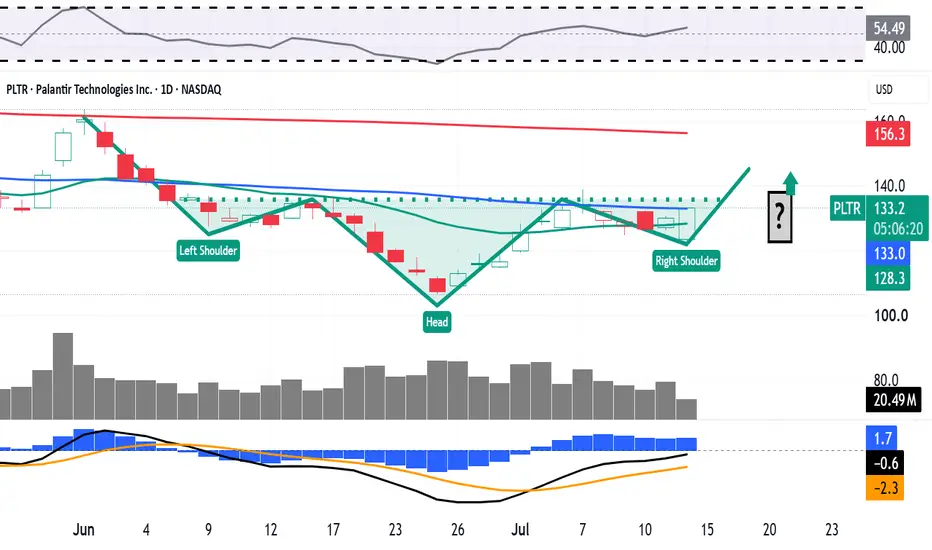
Inverted H&S pattern in PLTRLeft shoulder low: ~$127
Peak between LS and Head (left neckline): ~$136-137
Head low: ~$107
Right shoulder low: ~$128-129
Current price: $134.19 — still inside the pattern, approaching the neckline
The neckline at ~$136-137 has NOT been broken yet. At $134, price is still ~$2-3 below the neckline. So this is still a pending IH&S breakout, not a confirmed one. That's actually more
A 2h close above $137 with above-average volume confirms the pattern.
Neckline ~$136.50, Head low ~$107 → height = ~$29.50
Target = $136.50 + $29.50 = ~$166
PLTR Soared 3,400%, Then Sank 35%. What Does Its Chart Say Now?Palantir NASDAQ:PLTR has struggled for some nine months now, falling more than 35% after the cybersecurity stock enjoyed a long, nearly parabolic run that saw it gain some 3,400% between December 2022 and November 2025. Can the stock turn its fortunes back around? Let's see what its chart and fundamentals say.
Palantir's Fundamental Analysis
PLTR will next report quarterly earnings in about four weeks' time, releasing fiscal Q2 results in August.
Although management has yet to set an official date for Palantir's earnings release the Street is looking for the company to show $0.35 in adjusted earnings per share on about $1.81 billion of sales.
If those numbers are what actually hit the tape, that would represent about 119% of year-over-year profit growth on roughly 80% in y/y revenue gains.
Meanwhile, analysts' consensus estimates for the company's full-fiscal-year results call for 97% year-on-year earnings growth and a 73% y/y sales increase. Growth like that doesn't come easily for large-cap stocks.
And impressively, 20 of the 23 sell-side analysts that I know of who cover PLTR have increased their earnings estimates since the quarter began. Zero analysts have reduced their estimates, while three have made no changes.
Bank of America analyst Mariana Perez Mora (rated at five stars out of a possible five by TipRanks) recently reiterated her "Buy" rating on the stock, although she hasn't set a price target on PLTR for a while.
Palantir's Technical Analysis
Now let's go to PLTR's chart going back some seven months and running through Wednesday afternoon (July 8):
Readers will first see that Palantir developed a falling-wedge pattern of bullish reversal that lasted from late 2026 into May.
Marked with tan shading at the chart's left, this set-up didn't really produce much for the stock. Palantir tried to break out of the pattern in late May and rally, but failed to do so.
But interestingly, the stock's aborted breakout ended up developing into the first portion of what I think might become an inverse head-and-shoulders pattern (which also predicts bullish reversal).
Marked with green shading at the chart's right, this pattern looks like it's close to two-thirds of the way toward completion.
I've drawn in what could become the pattern's right shoulder if Palantir falters -- which it seems to be doing at its 50-day Simple Moving Average, or "SMA," marked with a blue line at $133.70 above. (The stock closed Monday at $130.04.)
Should Palantir come back, break through and hold the 50-day SMA, then we'll stop looking for an inverse head-and-shoulders pattern.
Instead, portfolio managers would likely have to make decisions on their allocation weightings in the stock in preparation for a potential run at Palantir's 200-day SMA (the red line at $157.10 above).
Until then, the pivot for what might be a bullish pattern in the making would likely stand at $136. (Again, PLTR ended Monday at $130.04.)
Moving on to the other technical indicators above, Palantir's Relative Strength Index (the gray line marked "RSI" at the chart's top) has improved recently, but is struggling to hold above the neutral line.
The stock's daily Moving Average Convergence Divergence indicator (or "MACD," denoted by blue bars, a black line and a gold line at the chart's bottom) has improved as well, but needs more to become strongly bullish.
On one hand, the histogram of the stock's 9-day Exponential Moving Average (or "EMA," marked with blue bars) has moved into positive territory. That's a short-term bullish signal.
Additionally, the 12-day EMA (the black line) is running above the 26-day EMA (the gold line). That's bullish as well. However, that signal's degree of bullishness is somewhat muted by the fact that both of those lines are running below the zero-bound.
(Moomoo Technologies Inc. Markets Commentator Stephen "Sarge" Guilfoyle was long PLTR at the time of writing this column.)
This article discusses technical analysis, other approaches, including fundamental analysis, may offer very different views. The examples provided are for illustrative purposes only and are not intended to be reflective of the results you can expect to achieve. Specific security charts used are for illustrative purposes only and are not a recommendation, offer to sell, or a solicitation of an offer to buy any security. Past investment performance does not indicate or guarantee future success. Returns will vary, and all investments carry risks, including loss of principal. This content is also not a research report and is not intended to serve as the basis for any investment decision. The information contained in this article does not purport to be a complete description of the securities, markets, or developments referred to in this material. Moomoo and its affiliates make no representation or warranty as to the article's adequacy, completeness, accuracy or timeliness for any particular purpose of the above content. Furthermore, there is no guarantee that any statements, estimates, price targets, opinions or forecasts provided herein will prove to be correct.
The Analyst Ratings feature comes from TipRanks, an independent third party. The accuracy, completeness, or reliability cannot be guaranteed and should not be relied upon as a primary basis for any investment decision. The target prices are intended for informational purposes only, not recommendations, and are also not guarantees of future results.
Moomoo is a financial information and trading app offered by Moomoo Technologies Inc. In the U.S., investment products and services on Moomoo are offered by Moomoo Financial Inc., Member FINRA/SIPC.
TradingView is an independent third party not affiliated with Moomoo Financial Inc., Moomoo Technologies Inc., or its affiliates. Moomoo Financial Inc. and its affiliates do not endorse, represent or warrant the completeness and accuracy of the data and information available on the TradingView platform and are not responsible for any services provided by the third-party platform.
Can Palantir Really Reach a $400 Billion Valuation?Palantir Technologies is rapidly dominating the enterprise software landscape. Wall Street analysts project a staggering $400 billion market capitalization by next year. The company is shedding its old reputation as a mere government contractor. Today, Palantir serves as the foundational operating system for global industries.
Geopolitics and Geostrategy
Global conflicts weaponize information. Western defense agencies rely heavily on Palantir Gotham to process battlefield data. The company acts as a geostrategic deterrent in modern electronic warfare. Palantir aligns its corporate mission directly with Western democratic institutions. Consequently, authoritarian regimes cannot purchase its software. This firm ideological stance guarantees steady, long-term government defense revenue.
Macroeconomics and Economics
Stubborn inflation forces corporations to maximize operational efficiency. Palantir capitalizes heavily on this harsh economic climate. Its Artificial Intelligence Platform (AIP) delivers rapid, measurable cost savings. During market downturns, enterprises cut experimental tech spending. However, companies aggressively increase investments in proven data infrastructure. This macroeconomic shift fuels Palantir’s explosive financial growth.
Industry Trends and Business Models
Enterprise software is pivoting toward autonomous, agentic operations. Palantir leads this trend through its innovative Foundry platform. Its unique business model focuses on rapid deployment via targeted boot camps. These interactive sessions turn hesitant prospects into paying customers within days. Commercial revenue now matches government intake. Palantir expands globally, landing major Latin American deals like Mexico's GNP Seguros.
Management, Leadership, and Culture
CEO Alex Karp rejects conventional Silicon Valley corporate norms. He actively fosters an aggressive, mission-driven engineering culture. This unique leadership style prizes critical thinking over corporate conformity. Palantir attracts elite tech talent seeking high-impact, real-world challenges. Management empowers small engineering teams to build decentralized solutions. This lean organizational design guarantees rapid product iteration cycles.
Technology, Science, and High-Tech
Palantir builds highly advanced data integration plumbing. Its new AIP Analyst tool allows non-technical workers to query data using plain language. The platform integrates machine learning with complex physical science workflows. Aerospace and supply chain sectors use it to map molecular-level dependencies. Palantir transforms raw enterprise data into a dynamic, living digital twin. This technological leap changes how humans interact with machine intelligence.
Cybersecurity and Data Governance
Modern cyber threats bypass traditional network perimeters. Palantir enforces absolute security through granular, cell-level data permissions. The platform provides flawless data traceability and immutable compliance audits. Hackers cannot easily compromise decentralized, highly governed networks. Companies manage sensitive consumer records securely while deploying advanced AI tools. Palantir proves that rapid automation requires bulletproof data governance.
The Pharmaceutical Connection
The pharmaceutical sector relies on Palantir to accelerate drug discovery. Researchers unify disparate genomic datasets, clinical trials, and manufacturing supply chains. Palantir helps scientists identify promising chemical compounds years ahead of schedule. Healthcare titans optimize distribution networks during global supply shocks. Consequently, life-saving medications reach patients with unprecedented speed.
Patent Analysis
Intellectual property securement drives Palantir's competitive moat. Patent filings show heavy investment in ontology-based data structures. The company aggressively patents proprietary methods for multi-layer data synchronization. These patents prevent competitors from replicating Palantir’s core data integration architecture. Analysts view this robust patent portfolio as a massive barrier to market entry. Innovation ownership guarantees long-term commercial dominance.
PLTR Coiling for the Next Move? July 13
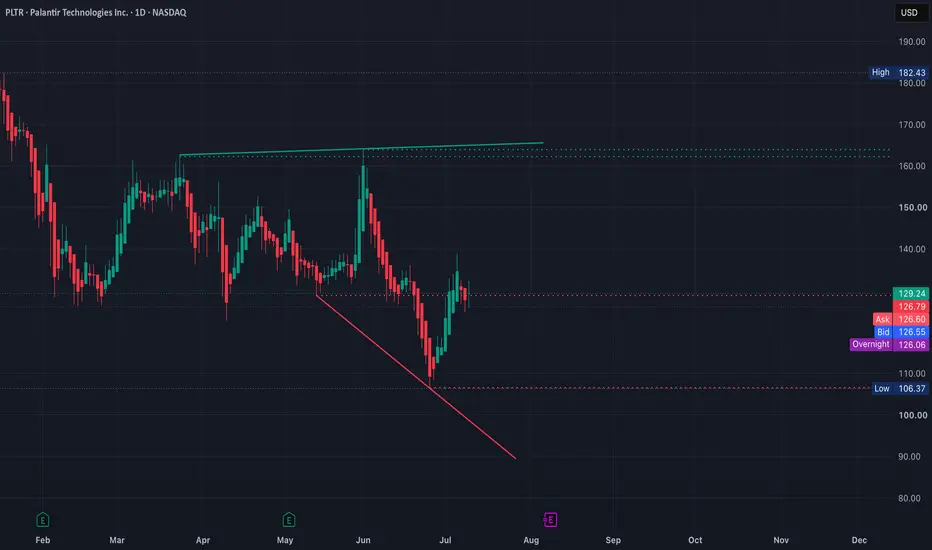
PLTR is coming into the week sitting inside a tight decision zone around 125–130. The daily chart is trying to recover after the sharp drop toward 106, but price is still below the key 129–130 resistance area.
For me, this is not a place to guess direction. I want to see whether PLTR can reclaim 129–130 and hold, or lose 125 and start another move lower.
Daily Chart
The daily chart shows PLTR bouncing strongly from the 106.37 low, but the larger structure has not fully turned bullish yet.
Price is currently sitting around 126–127 and continues to struggle below 129.24. This area acted as an important support level before the selloff, so it may now become resistance.
A daily close above 129.24–130 would be the first sign that buyers are taking control again.
Above 130, I will watch 135, 140 and then the larger resistance area around 162.67–165.57.
The bullish structure becomes much stronger only if PLTR can eventually reclaim the 162–166 area.
On the downside, 125 is the first important support. If PLTR loses 125, the next larger downside levels are 120 and then the previous low around 106.37.
15-Minute Chart
The 15-minute chart shows PLTR consolidating after the rejection from 132.28.
Price is now trading in a very tight range near 126.50, with support around 125.75–125 and resistance around 127.25–128.
The stock is also trading below the short-term moving average, so buyers still need to prove that they can reclaim 127.25 and push back toward 128–130.
This tight consolidation can lead to a strong move, but I would wait for price to break the range with volume instead of entering while it stays trapped in the middle.
Key Levels
Resistance: 127.25, 128, 129, 130, 132.28, 133, 135, 140
Support: 126, 125.75, 125, 124.80, 120, 116, 115, 106.37
GEX Positioning
The GEX chart shows 125 as the main high-volume level and near-term support.
PLTR is currently trading just above this area, so 125 may act as a magnet and keep price pinned until buyers or sellers create enough volume to break away from it.
The first upside GEX level is around 127, followed by 129 and 130.
The 130 level appears to be the most important nearby call wall. That means PLTR could struggle or slow down near 130 unless buyers come in with strong volume.
Above 130, the next upside GEX levels are 133, 135 and 140.
On the downside, 120 is the main put wall and the most important bearish target if 125 fails.
Below 120, the next put levels are around 116 and 115.
The GEX structure suggests PLTR may stay inside the 125–130 range until a catalyst forces a larger move.
Bullish Scenario
For the bullish setup, I want PLTR to hold above 125 and reclaim 127.25–128.
A 15-minute close above 128 would give buyers a better chance of pushing into 129 and 130.
The stronger confirmation would be a break above 130 followed by a successful retest.
Above 130, I will watch 132.28, 133, 135 and then 140.
If PLTR can break and hold above 140, the daily chart would have more room to recover toward the larger 162–166 resistance zone.
Bearish Scenario
For the bearish setup, I will watch for rejection around 127.25–130.
If PLTR continues failing below this area and then loses 125, the short-term structure would weaken.
A confirmed 15-minute close below 125 could open the move toward 124 and then the major 120 put wall.
If 120 fails, the next downside targets would be 116 and 115.
A larger breakdown below 115 could eventually bring the previous daily low around 106.37 back into play.
Trade Considerations
PLTR is currently sitting near the middle of the 125–130 GEX range, so this could remain choppy until price clearly breaks one side.
For calls, I want to see PLTR reclaim 127.25–128, then confirm above 130.
For puts, I want to see rejection from resistance followed by a clean loss of 125.
I would also watch the opening range and VWAP. A breakout without volume could quickly fail because the GEX levels are positioned close together.
Options Outlook
The chart shows IV Rank around 59 and average implied volatility near 65.6, so options premium is already elevated.
Because of that, I would avoid chasing contracts while PLTR remains stuck between 125 and 130.
The cleaner opportunity may come after price breaks the range and confirms direction with a retest.
Conclusion
PLTR is trying to build a base, but buyers still need to reclaim 129–130 before the chart becomes more bullish.
Above 130, I will watch 132.28, 133, 135 and 140.
Below 125, I will watch 120, 116 and 115.
The main decision zone this week is 125–130. A clean break from this range could create the next strong trading opportunity.
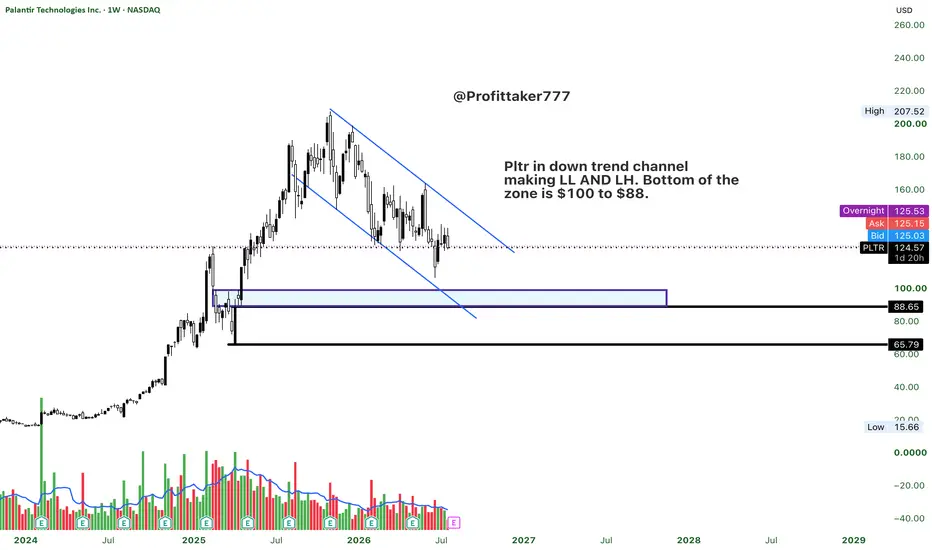
Palantir (PLTR) more downside. "Palantir isn't broken fundamentally—but technically it's still trapped in a bearish channel. Until buyers reclaim the upper trendline, every rally looks like a lower high. The chart is pointing toward one final flush into the $90 support zone, where risk-reward could become much more attractive for long-term investors.
$SPY Short-Term (less than two week) AnalysisCurrent Technical Picture
The latest session traded:
High: ~$747.25
Current: ~$743.30
Low: ~$740.83
This tells me buyers were unable to hold above $747, but they also defended the low-$740s.
Probability Assessment (1 Week)
Assuming no major macro shock outside earnings:
Retest of $747.27: ≈70–75%
This is only about 0.5% above the current price and is well within a normal weekly range.
Retest of $750: ≈50–60%
This would likely require at least one strong earnings reaction from a major tech company.
Break and hold above $750: ≈35–40%
Markets often need multiple positive catalysts to sustain a breakout beyond an established high.
Pullback to the 38.2% Fib (~$738.50): ≈45%
A common retracement if earnings are mixed.
What I'd Watch
The strongest bullish signal would be:
Price holds above the 23.6% Fib (~$743).
The 9 EMA remains above the 21 EMA.
Volume expands on moves through $747.25.
If those conditions occur, a move toward $750–752 becomes much more likely.
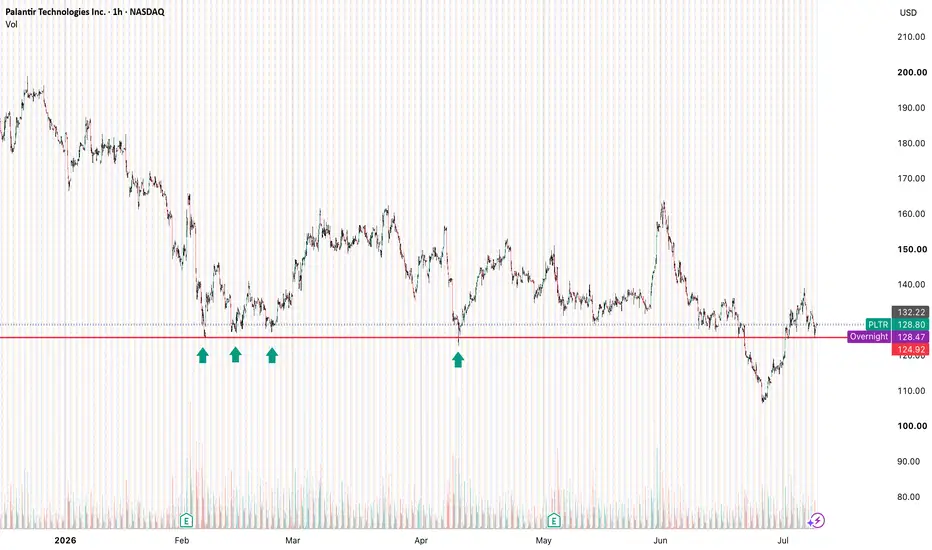
$124.92 Long on $PLTR - Basic Support and Demand Levels ]
I Love $124.92 on NASDAQ:PLTR for a small upside move.
I've been keeping it super simple lately, looking for solid, repetitive support levels to long off of for a 20 - 30% gain, then selling my position.
I don't know about you, but an extra 200-300$ a day with single contract positions goes a long way for me.
*not financial advice.
Are you long Palantir? Today members received a buy signal for PLTR.
Palantir back tested the 7/20 moving average bullish crossover.
This is exactly what you need to see if price action is likely to trend higher.
Buying the tap of the 7MA now allows us to ride an upward trend reversal with a tight stoploss if we lose the shorter term moving averages.
This signal comes at a time where semiconductors have seen sell side pressure which means there lots of liquidity available for potential rotation.
PLTR - Wedge Breakout Confirmed — Can Momentum Continue?PLTR has confirmed a breakout from a wedge-shaped volatility contraction pattern following a strong prior impulse move. The most recent daily close finished above the breakout level, providing initial confirmation that buyers are attempting to regain control after several months of consolidation.
One aspect I find interesting is that the breakout is occurring while fundamentals remain exceptionally strong. Recent quarters have shown accelerating EPS growth, accelerating revenue growth, and expanding margins, while investor sentiment around the company's AI positioning continues to remain highly bullish.
That said, the setup is not without risks. During the consolidation phase, several bearish swing legs displayed greater momentum and volume than the corresponding bullish advances, suggesting that sellers were still active beneath the surface. Because of that, I would like to see continued acceptance above the breakout level and expanding volume to confirm that demand is truly taking control.
Rather than chasing extended price action, I will be watching the AVWAP anchored from the start of the prior impulse move for potential pullback opportunities and lower-risk entries if the stock continues to behave constructively.
Bullish thesis:
• Confirmed wedge breakout
• Strong prior impulse and momentum structure
• Accelerating EPS and revenue growth
• Expanding margins
• Strong investor sentiment and AI narrative
Warning signs:
• Bearish legs within the pattern showed stronger momentum and volume
• Breakout still requires follow-through confirmation
• Failure to maintain acceptance above the breakout level would weaken the setup
The thesis remains bullish as long as PLTR can hold above the breakout area and continue showing constructive price action. A rejection back into the pattern or failure of volume to expand would increase the probability of a failed breakout and warrant a more cautious stance.
Palantir Alert: PLTR Breaches Key Structural Support Line## Market Structure & Pattern
* **Pattern:** The daily chart highlights a mature **Bearish Pennant** consolidation pattern that has been tightly compressing price action on the 1-Day timeframe.
* **Current Trend:** PLTR is currently trading at **$129.30**, having cleanly broken downward through the lower ascending support trendline of the pennant structure.
* **Volume & Bias:** The pattern bias is explicitly **Bearish**. The recent downside contraction phase is giving way to a new expansion leg, shifting near-term momentum heavily in favor of the sellers as it breaks out of the consolidation squeeze.
---
## Trade Setup & Key Levels
The structural breakdown sets up a mathematically optimized short position engineered to track the accelerating downside momentum:
* **Current Price:** $129.30
* **Bearish Trigger (Entry Zone):** **$128.78** (The key structural pivot validating the breakdown sequence)
* **Stop Loss (SL):** **$137.72** (Placed safely above local consolidation resistance to safeguard capital against an invalid tech squeeze)
* **Risk/Reward Ratio:** **4.0**
### Take Profit Target
* **Main Pattern Target:** **$93.01** (Calculated by projecting the full vertical height of the initial pennant "pole" downward from the breakout point, aligning perfectly with major historical demand shelves)
---
## Trading Strategy & Outlook
> **Execution Note:** PLTR has structurally triggered the bearish continuation sequence by cracking the pennant floor. To ensure maximum execution precision, monitor the **$128.78** level closely. A sustained daily close below this pivot confirms that the breakdown is locked in, clearing a direct path down toward the macro **$93.01** target zone. Look to manage risk tightly at the local structural invalidation level if any temporary dead-cat bounces occur.
PLTR | July Q3 2026 | Day ChartPalantir Technologies Inc. ||
MARKET-BEATING SCORE: 7/10
-----------------------------------
PLTR EPS growth 84.13% — above-market growth rate, typically outperforms the broad index.
PLTR revenue growing 85.00% YoY — strong top-line supports market-beating returns.
PLTR gross margin 84.10% — strong moat, characteristic of long-run market beaters.
PLTR FCF $2,688.00M positive — real cash generation, the #1 long-run predictor of market outperformance.
PLTR D/E ratio 0.03 — conservative leverage, balance sheet resilience favors outperformance.
----------------------------------
Multiple Time-Frame Analysis; Color Code | Strength favors the higher timeframe.
Yearly timeframe = black
Monthly timeframe = pink
weekly = grey
daily = red
4hr = orange
1hr = yellow
15min = blue
5min = green if they are shown. (Level visibility on intervals is set to timeframe the level was found on and below to keep chart view organized.)
** Candle Science explained **
A Range = two or more consecutive color candles.
There are two types of ranges - accumulation and distribution.
DISTRIBUTION RANGES DEFINED: BackSide (BS) Candle - First distribution candle in a distribution range. Expectation = strong reaction to price. long wicks reaching to or away from level.
FrontSide (FS) Candle - Last distribution candle in a distribution range. Expectation = reversal, create a trend in the opposite direction. Distribution candles are used as support.
ACCUMULATION RANGES DEFINED:
Inverse BS (Inv.BS) - First Accumulation candle in an accumulation range. Expectation. = strong reaction to price. long wicks reaching to or away from level.
Inverse FS (Inv.FS) - Last accumulation candle in an accumulation range. Expectation = reversal, create a trend in the opposite direction. Accumulation candles are used as resistance.
Palantir Technologies, Inc (PLTR): Breakout, More Price Drop!Palantir Technologies Inc. (PLTR) is hovering between $112-$118 today, trading significantly below it's late 2025 highs. The recent dip stems from broader tech sector sell-offs and valuation concerns, but the stocks has received a boost from high profile AI partnership and new enterprise contracts.
Technical outlook:
Stock recently broke below the horizontal support level, after a couple months of consolidation and range. Price is currently making a retest of breakout, in respect of the structure. We anticipate a bearish pullback within $118-$122, area.
Key point:
A confirmed retracement at this zone, activates a sell continuation down to $90.25, as next potential bearish.
Thanks for reading.