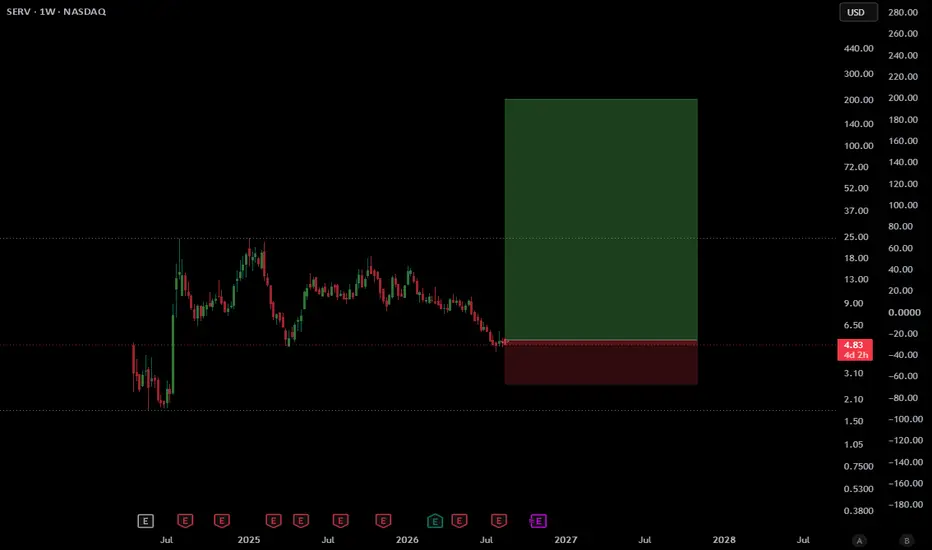
$SERV , Setup IdeaENTRY : CMP
TP1 : **
TP2 : **
TP3 : **
TP4 : **
SL : If you wish
** FULL SETUP AVAILABLE**
My SL is never a SELL, just an alarm to stop adding money and wait for better dca
Follow, Boost, Join, Thank You !
Financial Disclaimer:
This post is not financial advice. I am not your financial advisor, your life coach, or your legally responsible adult.
Always do your own research and never trade based solely on internet comedy
Serve Robotics Inc.
No trades
No trades
In-depth trading ideas
Serve Consolidating + Bull PumpFirst good earnings report for Serv.
Product is already in use.
Chart:
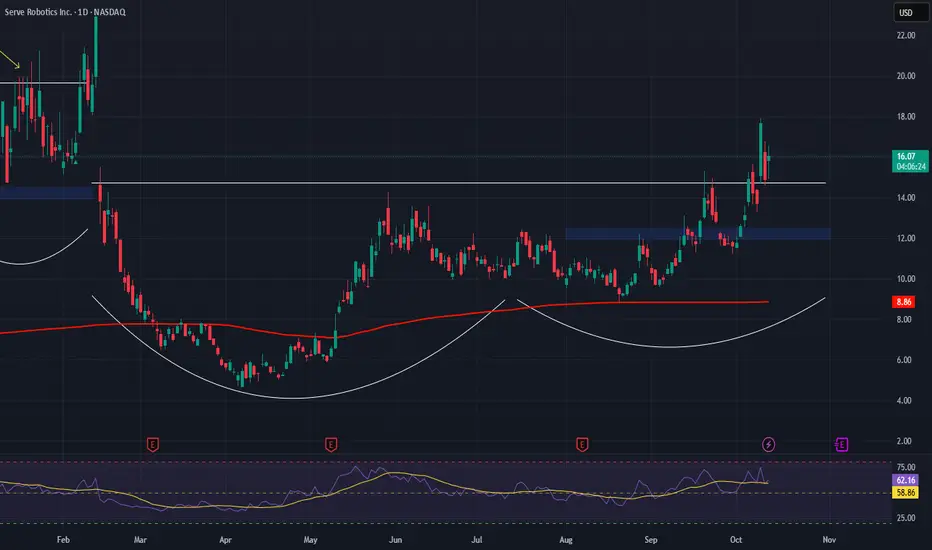
Macro consolidation. Support has been swept on the weekly and reclaimed.
Wider market conditions: small to mid cap assets in the tech sector are expected to trend this year, as the large caps slowly distribute (their bull has ended) see Nivida compared to AMD right now.
Capital rotation is at play.
SERV should run the highs of the macro channel this year, all been well. That’s what the chart says and if fundamentals continue to grow, it should happen.
Sub 1billion marketcap. So potential for huge upside over the next decade.
Moment of Truth for $SERVI really like SERV. Both as a stock and as a company. My 1 year price target is a whopping 100% above the current price at $17.
Since it's IPO it has been coiling like crazy. It's been consistently posting lower highs and higher lows. The upper trendline has been hit 4 times, and the lower trendline was just hit for the 3rd time.
If the stock can bounce here, it's a bit of a bullish scenario. If it doesn't, this triangle could break down and we could be in for some pain.
It's one of those "could go either way" scenarios.
Either way, when a stock coils like this so much it usually leads to pretty aggressive price action. Especially when the volume forms a massive node right at the POC and not a whole lot of volume above of below it.
The thing that has me "bullish" on this is the bullish divergence on the rsi chart.
I'm actually already in on this position as I had $9-stike put get assigned. So we're in this whether we like it or not!
My average is $8.87.
My targets are:
Stop Loss = $7 (although I'll look to get back in around $6)
Target 1 = $11.50 (or upper trendline touch, whichever comes first)
Target 2 = $14
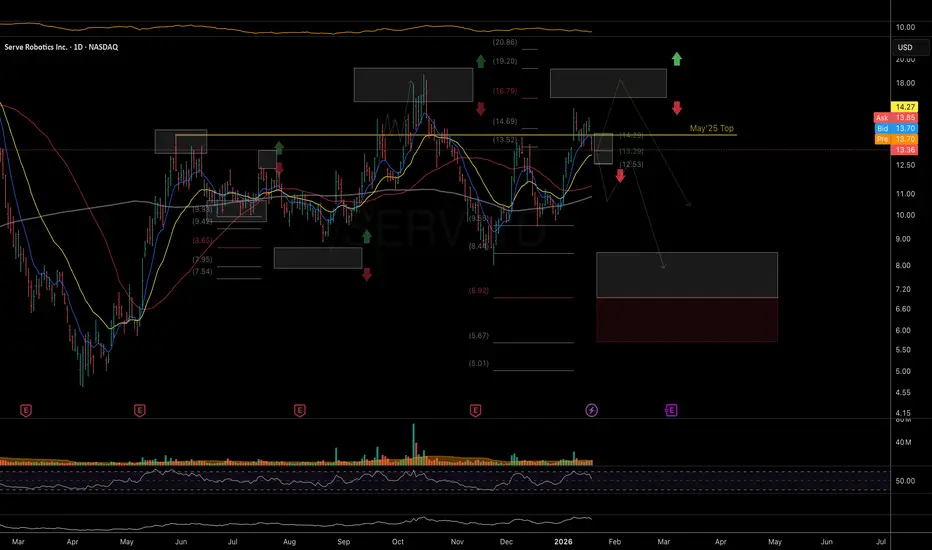
$SERV: trend structure analysis I like the monthly consolidation structure from a macro-bullish perspective. However, on the short-term, I cannot rule out that the complex consolidation has not yet fully resolved. Price may have already formed a lower high and entered the early stages of a new downside wave toward macro support, or it could still attempt a re-test of the October highs, potentially forming a double top.
In the short term, as long as price is holding above the 12.50 local support, I can see an attempt for further upside toward the 16.70–19.20 resistance zone. A break below 12.50 would shift the odds toward a deeper pullback into the 8.50–6.90 mid-term support area.
From a mid-term perspective, as long as price is closing below the 16.70–19.20 resistance zone, I consider a deeper pullback to remain the operative scenario.
Chart:
Previously:
• On support and bullish potential (Aug 18):
www.tradingview.com
• On trend reversal (Aug 27):
www.tradingview.com
• On upside potential (Sep 18):
www.tradingview.com
Bullish on SERVI really really like this set up for SERV. I feel there is a lot of positive momentum in robotics for 2026. SERV was a favorite pick on MSNBC and there is simply lots of positive energy and hype around this sector, in particular service robotics, which is the first leg of our journey into humanoid walking and talking TESLA robots. A few scenarios posted, but I think bullish is more likely. What can go wrong. Immediate down side risk about 8%, which I think the bulls will come back in, but it could trend lower to test lower lows at $8 if momentum severely shifts negative. It would take a lot of bad news for this too happen in my opinion. Charts looking good, volume is in, fundamentals improving. Among all the robotics fundamentals SERV looks pretty good compared. A solid place to build a position at the ground floors in something amazing.
$SERV - Growth Potential Amid Financial Headwinds and TechnicalNASDAQ:SERV is a high-growth, early-stage robotics company focused on autonomous delivery. While it shows strong revenue growth and low debt, it is currently unprofitable with very high negative margins and significant cash burn.
Technically, the stock is in a bullish trend; however, recent volatility and dilution from equity offerings warrant caution. Based on the weekly chart and Fibonacci levels, a major resistance lies at $16.80 , a breakout above this level could trigger further upward movement toward previous highs.
On the downside, key support is seen at $14.50.
This is not a recommendation to buy or sell.
Why Did The Market Bounce Today? Today the market bounced for 2 reasons....
1. Broadcom NASDAQ:AVGO received news of another OPENAI partnership. This multi year billion dollar deal caused the stock to bounce double digits. When this name rallies it causes liquidity to flow into the $SOXX. Semiconductors are still the heartbeat of this market and have propped everything up today.
The OPENAI headline seems to be running out of steam as the last 3 partnership announcements caused 3 stock to make new highs but AVGO did not take out its highs. This will be on watch.
2. The bond market was closed today allowing investors to not have to worry about catalysts or yields. There's an old saying on "when the cats away, the mice will play" .
The bond market is the much larger investment market aka the "cat" and this liquidity has clearly spilled over into smaller cap higher beta stocks.
Tomorrow we will see if the markets can take out the 20 day Moving average or if this pop gets sold into.
Serve Robotics Inc. (NASDAQ: SERV) – Bullish Setup EmergingServe Robotics NASDAQ:SERV is revolutionizing last-mile logistics with AI-powered delivery robots, offering strong exposure to the booming robotics and automation sector. The company's recent momentum and strategic partnerships signal major upside potential.
🔍 Key Drivers:
📈 Explosive Growth:
Q2 2025 revenue up 46% YoY
Deliveries jumped 80% QoQ
Clear signs of scaling and market demand
🤝 Uber Eats Partnership:
Multi-year deal to deploy 2,000 Gen3 robots in U.S. cities, including Chicago
Unlocks access to the projected $160B autonomous food delivery market by 2030
🌍 Long-Term Outlook:
Tied to ARK Invest’s $860B global robotics forecast
Targeting $60–80M annualized revenue once fully scaled
💰 Backed by Giants:
Supported by Uber and Nvidia
$167M raised in 2024 to fund expansion and AI development
📊 Trade Setup:
Bullish above: $12.00–$12.50
Upside target: $23.00–$24.00
Trend outlook: Strong momentum, backed by fundamentals and market demand
SERVE Robotics (NASDAQ: SERV) – Ichimoku-Based Trade SetupSERVE Robotics (NASDAQ: SERV) – Ichimoku-Based Trade Setup
Ticker: SERV
Exchange: NASDAQ
Chart: 1D Heikin Ashi with Ichimoku Cloud, Pivot Points, and Risk/Reward setup
Trade Idea: Long position targeting 17.84 (+34.5%) with stop at 11.23 (–13.9%)
Risk/Reward Ratio: 2.48
Technical Analysis (Ichimoku Focus)
Price has reclaimed the top of the Ichimoku cloud, confirming a bullish Kumo breakout. The Senkou Span A is angled upward, signaling improving short-term momentum after a multi-month consolidation.
The Tenkan-sen (conversion line) has crossed above the Kijun-sen (base line), generating a strong bullish signal above the cloud. The Chikou Span (lagging line) has also cleared price action, confirming trend continuation.
Support levels are seen at 12.00–12.30 (Kijun support) and 10.80 (bottom of the cloud and S1 zone). Resistance levels are near 13.85 (R1 pivot) and 17.84 (R2 target).
Volume has been rising during the recent breakout, suggesting renewed institutional participation. With the range between 11–13 resolving upward, the technical structure favors continuation rather than rejection.
Fundamental Overview
Serve Robotics, a spinout of Uber’s autonomous delivery division, continues expanding its partnerships with Uber Eats and other delivery platforms. The company is actively deploying autonomous sidewalk delivery robots across multiple U.S. cities.
Recent financials show improved revenue growth and cost efficiency per delivery, with losses narrowing quarter over quarter. Key catalysts include continued Uber Eats integration, expansion of the robot fleet, and increased investor interest in AI-driven logistics and robotics infrastructure.
Summary
SERV is positioned in a textbook Ichimoku breakout zone. Technical signals—cloud breakout, bullish Tenkan/Kijun cross, and confirmed Chikou alignment—are supported by strong fundamental momentum in the autonomous robotics sector.
If current support holds, the technical target remains 17.80–18.00 with a favorable risk/reward setup around 2.5:1.
SERV ( Serve Robotics Inc ) - Stock ... looking JUICY !!!Talked about this on todays Live Stream
Broke out of side ways accumulation
VERY nice retrace then broke resistance level
to come back to retest and break out of zone
- Would like to see a 9% - 10% pull back
before the upside continuation
Instructions on chart
NFA - Not Financial Advice
Join the Streams for Free Mentorship
$SERV Weekend Analysis - October 5th, 2025NASDAQ:SERV is setting up for what could be a pretty solid 25–35% move if the pattern plays out. We’ve got a clean ascending triangle forming, with price currently testing resistance around $13.56. For the next leg up, I’d want to see that level flipped into support.
If we get continuation and price pushes through $15.39 and holds above it, things get interesting - there’s a big price gap up to around $19.93, and that gap-fill alone could offer a straightforward 22–25% upside from there.
On the downside, I’m keeping an eye on key supports at $12.06 (volume shelf area) and then $11.05, which lines up with the 50-day SMA. Entries around current levels or near those supports still look decent risk/reward-wise. But if we see a daily close below $11.05, that would invalidate the setup for me.
From a technical indicator standpoint, the MACD is shaping up for a potential bullish crossover, which adds weight to the bullish thesis.
Overall, I like this setup - but I want to see $13.6 flip into solid support before getting too aggressive.
SERV | Informative NASDAQ:SERV
--Trend Context:
After a brutal selloff earlier this year, SERV formed a rounded base and is now in an emerging uptrend of higher lows (HL) and higher highs (HH). Price is pressing into a major descending trendline from prior peaks, a spot where big money decides direction.
--Red Line (EMA 100):
Recently reclaimed with strength → signals buyers have regained control.
EMA 100 now acting as dynamic support around ~$11.97.
Volume Profile (Right side histogram):
Heavy volume node at $11.97 → $13.25 → this is the “control zone” where price has memory and institutions transact.
Above $15.50 → volume gap → thin liquidity = if broken, price can accelerate rapidly to $23+.
--------------------------------------------------------------------------
--Levels of Interest
//Immediate Resistance:
$13.25 (current battle zone) – price is consolidating here.
$15.52 – critical breakout level → above this, momentum ignites.
//Major Resistance:
$23.97 – previous peak and volume shelf top.
//Support Zones:
$11.97 → EMA 100 + high-volume node = strong support.
$10.71 → backup support.
$8.14 → deep invalidation (trend failure if broken).
--------------------------------------------------------------------------
--Market Psychology
Sellers controlled from the highs near $24 → cascade of lower highs (LHs) until summer.
But now, buyers are showing aggression with a sequence of HLs, driving price back into resistance.
Volume profile shows the “smart money” zone around $12–13. If price holds above it, it signals institutional accumulation.
--------------------------------------------------------------------------
--Probability Outlook
//Bullish Breakout (Primary Bias):
If SERV clears $15.52 with strong volume → expect momentum run toward $18 → $23.97.
Thin volume above $15.5 means price can move fast, with fewer obstacles.
//Bearish Rejection (Secondary Bias):
Failure at $13.25–15.5 zone → pullback to $11.97.
If $11.97 breaks, $10.71 becomes the line in the sand.
--------------------------------------------------------------------------
--Strategic Positioning
//For Traders:
Entry: On breakout close > $15.52.
Stop: Below $11.97 (EMA 100 and HVN cluster).
Targets: $18 → $23.97.
R:R ~1:4 (excellent setup).
//For Swing Players:
Accumulate dips near $12–13 if defended.
Risk only below $10.71.
Potential to ride multi-week breakout leg.
--------------------------------------------------------------------------
This chart is a classic coil before eruption. You have a tight range inside a larger descending wedge, reclaim of EMA 100, and building HLs → textbook accumulation pattern.
Institutions are loading in the $12–13 zone. If SERV takes out $15.5 with conviction, it’s not just a breakout—it’s a sentiment shift that could unleash a rally back to $23+, a near 70% upside move.
But discipline rules: if it loses $11.97, you step aside and let it reset.
SERV LONGSERV – Massive Breakout Setup w/ Short Squeeze Potential
Serve Robotics is breaking out of a multi-month ascending triangle on explosive volume, confirming accumulation off the low-volume node. The move is backed by institutional-grade volume, with multiple green volume spikes indicating heavy interest following a 197% move off the 52W low. RSI is trending above 70, but this is a strength breakout, not exhaustion.
Price cleared the $13–14 range decisively, with next key level at $15.31. A close above that opens the door to $29.95 (Fib extension targets). Fundamentals remain speculative, but short float sits at 27.67%, and the Phantom Auto acquisition adds low-latency teleoperation tech to its AI fleet. Liquidity is strong (Quick Ratio 32.79), and analysts (Cantor) reaffirmed a $17 price target.
$SERV Weekend analysis - 21st September, 2025Strong week for NASDAQ:SERV , closing right into that $15.3 resistance zone. If it cools off, I’m eyeing $12.06 as the key support - it lines up with both the volume shelf and 9D EMA. As long as that holds, I think we could just be setting up a nice range trade between $12 and $15.3.
But here’s the bigger picture: if NASDAQ:SERV can actually close above $15.34 and flip that level into support, there’s a clean volume gap up to $20. That area usually acts like a vacuum, so the move could come quick. On the flip side, a close under $11.4 would kill this setup for me and I’d revisit the chart.
FlagA company specializing in robots for public venues is gearing up for a massive breakout. The integration of AI into these robots is set to define the future.
The price has been forming a textbook bull flag for several weeks and could easily deliver a +100% surge upon breakout.
For added confirmation, wait for a close above $12.20. Due to high volatility, it's advisable to protect the position with a stop loss.
Additionally, there's a large gap up to $19.42, which can be considered the first target.
Multi-Bull Signal Presence | ABCD Setup in PlayBullish on SERV:
After a strong run-up, SERV has been consistently respecting Fibonacci levels of support and resistance, showing that traders and algos alike are honoring these zones. This makes the levels even more reliable for future moves.
Currently, the 50 MA and 200 MA are converging, which often signals a period of consolidation before the next impulsive leg. Rather than being a sign of weakness, this kind of compression can be the “calm before the storm,” giving the stock time to reset and build energy for the next breakout.
That consolidation phase fits perfectly as the B → C leg in an emerging ABCD pattern. The white dotted projection on my chart outlines the potential C → D leg, which is often the strongest run in the sequence. This aligns with my bullish claim that SERV is preparing for another measured move higher.
Main Key Levels & Bullish Setup:
Price has respected multiple Fibonacci zones, with special weight given to the 0.66 faded red support, which has acted as a reliable floor.
The green long-term trendline support continues to provide structure for the move, holding strong since mid-2024.
Consolidation is occurring above key supports, suggesting accumulation rather than distribution.
ABCD pattern symmetry points toward a measured leg higher, aligning with both Fib extensions and prior rally magnitude.
🎯 Price Target: $24
If this setup plays out, SERV has room to run toward $24, which would mark a long-term triple top. A level, if broken, could unlock even greater upside. Until then, this is the clearest technical destination based on the current structure.
----------------------------------------------------------------------------------------------------------------------
TL;DR
I’m bullish here. SERV is showing textbook consolidation at strong supports, with moving average compression + ABCD symmetry + Fib alignment all supporting the idea of another impulsive move up.
I’ll be watching closely for confirmation off the green trendline + .66 Fib zone before scaling in heavier, but the risk/reward here is very favorable given the projected upside.
__________________________________________________________________________________
All love and best of luck, traders
Safe Entry Zones SERVStock Movement Ranging.
Stock between strong resistance and support level of 4h zones both are significate selling and buying zones. in case breaking-down it will Down-Movement Stock and vice versa.
Note: 1- Potentional of Strong Buying Zone:
We have two scenarios must happen at The Mentioned Zone:
Scenarios One: strong buying volume with reversal Candle.
Scenarios Two: Fake Break-Out of The Buying Zone.
Both indicate buyers stepping in strongly. NEVER Join in unless one showed up.
2- How to Buy Stock:
On 15M TF when Marubozu Candle show up which indicate strong buyers stepping-in.
Buy on 0.5 Fibo Level of the Marubozu Candle, because price will always and always re-test the imbalance.