SMCI Resistance (or Support), Rejection, and NegotiationYesterday around 4 AM, I posted:
“Is SMCI in the Early Stages of Another Short Squeeze?”
At the time, SMCI was trading around $37.
Since then, price pushed into the $41 area, and now we are at the exact type of decision point that matters more to me than the move that got us here.
This chart is a good example of three concepts I use a lot:
Resistance
Rejection
Negotiation
First, resistance formed.
Then price came back up, interacted with that area again, and was rejected.
That second interaction helped define the descending trendline we are now watching.
From there, a few things could have happened the next time price came back into that level:
It could reject again.
It could break straight through.
Or it could negotiate around the level.
This time, it negotiated.
That matters.
A negotiation is when price spends several candles interacting around the same area instead of immediately being pushed away.
It does not tell you whether the final outcome will be bullish or bearish.
Negotiation can still end in:
a breakout
or
a rejection
What it does give you is time.
Time to assess.
Time to look at volume.
Time to look at the broader market.
Time to determine whether buyers are actually gaining control or whether sellers are simply absorbing the move before another rejection.
That is why I like negotiations much more than trying to guess a one- or two-candle rejection.
Rejections can offer high reward, but they are also high risk because the decision happens quickly.
Negotiation gives you more information.
And right now, that is exactly what I think SMCI is giving us.
My current assessment is simple:
If the broader market begins to recover, I think SMCI has a strong chance of recovering with it.
If buyers can eventually establish acceptance above this trendline, the original short-squeeze thesis remains alive.
But that is not the only bullish outcome.
This could also simply evolve into standard bullish continuation:
break resistance → establish support → continue higher
That would still be constructive even without a violent squeeze.
And one important point:
I removed the bearish rejection path from the current map.
I did not remove bearish rejection from the list of possibilities.
SMCI is still sitting at a major decision area.
If the broader market weakens, buyers fail to hold reclaimed structure, and this negotiation resolves lower, the picture can turn bearish very quickly.
That is the entire point of mapping the possibilities before they happen.
I do not need to know exactly which path wins.
I need to understand what each behavior means when it shows up.
Right now:
Resistance formed.
Rejection confirmed it.
Negotiation is testing it.
Now we wait to see who wins.
SSS
Super Micro Computer, Inc. - Depositary Shares Each Representing a 1/20th Interest in a Share of 7% Series A Mandatory Convertible Preferred Stock
No trades
No trades
In-depth trading ideas
Is SMCI in the Early Stages of Another Short Squeeze?SMCI is one of those stocks where the chart can look boring right up until it suddenly isn’t.
After zooming out, I think there is a legitimate argument that SMCI may be entering the early stages of another squeeze-type setup.
I want to be careful with the wording there.
I am not saying a short squeeze is guaranteed.
I am saying the combination of structure + short interest + possible catalysts is interesting enough that I think the setup deserves real attention.
The structure is what caught my eye first
On the larger daily chart, SMCI has spent months building a broad base.
Below current price, HDTL shows a dense cluster of projected AOAs around:
$27
$28
$30
$31
$32
$34
That is a lot of historical agreement underneath price.
Above current price?
The structure gets much thinner.
The next areas I care about are roughly:
$37–$38
$40
$45
$52
And that is where this starts getting interesting.
The $45 area is not just some random upside target I drew on the chart.
It lines up with the next major Projected AOA and also gets into the neighborhood of the larger descending trendline.
So if SMCI can reclaim $38, then build acceptance over $40, I think the market starts opening the door toward $45. And if $45 eventually breaks with real participation? Then the structure above gets even more interesting.
Now add the short interest
This is where the squeeze discussion comes in. As of the latest reported data, roughly 93.4 million SMCI shares were sold short, representing around 17%–19% of the float depending on the float calculation used. Short interest had also increased from the prior reporting period. That is meaningful. It does not mean shorts are automatically trapped. It does mean there is a large pool of potential future buyers if price starts moving against them. That is how I think about short interest, It is fuel. It is not the ignition. Something still has to force those positions to reconsider.
And that brings us to catalysts.
What could provide the ignition?
There are several possibilities.
Supermicro entered fiscal 2027 with record backlog and said it received more than $60 billion in new orders during the fourth quarter of fiscal 2026.
The company is also guiding fiscal 2027 revenue to roughly $65B–$72B, well above where Wall Street expectations had been sitting before that forecast.
That matters because the fundamental debate around SMCI is not whether AI infrastructure demand exists.
It clearly does.
The debate is whether SMCI can convert that demand into sustainable revenue growth and acceptable margins.
The company is heavily exposed to the AI infrastructure cycle through systems built around NVIDIA Blackwell and Blackwell Ultra, with liquid-cooled rack-scale deployments becoming increasingly important.
NVIDIA itself says Blackwell continues to represent the majority of its system shipments while Vera Rubin has begun production shipments, with demand remaining strong enough that supply constraints are still an issue.
That gives SMCI several possible catalysts:
AI infrastructure demand remains stronger than feared
large customer/order announcements
better-than-expected margins
continued backlog conversion
strong Blackwell / Rubin deployment commentary
analyst upgrades or target increases
another strong earnings reaction
a broader AI infrastructure rally
And then there is the technical catalyst:
price itself.
Sometimes the catalyst for a squeeze is simply crossing the level everyone thought would hold.
The three scenarios I’m watching
🔵 BLUE 45%
This is currently my highest-weighted scenario.
SMCI reclaims $38, begins building acceptance above $40, and buyers start pressing into the thinner structure above.
If that happens while volume expands, I think $45 becomes a very realistic decision area.
And this is where the short interest becomes important.
If price starts approaching $45 while the fundamental narrative is simultaneously improving, some shorts may decide they no longer want to wait around and see what happens.
That covering can add fuel to an already advancing move.
And if SMCI eventually clears $45 + the larger descending trendline, I would start looking toward the next larger structural area around $52.
That is the setup where the words short squeeze start becoming much more interesting.
🟢 GREEN 35%
Still bullish.
Just slower.
SMCI repairs gradually:
$38 → $40 → consolidation → $45
Instead of a violent squeeze, we get a healthier grind higher.
Honestly, this might be the better long-term outcome.
It allows structure to develop and gives price time to prove that buyers are actually accepting higher valuations rather than just chasing momentum.
Shorts may still cover along the way, but it is controlled rather than explosive.
🔴 RED 20%
The bullish thesis weakens considerably if SMCI loses $34 and starts accepting back into the dense $30–$32 AOA cluster.
That would tell me the recent move was probably just another failed repair.
And this is important:
High short interest does not protect a stock from going down.
A company can remain heavily shorted for a very long time if the bearish thesis remains intact.
That is why I will never look at 17%+ short interest and automatically say:
“Squeeze incoming.”
Price still has to prove it.
The biggest thing I am watching
Volume.
Yesterday SMCI gained about 3.4%, but volume was only around 31 million shares versus roughly 46 million average. That is not what I would call breakout participation.
So if Blue is really developing, I want to see that change.
A break through $38 / $40 accompanied by expanding participation would mean much more to me than price drifting through those levels on light volume.
Because the squeeze equation is really:
technical breakout
1. catalyst
2. expanding volume
3. large short base
= potential forced buying
Not:
lots of shorts = moon
Bottom line
Do I think SMCI is definitely beginning another short squeeze?
No.
Do I think the conditions exist for one to develop?
Absolutely.
The short interest is there.
The catalysts are there.
The AI infrastructure demand is there.
And most importantly:
the chart is approaching levels where the structure begins to open up.
That is why $38 → $40 → $45 matters so much to me.
If price earns those levels with real volume, this gets very interesting very quickly.
SMCI Follow-Up: The Bull Flag BrokeThis SMCI thesis has evolved in a way that I think is worth documenting because it shows exactly what I mean when I talk about preparation rather than prediction.
The original idea had nothing to do with a bull flag. On September 17, I published “Is SMCI in the Early Stages of Another Short Squeeze?” when price was around $37. The thesis was built around elevated short interest, improving price structure, and the possibility that shorts could eventually become fuel if SMCI started breaking important resistance.
The next day price had pushed into the $41 area and reached the long-term descending trendline I had been watching. That became a lesson in resistance, rejection and negotiation. I did not chase the initial move. I eventually entered Oct. 16 $40 Calls at $2.41 after price broke the shorter-term trend structure and gave me a setup I was comfortable owning.
Then the community made the thesis better.
After I was already in the position, my friend Alex pointed out something on the daily chart that immediately caught my attention: SMCI appeared to be building a bull flag remarkably similar to one that had formed earlier in the year. Both of us recognized the resemblance, and it added another layer to the existing thesis.
That contribution matters, and I want to give Alex proper credit for it. This is exactly what I want Heavy Diligence to become — people bringing ideas to the table, challenging each other, adding observations and improving the work together.
Today, I believe that newer bull-flag structure broke to the upside.
That is bullish.
It is also not the same thing as saying a short squeeze has started.
A breakout simply gives us another piece of evidence. Now SMCI has to hold the breakout, establish structure above the prior range, and continue forcing the market to reprice the stock higher.
This is where the short-interest component becomes particularly interesting.
A short squeeze does not necessarily need a brand-new company announcement to begin. Sometimes price itself becomes the catalyst.
Imagine a group of traders shorting SMCI because they believe resistance will hold. Price breaks resistance. Some shorts cover. Their covering requires buying shares, which pushes price higher. That move puts pressure on another group of shorts. Momentum traders begin noticing the breakout. Call activity can increase. Market makers may need to hedge some of that options exposure by purchasing stock.
The process can begin feeding itself:
Higher price → short covering → additional buying → higher price → more pressure on remaining shorts.
That is why I continue saying:
Short interest is fuel, not ignition.
A news catalyst can provide the ignition, but it isn't the only thing capable of doing it. A sufficiently strong technical breakout can eventually create its own catalyst by changing the risk equation for everyone positioned against the move.
But we are not entitled to assume that happens.
SMCI could break this bull flag and simply produce standard bullish continuation. That would be perfectly fine with me. I do not need some vertical squeeze into the stratosphere for this trade to succeed.
From here, the next major test remains the larger descending trendline that has been respected for roughly 18 months. If SMCI works its way into that area and rejects, we may simply have had a good bullish continuation trade into major resistance.
If price attacks that trendline, breaks it, and begins establishing structure above it while participation expands, then the short-squeeze thesis becomes significantly more interesting.
The larger bull-flag projection around the upper-$50s remains on the chart, but that is a technical projection, not a prediction or promised target. There are important areas between here and there, and every one of them has to be earned.
So the progression of this trade has been:
Short-interest thesis → resistance/negotiation → trend break and my call entry → Alex identifies the historical bull-flag fractal → new bull flag develops → today appears to break higher.
None of those observations individually guarantee what happens next.
Together, however, they give us a much better framework for recognizing what is happening if momentum continues building.
That is the difference between trying to predict a squeeze and being prepared if one begins.
And thank you again to Alex for spotting the bull-flag comparison and adding another valuable piece to this research. Collaboration like that is exactly the point of this project.
The bull flag appears to have broken. Now SMCI has to prove the breakout.
Is history about to repeat on SMCI? - Community IdeaOne of the best parts of this project has been the collaboration. A valuable member of the trading community recently gave me some feedback and pointed out a beautiful fractal developing on the daily chart, and it immediately stood out to me once I saw it. This is exactly the kind of collaboration I was hoping for when I started this journey. We are still early. The goal has never been for me to have all the answers. The goal is for us to work together, sharpen each other’s thinking, and continue building better tools and better trading ideas.
On the chart, what stands out is the similarity between the current daily structure and a prior bull flag continuation. In both cases, SMCI made an impulsive move higher, paused and consolidated in a tight range, then positioned itself for a potential continuation leg. I illustrated that earlier pattern on the chart because the current setup looks very similar. That does not mean price has to repeat history candle for candle, but it does mean there is a recognizable structure here worth respecting.
The larger backdrop matters too. SMCI is still trading beneath a well-respected descending trend line that has been in place for roughly 18 months. That trend line is not just another line on the chart. It is the critical area. If buyers can keep this daily bull flag intact and begin pushing into that zone with strength, the setup becomes much more interesting. A clean break could open the door to a larger continuation move, and the rough bull flag projection on my chart points toward the upper-50s if momentum really gets going.
That said, I am not pretending this is a low-risk setup. It is not. This is a smaller-sized, higher-risk swing for me, which is why I entered Oct 16 40C at 2.41 with only 5 contracts. I have talked about this before, but when I take these multiday options ideas I deliberately size down because the uncertainty is higher and the time component matters more. If this works, I will most likely look to exit into a critical level, ideally with a couple of weeks still left before expiration rather than trying to hold and squeeze every last dollar out of the contract.
For now, the bull flag is the main idea. If the structure continues to hold and price starts making progress toward that major trend line, I think this setup has a legitimate chance. If the flag fails, then the thesis weakens quickly and I will treat it that way. Either way, this is a great example of why collaboration matters. Sometimes another trader helps you see something that was sitting right in front of you the whole time.
This is just the start. We will keep working together, keep sharing ideas, and keep trying to build better tools and better trades.
Week 38 of 52 | SMCI $34–$38 Held—Now $42–$45 Is the TestIn our Week 33 update, we said NASDAQ:SMCI needed to reclaim and hold the $34–$38 area before we could call this a real change in structure.
That is what has happened.
After the August pullback, SMCI came back into the breakout zone several times and buyers defended it. The level that had been resistance is now acting as support, which is the development we needed to see.
The stock is now trading around $40, so the next important area is $42–$45. This is the first real test after the breakout. A clean move through that range would show that buyers are still in control and would put the larger $48–$52 resistance zone back on the table.
That said, SMCI is still a volatile name. It does not need to move straight up. A pullback into $35–$37 would be normal as long as that area continues to hold. The bullish structure weakens if the stock loses $35 and falls back into the prior range.
Levels I’m watching:
$35–$37 — Breakout support
$42–$45 — First resistance and next test
$48–$52 — Major resistance
Below $35 — Breakout starts to weaken
The setup is much better than it was in July. The $34–$38 reclaim was the first step. Now SMCI needs to prove it can get through $42–$45 before we start talking seriously about the larger resistance above.
Disclaimer: This is not financial advice. This analysis is for educational purposes only. Always do your own research and manage risk according to your own strategy.
SMCI GEX – Testing the Consolidation Ceiling at 42SMCI is tightening inside a sideways consolidation and is now testing the upper boundary of that range near 42. The current October 16 cumulative GEX profile places the dominant call wall at exactly the same level.
Strength across sector peers provides a supportive tape backdrop, but 42 remains the structural decision point. Price is near 40.95, above the 39 call-cluster boundary and well above the 36.5 HVL.
A clear break and hold above 42 would move SMCI into the positive extension zone, opening gamma squeeze potential toward 43 and then 45. Another rejection would keep the range intact and bring 39.5–39 back into focus.
🔶 Regime Context 🔶
SMCI remains above HVL in a positive GEX regime and is trading inside the call cluster between 39 and 42.
GEX History shows the 0, W1, M1, M2, and ALL rows aligned in positive gamma. This can support a more controlled volatility environment, but acceptance above 42 still requires price momentum.
🔶 Options Structure Context 🔶
👉 42 – C1 and consolidation ceiling
Confluence at 42:
C1 — dominant call wall
Ab1 — largest absolute gamma
COI / nCOI — strongest cumulative call open-interest concentration
AbOI — largest cumulative absolute open interest
CV / nCV — cumulative call-volume peak
This makes 42 a major multi-metric reaction zone in the October 16 cumulative profile, not simply a technical range boundary.
👉 43 – C3 , the next overhead call wall after a confirmed breakout
👉 45 – secondary positive NETGEX reference
🔶 Downside Structure 🔶
👉 39.5 – C2 , the first level to watch after a failed breakout
👉 39 – cTrans , the lower boundary of the call cluster
👉 36.5 – HVL / pTrans , the main regime pivot
👉 35 – P1 , the dominant put wall
🔶 Options Sentiment 🔶
CALL$ 93% at 60 DTE means equidistant call options are priced 93% higher than the corresponding puts. This reflects elevated call pricing skew, not a directional guarantee.
The Options Oscillator’s green histogram remains below its recent peak, suggesting that call pricing skew has been broadly fading despite staying elevated.
IVRank 24.2
IVx 74.2 (60 DTE)
CALL$ 93% (60 DTE) — call pricing skew
Implied move ±6.17% (±2.5)
🔶 Key Structure to Watch 🔶
42 — C1, multi-metric confluence and range ceiling
43–45 — first extension references after acceptance
39.5–39 — first support area after a failed breakout
36.5 — HVL and regime pivot
For now, SMCI is building pressure beneath its dominant call wall while sector strength remains supportive.
The key question is whether price can accept above 42 and enter extension—or reject once again into the established range.
SMCI: The server king returns. Cisco opens a second doorSuper Micro Computer NASDAQ:SMCI again looks far more interesting from a fundamental standpoint than the chart alone might suggest. After a prolonged downtrend, the stock is attempting to form a reversal structure, and price is now around $40.10. The main support zone sits in the $29 to $33 range. That remains the key area buyers must defend. Above, the first serious resistance zone is around $54.73 to $58.05. A breakout there could open the door to $68.05 and then $80.73. The all-time high is much higher, near $122.90, so the long-term potential remains significant if Supermicro truly transitions from recovery into a new sustainable uptrend.
And this is where the technical picture starts to be reinforced by fundamentals that look much stronger than the chart alone would imply. The company closed FY2026 with revenue of $39.1 billion versus $22.0 billion a year earlier. Net income came in at $2.2 billion, with EPS of $3.26 versus $1.68 a year earlier. The fourth quarter was especially strong: revenue reached $11.1 billion, net income $1.18 billion, and gross margin recovered to 17.5% from 9.9% in the prior quarter. That margin recovery is precisely the trigger the technical picture has begun to price in.
But the main fundamental catalyst is not even in the already published results. In Q4, Supermicro received more than $60 billion in new orders, after which the company reported a record backlog entering FY2027. Important: this is the volume of new orders to be shipped in future quarters, not guaranteed revenue for the next quarter. Management expects $65 to $72 billion in revenue for FY2027, which shows the scale of expectations from AI infrastructure. That order flow is what creates the fundamental backdrop allowing the current $29 to $33 support zone to be viewed as accumulation rather than a continuation of the decline.
And here comes Cisco. In August, Cisco announced the expansion of its Secure AI Factory with NVIDIA through a partnership with Supermicro. Cisco's ecosystem is adding Supermicro's high-density liquid and air-cooled systems, including rack-scale solutions for NVIDIA Vera Rubin NVL72 and HGX Rubin NVL8 . Cisco plans to begin offering Supermicro compute solutions as part of this platform starting in October 2026. This gives Supermicro an additional channel to large enterprise and cloud customers, and that could be the driver that helps price break through the $54.73 to $58.05 resistance zone.
At the same time, a key question about the quality of growth remains. At the end of FY2026, Supermicro had $7.5 billion in cash but also $8.7 billion in bank debt and convertible bonds. So calling the company free of financial risk would be wrong. The main task now is to ensure the huge flow of AI orders converts not only into revenue but also into sustainable margin and cash flow. Margin, cash flow, and the ability to scale production become the next key checkpoints, and they will determine whether the technical reversal is confirmed fundamentally.
Historical issues with auditing and corporate control should also not be presented as a current crisis. In 2024, EY left the company, after which Supermicro appointed BDO and conducted an independent review. The special committee found no grounds for a restatement of financial statements. Later, the company also conducted a separate review related to former employees and alleged export control violations. The review found no evidence that current management knew of the alleged scheme or that the company's financial statements were unreliable because of it. That backdrop removed part of the reputational pressure that weighed on the stock in 2024 and 2025, allowing the technical picture to begin forming a reversal structure.
MACD is also gradually changing character: the histogram and indicator lines show improving momentum after prolonged seller pressure. But while price remains below key resistance, it is premature to speak of a fully confirmed long-term reversal.
The main conflict for SMCI right now is simple: demand for AI infrastructure is huge, $60+ billion in new orders have already been received, Cisco is adding Supermicro to its AI infrastructure ecosystem, but the market wants to see how profitably the company can execute that volume.
If price can establish itself above resistance, the fundamental story gets additional confirmation from the chart. If the $29 to $33 support is lost, the entire current reversal structure will come under serious pressure.
This publication is for analytical purposes only and does not constitute individual investment advice. Technical levels are scenarios, not guarantees of price movement.
SMCI: news flow leaning bullish · No. 280
SMCI did not get one story today, it got several, and they do not all point the same way. Weighed against each other — new against old, and tracking which ones have already faded:
++ Google Goes Nuclear in Nordic Data Center Push - Industrial Info Resources
++ 3 US Grid Stocks Riding The Data Center Power Buildout - simplywall.st
+ Google eyes new data center project in New Mexico's Lea County - datacenters.economictimes.indiatimes.com
9 stories were weighed in this window; the 3 carrying the most weight are listed.
Net read: +++ leaning bullish — top of our scale.
What this is: a measure of which way the *news* is leaning right now — not a promise about price. A read being right and a read still being worth taking are two different things: once price has travelled a long way from where the read was published, it is stretched, and a lean that is stretched is a no-chase rather than an invitation.
Weight is not fixed either. A fresh headline lands, the balance tips, and the net read can flip inside an hour — that shift is the part worth watching, not the first print.
I will post an update under this idea once the market has had time to speak, either way.
(Informational only — not financial advice, not a signal.)
SMCI - Large correction with price consolidating From a high in Feb 2024 price has retraced 85% with a low in Nov 2024 which could be called a crash. Price has been choppy throughout 2025 despite the indices hitting all time highs. The stock retested the low in March this year before more choppy price action.
However price is now finding strong support above $40 and is above medium term anchored VWAP.
The safe trade would be to wait till $50 becomes support as this was rejected earlier this year due to internal company issues.
SMCI: Super Micro Computer Potential 872% long-term investmentMarket Overview
SMCI is trading around $40.93 after a prolonged correction from the 2024 high.
The weekly chart places price inside a larger Wave (iv) structure, while the 4H chart shows a smaller corrective sequence developing within it.
Fundamental / News Catalyst
The AI infrastructure backdrop remains strong. Supermicro reported $11.1B in Q4 FY2026 revenue, up from $5.8B a year earlier, and said it entered FY2027 with record backlog and more than $60B in new orders during Q4.
In June, Supermicro also announced financing to support roughly $39B of AI-server orders from more than 20 customers.
The broader AI-server market remains strong, with Dell recently raising its outlook on surging AI infrastructure demand.
Technical Analysis
The weekly structure shows SMCI developing a large Wave (iv) triangle following the major advance into 2024.
The key level above is $122.57. A sustained break would confirm further upside within the larger impulse.
On the 4H chart, price is developing another corrective sequence. The projected path allows for a move toward $51.34, followed by another pullback before a larger advance.
The shorter-term bullish count is invalidated below $23.31.
The larger weekly triangle is invalidated below $17.38.
Key Levels
$122.57 — Weekly bullish confirmation
$51.34 — 4H structural reference
$40.93 — Current price
$23.31 — 4H invalidation
$17.38 — Weekly triangle invalidation
Bullish Scenario
SMCI completes the current 4H correction, pushes through $51.34, and eventually breaks $122.57, confirming continuation of the larger bullish structure.
Bearish Scenario
A break below $23.31 invalidates the current 4H impulse count. A move below $17.38 would invalidate the larger weekly triangle.
Kap Waves Outlook
SMCI's fundamentals are strong, but the chart is still corrective.
The 4H structure needs to develop first. $23.31 protects the near-term count; $122.57 confirms the larger bullish structure.
SMCI preparing its A.I. Supercycle phase. Potential for $700.Super Micro Computer Inc. (SMCI) has been on a Bear Cycle under Lower Highs since its March 2024 All Time High (ATH). That succeeded a Major Expansion Phase that saw a multi-year parabolic rally reaching that ATH.
This is not the first time the market does that. In face every major rally of SMCI started after a period of prolonged Lower Highs, trading significantly below its 1M MA50 (blue trend-line), even 1M MA100 (green trend-line).
When its 1M RSI however started printing a formation like the one since 2025, then the market bottomed. With SMCI's first major rally era being called as its "Discovery Phase", we named the second its "Major Expansion" and right now after the current bottom formation plays out, it will initiate its "A.I. Supercycle Phase". Based on that it should aim above the 1.0 Fib with the closest candidate being the 1.236 Fib extension, where SMCI can even target $700.
---
** Please LIKE 👍, FOLLOW ✅, SHARE 🙌 and COMMENT ✍ if you enjoy this idea! Also share your ideas and charts in the comments section below! This is best way to keep it relevant, support us, keep the content here free and allow the idea to reach as many people as possible. **
---
💸💸💸💸💸💸
👇 👇 👇 👇 👇 👇
$SMCI LRLRSMCI has been consolidating between Oct’24 low and Feb’25 high, in OTE zone of fibs. Price has held higher lows and engineered lower highs. I’ve marked the previous month high, previous quarter high and previous year high as major liquidity areas that should be displaced through and held as support. Over previous week high, 40.95 is where I want to see price break and hold towards previous month high to confirm building a position for swings. 12/18 70c and 1/15/27 80c have my interest for that. The premium charts for these contracts match price action on the ticker itself. Sept 8th is an conference, citi global tmt conference, that can be the catalyst that brings the volatility.
Super Micro Computer AI-Fueled Growth Meets a Bullish TurnaroundSMCI is turning around into a bullish trend, with the recent retracement attracting renewed buying interest. The stock is showing improving technical momentum as buyers step in following the pullback.
Super Micro Computer, Inc. is a $25bn market cap company that manufactures and distributes information technology solutions and computer products. Its offerings include GPU and coprocessor systems, servers, storage solutions, motherboards, chassis, workstations, power supplies, SuperRacks, and server management products.
SMCI is a no-moat company but has delivered strong fundamental growth, with revenue and EPS increasing in each of the last three quarters. In the most recent quarter, revenue and EPS grew 93% and 471%, respectively. Operating and net margins are 13% and 10%, while ROE and ROIC are 21% and 14%. The company has a current ratio of 3.9x and a debt-to-equity ratio of 0.6x.
Revenue and EPS are forecast to grow consistently over the next three quarters, with next-quarter growth expected at 156% and 181%, respectively. The average analyst target price is approximately $41.33, implying about 7% upside potential.
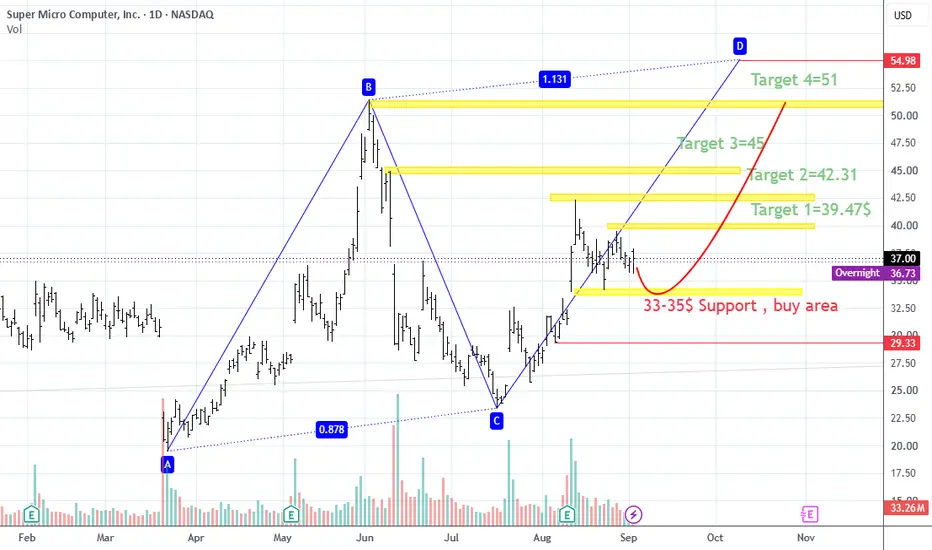
SMCI - Setting Up for Break-OutSMCI is consolidating within a key support zone between 33 and 37, while the uptrend from the July lows remains intact.
As long as price holds above 33, the bullish structure remains valid. A breakout from this range could lead to a move toward the 48–52 resistance area in the coming weeks.
Chart:
SMCI TOO CHEAP TOO MANY SHORTS...Imagine a company that’s not just riding the AI wave but steering it—Super Micro Computer (SMCI) is that titan. With demand for its servers skyrocketing—think $14.94 billion in 2024 revenue, doubled from the prior year, and a $40 billion 2026 target—it’s the undisputed king of high-performance computing. Why? SMCI’s mastered the art of execution, delivering custom, energy-efficient servers faster than anyone. Its secret weapon? Liquid cooling technology, backed by 9 critical patents, that’s revolutionizing data centers. While others scramble to keep up, SMCI’s already shipped over 100,000 liquid-cooled GPUs, slashing power costs by up to 40% and meeting the insatiable needs of AI factories.
This isn’t new for SMCI. As a motherboard manufacturing pioneer since 1993, it’s spent decades perfecting modular, scalable designs—think Lego bricks for tech giants. That legacy, paired with its server supremacy, creates an unassailable moat. Dell and HP? They’re playing catch-up. Dell’s AI servers are a fraction of its business (5% of revenue), and HP’s enterprise arm lacks SMCI’s agility. Neither matches SMCI’s rack-scale integration or its chokehold on Nvidia’s ecosystem—SMCI’s the go-to for Blackwell GPUs, where liquid cooling is non-negotiable. Competitors face a brutal truth: SMCI’s patents and speed-to-market are a wall too high to climb.
Yet, at ~$36 today (March 3, 2025), SMCI’s shares scream undervalued. A forward P/E of 20-25, with 54% YoY growth in Q2 2025 prelims ($5.6-$5.7 billion), dwarfs Dell’s 15 P/E on slower gains. The Street’s “Hold” and $45-$53 targets miss the mark—SMCI’s moat and demand suggest $70-$100 is closer. Tariff fears and audit noise? Temporary static. With 85% institutional ownership and AI infrastructure spending surging (Gartner predicts $367 billion in 2025 data center spend), SMCI’s poised to soar. This isn’t just a stock—it’s a steal, a front-row seat to the AI revolution, with a moat that leaves rivals drowning in its wake.
MSCI: BULLISH PLAYBOOK to ATHsWhat is good boys,
My ideal scenario for MSCI is very simple:
I want MSCI to take the main range and then begin developing a proper accumulation model.
If we get the sweep + accumulation confirmation, this becomes an extremely high-probability macro long in my framework.
And I'm not looking for a small bounce.
If the model develops the way I expect, I believe MSCI can eventually trade well beyond its previous ATHs, with the larger macro projection offering potential ~600% spot upside towards ATHs, the first TP area.
The important part?
I don't want to buy before the model exists.
Range low → Liquidity sweep → Accumulation → Confirmation → Macro expansion.
Everyone wants the breakout.
I want to be positioned where the breakout is manufactured.
SMCI: news flow leaning bullish — the net read
SMCI did not get one story today, it got several, and they do not all point the same way. Weighed against each other — new against old, and tracking which ones have already faded:
++ NVIDIA, OpenAI and SB Energy plan 4.25 GW AI Data Center campus in Ohio - W.Media
+ News | OpenAI, SB Energy, Nvidia team up on one of largest planned data center projects - CoStar (fading)
+ BlackRock (BLK) & NVIDIA Corporation (NVDA): BlackRock’s Larry Fink Says the US Alone Needs 70 Gigawatts of Power for AI (fading)
112 stories were weighed in this window; the 3 carrying the most weight are listed.
Net read: +++ leaning bullish — top of our scale.
What this is: a measure of which way the *news* is leaning right now — not a promise about price. A read being right and a read still being worth taking are two different things: once price has travelled a long way from where the read was published, it is stretched, and a lean that is stretched is a no-chase rather than an invitation.
Weight is not fixed either. A fresh headline lands, the balance tips, and the net read can flip inside an hour — that shift is the part worth watching, not the first print.
I will post an update under this idea once the market has had time to speak, either way.
(Informational only — not financial advice, not a signal.)
SMCI — Daily Structure: The Empty Space MattersSMCI is moving into an interesting part of the daily structure, and the most important thing on this chart may actually be where price historically has not spent much time.
The major upper battlefield, in my view, is roughly 45–48.
That area combines prior structure with the long-term descending trendline and is where I would expect a more meaningful fight between buyers and sellers if price continues higher.
What stands out below it is the lack of sustained agreement.
From roughly 32–45, SMCI historically has spent relatively little time consolidating.
The 32–40 region is especially thin.
Price has generally moved through that area rather than establishing prolonged acceptance inside it.
That does not mean consolidation there is impossible.
It does mean I would be cautious about assuming current price automatically becomes a new long-term balance area simply because price has reached it.
My bearish thesis does not require rejection here
SMCI could reject from current structure.
It could also continue higher toward 45–48 before sellers regain control.
Both remain reasonable possibilities.
A move higher through this relatively empty area would not, by itself, invalidate the bearish thesis.
The more important question is what happens when price reaches the upper battlefield.
A rejection around 45–48 would keep the larger descending structure intact.
A clean break through that area followed by acceptance and structure developing above it would be much more important.
That is the sequence I care about:
break → acceptance → structure
Not simply a wick through resistance.
Why 52 matters
The next major reference is around 52.
If SMCI can break the descending structure, establish itself above the 45–48 battlefield, and then gain acceptance above 52, I would have to give substantially more weight to the bullish thesis.
That could represent a meaningful change in the larger daily structure rather than another rally inside a broader decline.
The lower battlefield
If the bearish thesis begins developing, the 30–32 region becomes extremely important.
Unlike much of the territory above it, this area has much stronger historical evidence of agreement and sustained negotiation.
That makes 30–32 a legitimate base-or-break decision area, not simply another downside target.
If price reaches it and buyers establish acceptance, it could become the foundation for another larger move.
If that structure fails decisively, however, the bearish picture changes materially and the lower references around 28 and 22 become increasingly relevant.
I also highlighted the much deeper historical low on the chart.
That is not a prediction or target.
It simply provides evidence that substantially deeper downside has existed within this broader structure before.
That establishes possibility, not probability.
For that deeper scenario to become credible, I would need to see deterioration happen sequentially rather than assume it in advance.
What I’m watching
My current structural framework is:
45–48: primary upper battlefield.
32–45: historically thin acceptance area.
32–40: especially little evidence of prolonged consolidation.
Break + acceptance above 45–48: bullish thesis strengthens materially.
Acceptance above 52: potentially meaningful daily structural change.
Rejection from current structure or 45–48: bearish thesis remains viable.
30–32: major lower negotiation / base-or-break area.
Decisive failure there: deeper downside becomes increasingly relevant.
The dotted paths are illustrations of possible outcomes, not candle-for-candle predictions.
The important lesson here is that absence of agreement can be information too.
I am not trying to predict exactly where SMCI turns.
I am identifying where price has historically been willing to stay, where it has tended to travel quickly, and where the next meaningful structural decisions are likely to occur.
SMCI | Bullish Above $38.50, Golden Cross Setup DevelopingI liked today’s action a lot.
SMCI closed at $39.84 (+1.74%) on roughly 62M shares while much of the broader market finished red. That relative strength stands out, especially following the recent earnings-driven breakout.
The biggest technical takeaway for me is that $38.50 held.
SMCI traded down to $38.74, found buyers, reclaimed $39, and closed back near $40 without giving back much of the breakout. That makes $38.50 my tactical line in the sand going into Monday.
There’s also an important MA setup developing here: SEE BLUE FLAG
The 20 (green), 50 (orange), and 200-day moving averages (blue) are converging
The 50-day is approaching the 200-day
A potential golden cross looks increasingly close ***
That kind of MA compression can become very important if price continues holding above the cluster and momentum expands.
My roadmap:
Above $38.50: bullish structure remains intact
Break $40.60: opens another push higher
$42.25–42.50: next major confirmation zone
Break $42.50: $47 becomes the next meaningful upside target (would be first major TP)
On the downside:
Lose $38.50: $35–36 likely comes back into play. LH / LL structure could be established. Seems unlikely.
RSI is also showing strong momentum, so I would prefer to see price hold these gains rather than immediately overextend.
What I like most is the relative strength. SMCI didn’t need a strong market backdrop to hold the breakout today.
Going into Monday, I’m bullish above $38.50, more aggressive above $40.60, and looking for real confirmation through $42.50.
SMCI: news flow leaning bullish — the net read
SMCI did not get one story today, it got several, and they do not all point the same way. Weighed against each other — new against old, and tracking which ones have already faded:
++ Oakland real estate developer announces plan for data center in downtown - CBS News
++ Super Micro Computer beats on earnings as margins surge (fading)
110 stories were weighed in this window; the 3 carrying the most weight are listed.
Net read: +++ leaning bullish — top of our scale.
What this is: a measure of which way the *news* is leaning right now — not a promise about price. A read being right and a read still being worth taking are two different things: once price has travelled a long way from where the read was published, it is stretched, and a lean that is stretched is a no-chase rather than an invitation.
Weight is not fixed either. A fresh headline lands, the balance tips, and the net read can flip inside an hour — that shift is the part worth watching, not the first print.
I will post an update under this idea once the market has had time to speak, either way.
(Informational only — not financial advice, not a signal.)
SMCI: news flow leaning bullish — the net read
SMCI did not get one story today, it got several, and they do not all point the same way. Weighed against each other — new against old, and tracking which ones have already faded:
++ Oakland real estate developer announces plan for data center in downtown - CBS News
++ Super Micro Computer beats on earnings as margins surge (fading)
110 stories were weighed in this window; the 3 carrying the most weight are listed.
Net read: +++ leaning bullish — top of our scale.
What this is: a measure of which way the *news* is leaning right now — not a promise about price. A read being right and a read still being worth taking are two different things: once price has travelled a long way from where the read was published, it is stretched, and a lean that is stretched is a no-chase rather than an invitation.
Weight is not fixed either. A fresh headline lands, the balance tips, and the net read can flip inside an hour — that shift is the part worth watching, not the first print.
I will post an update under this idea once the market has had time to speak, either way.
(Informational only — not financial advice, not a signal.)