Crash Puts Bets in MSTR BTC is now at the 76 retracement with a 4.23 confluence. If this is a downtrend, we should be in the topping range of it now.
If this is a downtrend, MSTR has no support until 70% or so under today's price.
I'm buying puts for strikes between this price and that price with a plan to exit 45 or so if the slam comes.
In-depth trading ideas
Descending Channel Ceiling Test Threatens Breakout Toward 240OVERVIEW
Strategy Inc (MSTR) is challenging the upper boundary of a multi-month descending channel near 170.00–172.00 after a decisive +9.47% daily surge to close at 168.50. The blue structure outlines a consolidation channel following the prolonged correction from the 2024–2025 peak area. While the larger green arrow favors an upside breakout targeting 210.00–240.00, confirmation strictly requires a daily close above the upper trendline, especially with overnight prices softening slightly toward 164.42.
FUNDAMENTAL SNAPSHOT
MSTR stock gained strong upward momentum following regulatory disclosures of an additional 950 Bitcoin purchase totaling $75.7 million, expanding its corporate Bitcoin treasury to approximately 846,000 BTC. Investor sentiment is further supported by company share repurchase programs and healthy USD liquidity reserves exceeding $5 billion. The primary upcoming catalyst remains overall Bitcoin price action alongside the company's next quarterly earnings report.
KEY OBSERVATIONS
- Price has been oscillating within a downward sloping regression channel since early 2026, finding support near the channel floor around 85.00–90.00 in mid-2026.
- The latest daily session closed with a strong bullish expansion candle (O: 164.58, H: 169.52, L: 164.49, C: 168.50, +9.47%), directly touching channel ceiling resistance.
- Overhead channel resistance aligns closely around the 170.00–173.00 pivot zone, where prior rejections occurred in early 2026.
- The annotated primary scenario (larger green arrow) projects a breakout above the channel ceiling toward the 210.00 and 240.00 horizontal supply zones.
- The alternative scenario (smaller red arrow) highlights the risk of rejection at this upper bound, targeting the dashed channel median near 120.00–125.00.
SHORT-TERM VIEW (Bullish bias following breakout confirmation)
Entry: 172.50–176.00 (on a confirmed daily close above channel resistance and retest)
TP1: 208.00 (March 2026 reaction high and major psychological level)
TP2: 238.00 (major horizontal supply shelf from late 2025 breakdown)
Stop Loss: 154.00 (below the pre-breakout consolidation base)
Invalidation: Daily close below 154.00
Risk/Reward: ~1:1.7 to TP1, ~1:3.3 to TP2
Alternative scenario (lower probability): Rejection at channel resistance
Entry: 164.00–167.00 | TP1: 142.00 | TP2: 122.00
Stop Loss: 174.50
Risk/Reward: ~1:2.3 to TP1, ~1:4.4 to TP2
LONG-TERM VIEW (Bullish trend reversal on macro channel breakout)
A sustained weekly breakout above the descending channel ceiling ends the 2026 corrective regime and establishes a measured move toward the multi-year pivot range.
Entry: 172.00–180.00
TP1: 240.00 (structural resistance zone)
TP2: 320.00 (major distribution pivot from mid-2025)
Stop Loss: 140.00 (below the channel midline and swing pivot)
Invalidation: Weekly close below 140.00
Risk/Reward: ~1:1.8 to TP1, ~1:4.0 to TP2
DISCLAIMER
This analysis is for educational purposes only and is not financial advice. Trading stocks involves significant risk. Always do your own research and manage your risk.
MicroStrategy at the Brink: $200 Surge or $70 Capitulation?The 4-hour chart reveals the formation of a major bearish harmonic pattern (Cypher/Shark type) testing a critical institutional resistance zone at the upper boundary of an ascending channel.
1. Harmonic Structure Breakdown (X-A-B-C-D)
Point A (Major Top - $198.67): The origin of the previous corrective wave.
Point B (Major Low - ~$76.00): The capitulation zone where the market found a solid floor (1.259 XA retracement).
Point C (Recent Top - $171.78): The recent bullish momentum has struck the descending trendline and the 0.788 Fibonacci retracement, potentially marking the formation of point C. Point D Projection (Macro Target - $70.45): If the harmonic structure is validated by a rejection at point C, the C-D corrective leg projects a return to the foundational liquidity zone at $70.45 (1.089 ratio).
2. The Scenario Matrix
🔴 Bearish Scenario (C-D Leg Validation)Trigger: Confirmed rejection below the $171.78 resistance.
Intermediate Supports: First pullback zone at $152.05 – $157.23, followed by a breakdown of the $143.10 pivot targeting $126.80.
Ultimate Target (Point D): $70.45 (full capitulation and channel bottom retest).
🟢 Bullish Scenario (Harmonic Invalidation)Trigger: A 4H or Daily candle close above $171.78 backed by volume.
Bullish Targets: Intermediate resistance at $185.01, followed by a retest of the all-time high at $198.67.
3. Momentum Indicator AnalysisSqueeze Momentum (SQZMOM): The histogram displays highly extended bright green bars, indicating potential buyer exhaustion and a high probability of compression or reversal.
MACD (CM_Ult_MacD_MTF): The MACD lines have reached extreme highs and are beginning to show red alert dots, signaling a loss of bullish momentum.
💡 RISK MANAGEMENT & STRATEGY: Buying at current levels (~$168-$170): Presents a highly unfavorable Risk/Reward ratio as you are buying directly into major resistance.
Shorting / Hedging: Invalidated if the price crosses $171.78, with a primary take-profit target at $152.05.
👉 THE GOLDEN RULE: PATIENCE. Let the closing candle confirm whether the $171.78 level holds or breaks.
Week 39 of 52 | MSTR $120 Reclaimed — $175–190 Is Back in PlayNASDAQ:MSTR has come a long way from where we were watching it a few weeks ago. Back then the idea was pretty simple: first I wanted to see the $82–95 area hold, then MSTR needed to recover $100–105, and after that $120 was the next level that really mattered. Now we’re trading around $154, so a big part of that move has already happened.
That changes the setup. At $90–100, I was interested in whether support could hold. Around $120, I was watching for the reclaim. At $154, I’m thinking a lot more about patience. This is usually the point where people start getting interested because the stock is moving fast, and it’s also where it becomes easy to chase.
I don’t really want to do that here. A big green candle makes the chart look obvious after the fact, but it doesn’t automatically mean the risk/reward is still attractive at the current price. I’d rather wait and see what MSTR does when it finally pulls back.
The first area I’m watching is around $140–145. After a move like this, I think that’s a reasonable place to look for buyers. If MSTR pulls back, holds that area and starts moving higher again, the structure would still look healthy to me. If we lose it, then $120–125 becomes much more important.
That $120–125 area matters because it was resistance before. Now I want to see if it can become support. That’s one of the things people sometimes overcomplicate in technical analysis. A breakout by itself is not enough. What happens after the breakout matters just as much.
If price breaks resistance and later comes back to the same area, that’s where you get more information. Do buyers defend it? Does price immediately fall back below it? Does volume come in? Does the stock start building higher lows? That reaction tells you a lot more than just drawing a line on the chart.
That’s why I’m paying attention to $120–125. If MSTR eventually comes back there and buyers defend it, I’d see that as a much stronger confirmation that the structure has really changed.
Above current price, I’m still watching the $175–190 area. That zone was already on the chart before this move. I’m not saying MSTR has to go there next, but if momentum continues, that’s the next area where I’d expect things to get more interesting.
There will probably be more sellers there, maybe some profit taking, maybe a rejection, maybe a breakout. I don’t know yet, and I don’t need to know yet. I’d rather wait and see how price reacts when it gets there.
That’s really the part I care about most. The level itself isn’t the trade. The reaction at the level is.
Bitcoin also remains a big part of the picture. MSTR doesn’t trade like a normal software company anymore. BTC sets a lot of the direction, and MSTR tends to amplify the move. When Bitcoin is strong, MSTR can move very fast. But that works the other way too, and if BTC starts losing momentum, MSTR can give back gains quickly.
So even though this chart looks much better than it did a few weeks ago, I’m not interested in assuming the next move is straight to $190.
For now, these are the levels I care about:
$140–145 — first area to watch on a pullback
$120–125 — key breakout support
$175–190 — major supply area
$82–95 — major support
And for me, the main lesson here is still patience. You don’t have to catch every candle, and you don’t have to buy just because something is moving. Sometimes the best thing you can do is already know your levels and wait.
If MSTR keeps running without giving a good setup, that’s fine. There will always be another trade. I’d rather miss part of the move than force an entry just because I’m afraid of missing it.
Patience is part of the trade.
Not financial advice.
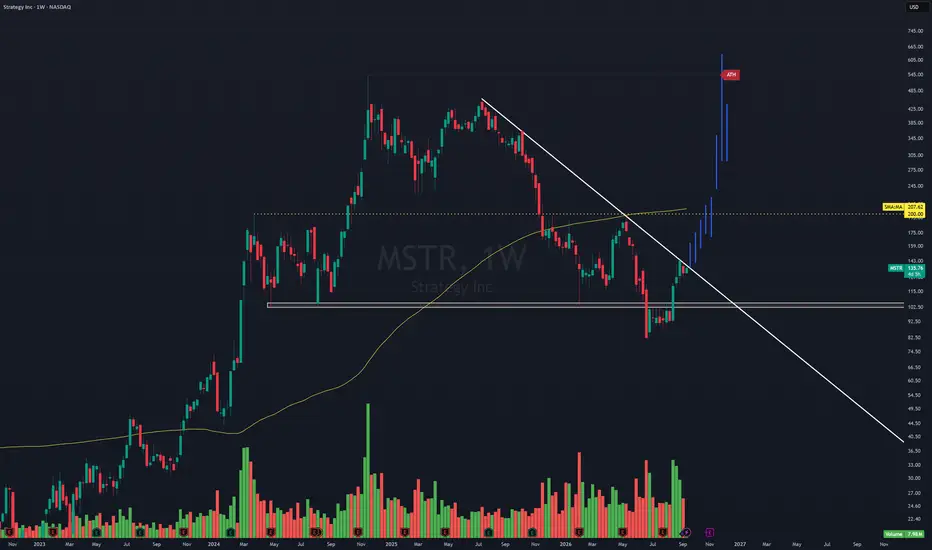
MSTR Weekly — Reclaimed Key Support, Needs the July 25 DowntredStrategy Inc (NASDAQ: MSTR ) — Weekly
What's constructive:
- Price reclaimed and closed back above the horizontal level (~$100-110) that's flipped between support and resistance over the past year or so — it should now be treated as support again. The reclaim came on solid volume.
- On the daily, price has also cleared the 150-day SMA , which is another bullish signal — though it still needs to clear the 200-day SMA to fully confirm.
What's still missing:
- The downtrend resistance line running all the way from July 2025 hasn't broken yet. Price has already tested it a few times. A clean break and hold above it would be the real confirmation for a bigger move.
Two ways to play it:
- Aggressive: it's already a valid buy here — above the reclaimed support level and above the daily 150 SMA, with a stop placed below both.
- Patient: wait for the July 2025 downtrend line to actually break first. That's the confirmation I'd rather see before expecting the bigger move.
I'm leaning toward waiting for that downtrend break before sizing up, but the structure is clearly improving either way.
NFA.
Strategy in SatoshisI present Strategy in Satoshis under an all-time overhead resistance. I propose that Strategy can finally break out from this pattern. This would come after Strategy could have been wiped out on that last Bitcoin stab down, but they survived. Enter Saylor laser eyes meme here.
You can see in the upper, right hand corner of the screen, that I've changed the denominator to BTC, so no need to concatenate tickers.
I like to think of what can happen that has't happened yet. BTC to $1M. 95% gap fill on the BTC.D. "Snap-to" the BTC Stock to Flow Curve. MSTR doing wonderful things, and MSTU just getting downright nasty. At localized MSTR peaks, you need to be wary of a 50% drawdown when trading MSTU (2XMSTRETF), because that would wipe out MSTU holders. But, I have made a shit ton on the first MSTU swing, and I plan on making a shit ton on round 2.
FOMC is the catalyst. $MSTR is the chart
NASDAQ:MSTR is not just another software stock to me. It trades heavily around its Bitcoin exposure, so I’m watching BTC first before deciding what MSTR is giving me.
My macro map:
BTC
→ 4H reclaim zone: $77,248–$78,488
→ Key failure level: $75,560
MSTRUSDT
→ Pullback area: $128.46
→ Invalidation: $120.58
→ T1: $147.33
My idea is simple:
If FOMC comes in less hawkish than feared and BTC reclaims its 4H zone, I’ll look for MSTR to confirm the move.
If BTC loses $75,560 and yields stay elevated, the MSTR setup becomes defensive instead.
I’m not chasing the FOMC candle.
I want the reaction → BTC confirmation → MSTR setup.
That’s why I like having Crypto + TradFi Perps in one place like Bitget. I can watch CRYPTO:BTCUSD and NASDAQ:MSTR side by side without switching between platforms.
Also keeping an eye on Strategy’s capital structure. The company recently repurchased $139.3M of STRC while leaving its 845,050 BTC holdings unchanged, so there’s no fresh BTC accumulation from that latest update.
One catalyst. One ticker. One clean setup.
Not Financial Advice. Always DYOR.
$MSTR: Weekly Crossback + Daily BNB1 + 65m 3 Bar Play⚛️HTF Context 🔭
NASDAQ:MSTR is building constructive multi-timeframe continuation structure. On the Weekly chart, price has put in a Wedge Pop and is now working through a Crossback. That is the first meaningful pullback and retest phase after the impulsive move, and it can create a strong continuation location if support holds.
The Daily is beginning to form a BNB1, showing that price is consolidating rather than immediately giving back the prior expansion.
LTF Structure 🧱
On the 65m, price is tightening into a 4 Bar Play. This is the execution pattern I am focused on. A 4BP gives a defined compression range and a clear decision point for whether buyers are ready to resume control.
The cleaner scenario is a break above the 4BP high followed by acceptance, participation, and continued respect of the rising 65m structure.
Cycle Position ♻️
Weekly Wedge Pop → Crossback
Daily BNB1
65m 3 Bar Play compression
This is not about predicting. It is about waiting for lower-timeframe compression to confirm in alignment with the higher-timeframe structure.
Continuation Scenario 🟢
A clean break and hold above the 65m 4BP high would signal that the consolidation is resolving higher. Ideally, price expands from the range without immediately losing the breakout level.
Failure Scenario 🔴
The idea fails if price breaks the 4BP high, rejects, and accepts back into the pattern or loses the 65m higher-low structure. No acceptance above the trigger, no trade.
Execution Mindset 🎯
I am not chasing a candle. I am watching for Location → Compression → Confirmation.
Not financial advice. This is an educational market structure breakdown.
M.Strategy Stabilizes At 83 As New Bullish Setup May Be FormingM. Strategy(MSTR) is finally stabilizing around the $83 support area, and it looks like there is now room for further gains as price is also recovering above the trend line connecting sub-waves one and four. This is an indication that we could be entering a new bullish phase, with a recovery towards the $190–200 area or higher possible during the rest of the year.
From an Elliott Wave perspective, we are tracking wave A/1 of a minimum three-wave A/1/B/2/C/3 rally. This suggests more upside can be seen, although traders should be aware of a potential wave B/2 pullback before the continuation higher in wave C/3.
Highlights:
Strategy is stabilizing around the $83 support area.
Price is breaking above the trend line connecting sub-waves one and four, suggesting the bearish cycle may be coming to an end.
A recovery towards the $190–200 area or higher could follow during the rest of the year.
MSTR: Bullish Gartley With Massive Upside PotentialMSTR has formed a bullish Gartley pattern on the weekly chart, competing around the Potential Reversal Zone.
More importantly, the dashed green trigger has already been triggered, giving the bullish setup confirmation.
Trade Setup
Entry Zone: $110–$120
Stop Loss: $75
Take Profit Targets:
TP1: $305
TP2: $410
TP3: $600
TP4: $900
The Bigger Picture
What stands out here is the potential size of the move.
If MSTR holds the reversal zone and continues higher, the move toward $305 and $410 would already be substantial. If momentum really accelerates, $600 and eventually $900 become the larger targets shown on the chart.
The bullish Gartley gives us the structure, while the dashed green line has already been broken, meaning the trigger is no longer something we are waiting for.
The key risk level is $75. A break below that level, invalidates the bullish setup.
If this setup plays out, we could be looking at a MASSIVE move from the current reversal area.
Chart Pattern Analysis Of MSTR.
K2 is a first test to the resistance of the downtrend Line.
It tried to break up the resistance but failed.
The supply pressure sharply increased at K2.
It seems that a consolidation around the downtrend line will start from K2.
I will try to buy it if the following candles successfully fall to test 0.5fib area in the next 5-6 candles.
On the other hand,
It is also possible that K3 break up the resistance immediately,
If K3 finally close upon the line,
I will also try to buy it.
MSTRAlways use 2x–3x leverage. We build positions in stages, both long and short.
Max 4% of your account as margin per position. Split that 4% into 3–6 entries.
Example: $100 account → max $4 margin per position. Split it as $0.5, then $1, then $1.5. So $0.5 × 3x = $1.5 position size.
Don't get greedy.
Only add when your ROI is above -100%. Better: wait a few days between add-ons. Sleep on it — you might end up adding from higher.
Keep half your account in cash as a reserve. Balanced.
In a short market: 1 long for every 3 shorts.
In a long market: 1 short for every 3 longs.
Every position's liq level should be at least 10x away.
Doubling your account in a day isn't hard — losing all of it isn't hard either. Play carefully. The market is waiting for you to gamble so it can take your money.
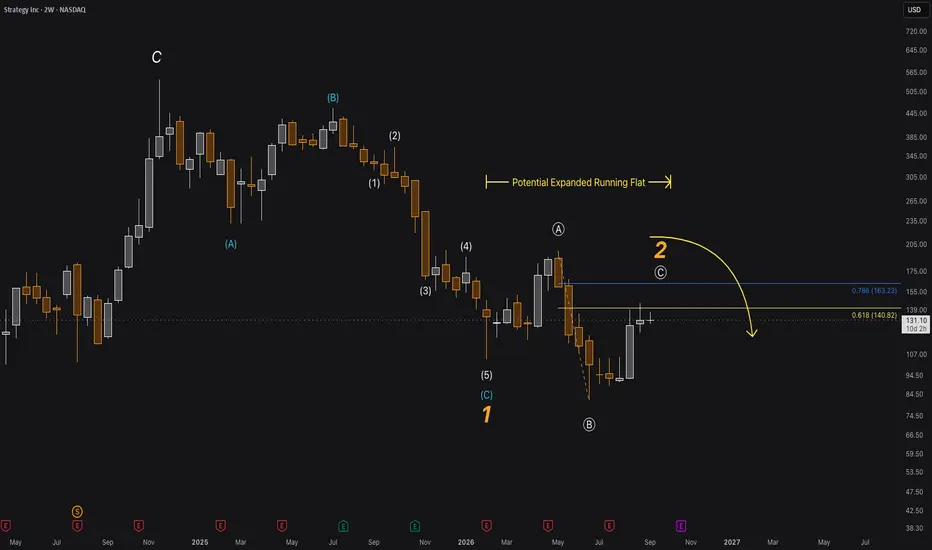
MSTR- Potential Expanded Running FlatMSTR could be printing an expanded running flat (3-3-5) here to the upside. An 'ABC' down
(Nov '24 - Feb '26) potentially marks '1' of a 5-wave move down and currently experiencing correction.
1D Chart
On a lower time frame, the wave count makes sense. An ABC up that forms (A) of higher degree followed by a zigzag down that forms (B). And, thereafter a leading diagonal that marks (i) of a 5 wave impulse to the upside.
Price is currently in a 0.618 Golden Window; my anticipated retracement for (C) that could potentially mark '2' of higher degree. If an expanded running flat prints here, the structure suggests strong bearish impetus for the overall trend down and potentially marks the origin of wave '3' to the downside (in this case, where the strongest selling pressure occurs).
If price action retraces beyond (A), then this invalidates the expanded running flat case creating the likely hood of an expanded flat. Good Luck!
-Not Financial Advice-
Is Strategy about to continue to crash another 20%+ ?Is MSTR heading to around $100 within 30 days or so? Will the pattern continue, or will this time be different? Either way, I believe there is a bullish set up when there is a cross up of the red 5 ema and the yellow 21 ema. Of course the ratios and the timeline may differ, but the agenda remains the same.
I recently sold all my MSTR and Circle...and I will buy back on the ema bullish cross up. I imagine MSTR will bottom with BTC and crypto related stocks (Circle, Altcoins etc).
May the trends be with you.
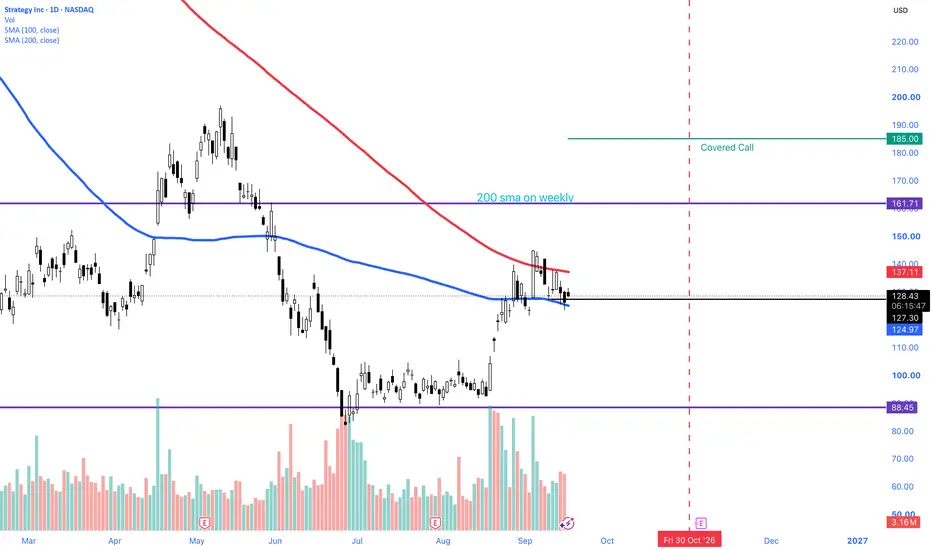
MSTR: Elliott Wave roadmap and the 144.92 recovery testMSTR is testing whether its rebound from the June low can develop into a more durable recovery. The first checkpoint is a daily close above 144.92 USD followed by holding that level. Until then, the latest advance can still be corrective. This is a neutral daily-chart roadmap, not a confirmed bullish impulse call.
The chart uses NASDAQ MSTR, the displayed Cboe One feed, and USD. The latest completed session reviewed is September 10, 2026, with a close of 128.56. This analysis is dated September 11; premarket quotations are separate.
The larger Elliott context
The study begins at 9.00 on March 19, 2020. The working Cycle I count reaches 131.50 on February 9, 2021, with Primary subdivisions shown. A provisional complex W–X–Y correction then reaches 13.26 on December 30, 2022, labeled Cycle II.
From that low, the advance to 543.00 on November 21, 2024 is treated as candidate Primary 1 within a developing Cycle III. Its Intermediate 1–5 anchors include 47.51, 30.71, 200.00 and 101.00 before the final high. The decline to 81.81 on June 26, 2026 is candidate Primary 2. The question mark matters: the June bottom remains unconfirmed.
There is a structural reason for this hierarchy. The 2026 low lies below the 2021 high. A simple conventional Cycle I–II–III–IV interpretation would therefore introduce first/fourth-wave overlap. The proposed hierarchy avoids that particular conflict, but it still needs valid internal subdivisions and confirmation from subsequent price action.
What remains unresolved
The chart connects the major historical sections and carries the latest movement forward. The decline from 543 is provisionally labeled A–B–C, with A at 231.51, B at 457.22 and candidate C at 81.81. Selected Minor detail is included within this correction.
The rebound is provisionally organized as A–B–C through 105.50, 91.67 and 144.92, followed by the developing September pullback. Its overlapping swings do not yet establish a new bullish impulse.
This is not an exhaustive validation of every internal wave. The 2021–2022 complex structure, smaller subdivisions of the first advance and the 2024 fifth-wave internals remain open. Key prices were checked in the data window; some secondary drawing anchors are visual estimates. The labels are a working interpretation rather than proof that the correction has ended.
The decision framework
A daily close above 144.92, followed by a successful hold or retest, would strengthen the recovery case. A brief breakout followed by rejection would weaken it. The next important obstacle is the May high at 197.00; higher recovery zones require reclaiming that area.
R1: 190–200 USD surrounds that historical resistance.
R2: 255–261 USD surrounds the 38.2% recovery of the decline from 543.00 to 81.81: 81.81 + 0.382 × (543.00 − 81.81) = 257.98.
R3: 310–316 USD surrounds the 50% recovery of the same decline, calculated at 312.41.
These are arithmetic retracements despite the logarithmic chart display. They are not extensions of a confirmed new impulse. The dotted paths and horizontal zone lengths are schematic, not timing forecasts.
The alternative
Below 91.67, the rebound weakens. Below 81.81, the June-bottom hypothesis fails. The alternative 73–75 zone contains the 88.6% retracement of the 13.26–543.00 advance, calculated at 73.65. Below 13.26, the selected developing Cycle III interpretation fails.
Those distant structural levels are not automatic trade stops. Any eventual trade needs a setup-specific invalidation and enough room to the next resistance to justify its risk.
The value of this count is the sequence of tests it creates: reclaim 144.92, then negotiate 197. Price must provide those confirmations. A plausible wave label or Fibonacci relationship alone does not establish a trading edge or a probability.
Educational technical interpretation, not a personalized investment recommendation.
Trust the Candlesticks and Indicators NOT the NewsOver this past weekend the retail news and retail financial websites slammed MSTR stating their opinions with doom and gloom for MSTR. This stock is actually in a reinvention mode and its CEO was extremely careful in his statements about the future of MSTR, the name change to Strategy Inc, and how the company is projecting slow steady growth over time.
Retail traders and retail investors typically believe that a CEO is always lying. Nothing could be further from the truth. CEOs go to prison if they lie, exaggrate, over promote etc.
CEOs statements are carefully constructed to be factual, with minimal emotional content, without emotion, without bias, but clearly define the posture and projections for the company. They never project 30 years out as one news feed stated. Learn to read the candlesticks, identify Dark Pools, then Identify Professional Trader Nudges, and learn how to enter a trade with the professionals and let HFTs gap the stock upward. This is a superior way to make higher income trading stocks. Stop listening to the retail news.
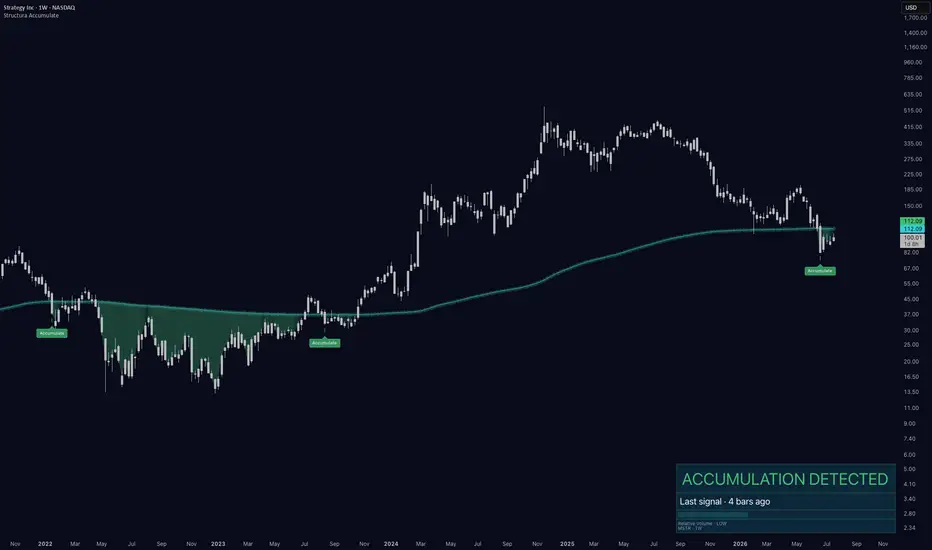
MSTR: First Accumulation Zone Since the 2022-2023 BaseFour weekly bars ago, Structura Accumulate marked a zone on MSTR - the first since the 2022-2023 base. Between those two zones: nothing. Through the entire advance, through every drawdown along the way - silence. That gap is the story.
What the last zone preceded
The 2022-2023 zone formed where MSTR was rebuilding structure after the crypto-winter decline - price consolidating around a long-anchored reference while attention on the name was minimal. What followed belongs to market history. And the honest caveat belongs right next to it: the zone identified a structural condition, not a destiny. Zones can fail. One spectacular example proves the mechanism, not the outcome.
Why the silence in between matters
A structure tool that stays quiet through a parabolic advance is doing its job. Accumulation is rebuilding behavior - it appears where a market is putting in a base, not where a trend is extending. If your tool finds "accumulation" at every pullback of a vertical move, it's describing noise.
The new zone - four weeks in, test in progress
The current zone is active and being tested right now. This is not a prediction - it's a live experiment with a binary outcome:
Acceptance: price stabilizes around the zone, reclaims it, structure holds - the rebuilding thesis strengthens week by week.
Rejection: price fails through and moves away - the attempt at a base failed, and the market told you without any forecasting involved.
Four bars is early. Zones on weekly charts resolve over months, not days - patience is the entire discipline here.
One MSTR-specific note
This chart carries unusual context: the company's balance sheet makes it a leveraged proxy for bitcoin, so its structure partly reflects a different asset's structure. A zone here is a statement about this chart's positioning behavior - not a view on bitcoin, and not a recommendation on either.
The takeaway
Two zones in three years on one of the market's most-watched tickers. The tool speaks rarely, at structurally significant places - and right now it's speaking. What happens around this zone over the coming weeks will be more informative than any opinion about it, ours included.
Structura Accumulate is free and public - full framework in our profile.
MSTR: Forms Next Major Bullish Descending Wedge Fractal!Hello Community,
welcome to my new analysis of MSTR on the weekly timeframe perspective. In the recent times, I have spotted interesting setups in the stock market that have the potential to transform into great trading opportunities in the upcoming times. One of them is MSTR, the stock has already emerged with great bullish bounces in the structure, aiming for higher levels in the zone. Now, I have detected all the underlying factors that will be interesting to watch out for in the near future.
When looking at my chart, we can watch how MSTR is trading within this gigantic ascending channel formation. Within this channel, MSTR already has major support at the lower boundary, where it has already bounced several times and which has been the origin of the major descending wedge fractal formation setup already before. This same fractal formation setup is forming now once again, with the wave count already being completed.
MSTR is completing the same fractal once again. Especially the bounce within the bullish accumulation boundary marked in green, as well as the simultaneous bullish confirmation bounce within the 600-EMA marked in blue and the 400-EMA marked in green, are confirming this bullishness in this dynamic. From here on, the fractal is pointing to a bullish continuation till the upper target zones are reached, as marked in my chart. They are within the upper boundary of this huge channel.
In this manner, thank you a lot for watching!
The support is highly appreciated.
VP
STRATEGY This is its last move before the Bull Cycle.Strategy's (MSTR) Bear Cycle is almost completed based on the previous 2021 - 2022 pattern. Technically, the market continues to be on a non-stop downtrend since the mid July 2025 High and overall a Bear Cycle since its November 21 2024 All Time High (ATH).
Right now the price just hit its 1D MA200 (orange trend-line) following a 1D MA200/ 1W MA200 (green trend-line) Bearish Cross. When that took place in October 2022, the final Stage (3) of the Bear Cycle was only 2 months away before bottoming. This time that may come a little earlier, assuming the total duration of the current Bear Cycle is also 98 weeks (686 days) like the previous one.
If not there is even time for an aggressive final sell-off near the 1M MA200 (red trend-line) and the bottom of the Channel Up within $65.00 - 60.00 (would also be close to a -90% total decline like 2021/22). But if it replicates the previous Bear Cycle duration, best chance is a similar Double Bottom at $82.50.
So far the structure including the different stages and MA movement among the two Cycles has been identical so we have every reason to expect that 2026 will be concluded this way. Even their MA patterns among the two Cycles showcase incredible similarities, both starting Stage 2 by turning the 1D MA200 into Resistance (that held for the rest of the Bear Cycle) and continuing with a 1D Death Cross that led to the break below the 1W MA200 and the beginning of Stage 3. Note that the Bull Cycle got confirmed only after the price broke above its 1W MA50 (black dashed trend-line) on January 30 2023. So if that breaks first, the Bull Cycle starts without a final Bearish Leg.
---
** Please LIKE 👍, FOLLOW ✅, SHARE 🙌 and COMMENT ✍ if you enjoy this idea! Also share your ideas and charts in the comments section below! This is best way to keep it relevant, support us, keep the content here free and allow the idea to reach as many people as possible. **
---
💸💸💸💸💸💸
👇 👇 👇 👇 👇 👇