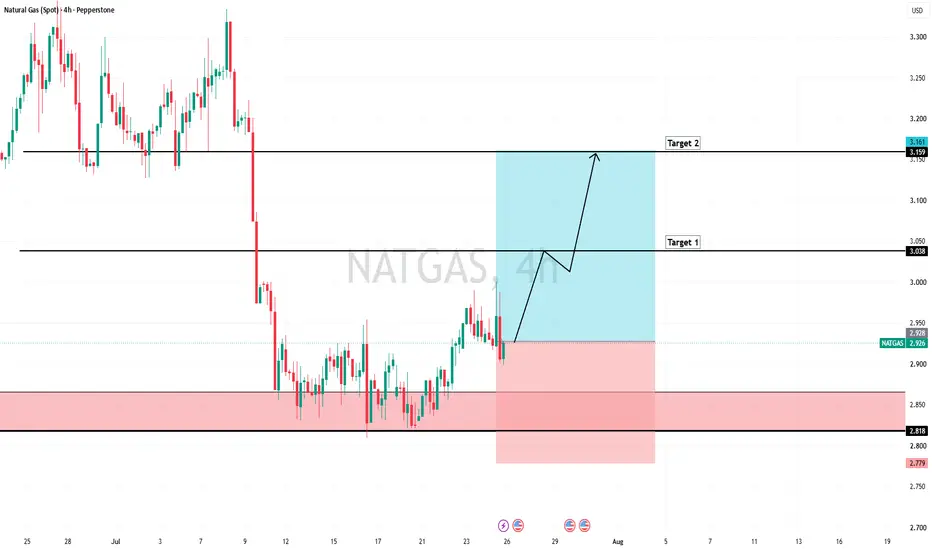
The Natural Gas Will Jump from a Support LevelHello Traders
In This Chart EURUSD HOURLY Forex Forecast By FOREX PLANET
today EURUSD analysis ๐
๐ขThis Chart includes_ (EURUSD market update)
๐ขWhat is The Next Opportunity on EURUSD Market
๐ขhow to Enter to the Valid Entry With Assurance Profit
This CHART is For Trader's that Want to Improve Their Technical Analysis Skills and Their Trading By Understanding How To Analyze The Market Using Multiple Timeframes and Understanding The Bigger Picture on the Charts
In-depth trading ideas
๏ปฟNatural gas - the tape and hedge funds show us cluesUpdate 29th July 2026:
Hedge funds remain net short on natural gas as retail traders are net long.
I called it earlier back in June that natural gas prices would start falling.
The DOM & tape on Quantrader shows that hedge funds are unwilling to open any
longs even at these levels.
There is an untapped demand zone since 2024 which is at approx $2.25 - $2.35.
Surprisingly, retail positions are still net long, which tells me that traders are
hanging onto their losing positions. This should result in a further unwinding
of long positions as producers and leveraged funds continue with short
hedging.
A further decline of -12% is likely over the next few days/weeks.
Natural Gas: Bullish recovery faces the $3.00 test๐ฏ Trade Setup
Direction: Long after pullback and bullish confirmation
๐ป Entry: 2.900โ2.920
๐ Stop Loss:2.845
๐ฏ Take Profit 1: 2.985
๐ฏ Take Profit 2: 3.040โ3.050
Trend Analysis
Natural gas is trading near $2.93 and remains above the EMA 9, EMA 20, EMA 50 and SMA 200. The short-term structure is still bullish, but momentum is cooling near the $2.985โ3.00 resistance zone, suggesting possible consolidation.
Macro Outlook
The latest EIA storage build of 32 Bcf was below the 35 Bcf consensus but close to the five-year average of 30 Bcf, providing mild support to prices. However, inventories remain above average. Hot-weather demand supports the market, while high US production may limit further upside.
Conclusion
The bias remains cautiously bullish while price holds above $2.90. A confirmed H1 breakout above $3.00 could open the way toward $3.04โ3.05, while an H1 close below $2.845 would invalidate the bullish scenario.
โ ๏ธ Not financial advice.
NATGAS Trade setup: sellers test key support ๐ฏ Trade setup:
Direction: Short from breakdown / resistance retest
๐ป Entry: 2.745โ2.760
๐ Stop Loss: 2.850
๐ฏ Take Profit 1: 2.700
๐ฏ Take Profit 2: 2.650
๐ฐ News:
Natural gas remains under pressure as U.S. futures extend losses. The market is being weighed down by high production, robust storage levels, softer LNG feedgas demand and forecasts for milder August temperatures.
EIA data also shows U.S. gas inventories remain above the five-year average, limiting upside pressure despite seasonal summer power demand. This keeps the fundamental backdrop bearish unless weather forecasts turn hotter or LNG demand improves.
๐ Analysis:
On the 4H chart, NATGAS is trading near 2.75 after breaking down from the recent consolidation structure. Price remains below EMA 9, EMA 20, SMA 50 and far below SMA 200, confirming that sellers are still in control.
RSI is near 33 and Stoch RSI is deeply oversold, so a short-term bounce is possible. However, MACD remains bearish and the price is still holding below the 2.800โ2.830 resistance zone.
A rejection from 2.745โ2.760, or a failed reclaim of 2.800, would support a continuation toward 2.700 and 2.650.
โ ๏ธ Not financial advice.
Natural Gas at Major Demand โ Is a Strong Rebound About to BeginEntry: 2.696
TP1: 2.773
TP2: 2.921
TP3: 3.287
Stop Loss: 2.604
Natural Gas is testing a well-established daily demand zone, while RSI is approaching oversold territory. Broader gas markets are also receiving support from renewed supply concerns linked to Middle East tensions and QatarEnergyโs extended force majeure for European buyers.
The combination of technical support and improving fundamental sentiment creates the potential for a rebound from current levels.
Donโt short into Support, donโt buy into ResistanceProfessorโs Risk Clinic: Donโt short into Support, donโt buy into Resistance
Todayโs patient is Natural Gas on the 1-hour chart .
NATGAS has bounced from the 2.80โ2.82 support zone and is now trading near 2.88, approaching local resistance around 2.91.
This is exactly where many traders make the next mistake .
They see the bounce and want to buy.
But the move has already started, and price is now close to resistance.
๐ The Diagnosis
The broader structure is still weak. Price remains below the 200 SMA, and the larger bearish move has not been fully repaired.
At the same time, short-term momentum has improved. Price moved back above the fast moving averages, MACD is recovering, and RSI is near 60.
So the market is not a clean short anymore.
But it is also not a clean long.
It is trading between support and resistance.
โ ๏ธ Mistake #1: Shorting too close to Support
The 2.80โ2.82 support zone has already produced a reaction.
Shorting directly above that area means selling where buyers have already defended the market.
A short setup becomes cleaner only if price rejects the 2.91 resistance area or breaks back below 2.80โ2.82 with confirmation.
โ ๏ธ Mistake #2: Buying directly into Resistance
The recovery looks attractive, but price is already approaching 2.91 resistance.
Buying after the bounce means entering late, just as sellers may step back in.
For a stronger bullish case, NATGAS needs to break and hold above 2.91. Only then could the next upside area near 2.98โ3.00 become realistic.
โ ๏ธ Mistake #3: Ignoring momentum exhaustion
Stoch RSI is already high, which means short-term momentum may be stretched.
That does not automatically mean price must fall.
But it does mean buying late becomes riskier.
A good trade needs more than a bounce. It needs location, confirmation, and risk/reward.
๐ฏ Professorโs Verdict
Natural Gas is in a decision zone.
Bearish scenario: rejection from 2.91 or a break below 2.80โ2.82.
Bullish scenario: confirmed hold above 2.91, opening room toward 2.98โ3.00.
No-trade zone: buying below resistance or shorting directly above support without confirmation.
๐ Professorโs Rule
A good trade is not only about direction.
It is about location.
Do not short into support.
Do not buy into resistance.
Wait for the market to show who has control.
This is educational analysis, not financial advice.
Natural Gas at Harmonic Reversal Zone โ Pullback Ahead?A harmonic pattern has completed near a Potential Reversal Zone (PRZ), suggesting the current move could be approaching exhaustion.
Expecting a potential pullback or retracement from this zone. Watching closely for price confirmation before the next major move.
Disclaimer: This is not financial advice. Trade with proper risk management.
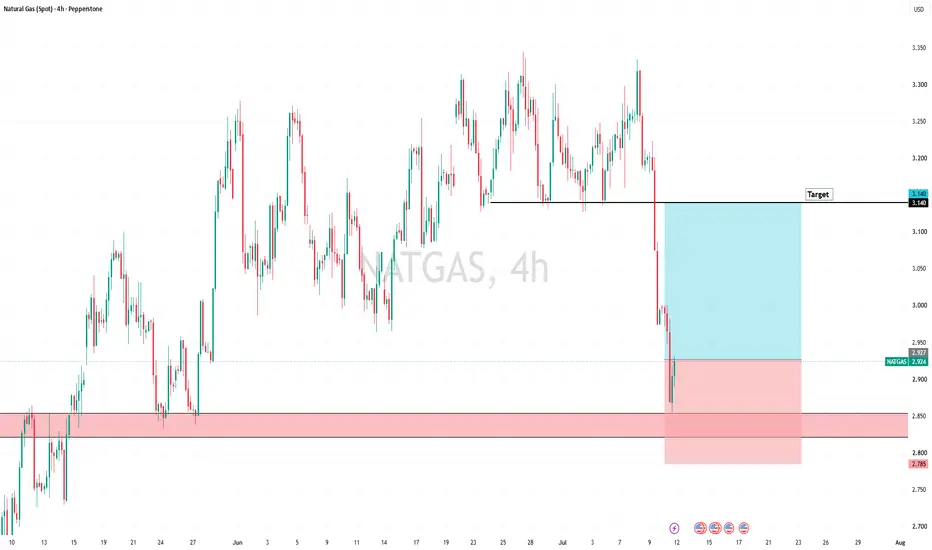
The Natural Gas Will Jump from a Support LevelHello Traders
In This Chart EURUSD HOURLY Forex Forecast By FOREX PLANET
today EURUSD analysis ๐
๐ขThis Chart includes_ (EURUSD market update)
๐ขWhat is The Next Opportunity on EURUSD Market
๐ขhow to Enter to the Valid Entry With Assurance Profit
This CHART is For Trader's that Want to Improve Their Technical Analysis Skills and Their Trading By Understanding How To Analyze The Market Using Multiple Timeframes and Understanding The Bigger Picture on the Charts
Natural Gas Trade Setup: Recovery attempt toward Resistance๐ Natural Gas: Recovery attempt toward $2.91 Resistance
๐ฏ Trade setup:
Direction: Long from support / after confirmation
Entry: 2.840โ2.865
๐ Stop Loss: 2.805
๐ฏ Take Profit 1: 2.910
๐ฏ Take Profit 2: 2.945
๐ฐ News:
Natural gas remains under pressure from bearish fundamentals, as traders continue to monitor U.S. production, storage levels and LNG export demand. Recent market sentiment has been cautious, with upside limited by concerns that supply remains sufficient while demand catalysts are not strong enough yet.
At the same time, the market is not fully bearish. Seasonal cooling demand and global LNG risks may continue to provide support, especially if weather forecasts point to stronger power-sector consumption. For now, Natural Gas remains range-bound unless price breaks above key resistance.
๐ Analysis:
On the 1H chart, Natural Gas is recovering from the $2.807 support zone and is now trading near $2.86. Price is back above EMA 9, EMA 20 and SMA 50, showing improving short-term momentum.
However, price is still below the SMA 200 near $2.90 and below the key resistance at $2.91. This means the current move is a rebound attempt, not a confirmed bullish reversal yet.
MACD is positive and rising, while RSI is around 61, confirming stronger short-term momentum. Stoch RSI is already near the overbought zone, so a short pullback before continuation would make the setup healthier.
โ ๏ธ Not financial advice.
NATGAS: Short Trade with Entry/SL/TP
NATGAS
- Classic bearish pattern
- Our team expects retracement
SUGGESTED TRADE:
Swing Trade
Sell NATGAS
Entry - 2.882
Stop - 2.898
Take - 2.853
Our Risk - 1%
Start protection of your profits from lower levels
Disclosure: I am part of Trade Nation's Influencer program and receive a monthly fee for using their TradingView charts in my analysis.
โค๏ธ Please, support our work with like & comment! โค๏ธ
NATGAS A Fall Expected! SELL!
My dear subscribers,
This is my opinion on the NATGAS next move:
The instrument tests an important psychological level 2.882
Bias - Bearish
Technical Indicators: Supper Trend gives a precise Bearish signal, while Pivot Point HL predicts price changes and potential reversals in the market.
Target - 2.854
My Stop Loss - 2.902
About Used Indicators:
On the subsequent day, trading above the pivot point is thought to indicate ongoing bullish sentiment, while trading below the pivot point indicates bearish sentiment.
Disclosure: I am part of Trade Nation's Influencer program and receive a monthly fee for using their TradingView charts in my analysis.
โโโโโโโโโโโ
WISH YOU ALL LUCK
The Natural Gas Will Jump from a Support LevelHello Traders
In This Chart EURUSD HOURLY Forex Forecast By FOREX PLANET
today EURUSD analysis ๐
๐ขThis Chart includes_ (EURUSD market update)
๐ขWhat is The Next Opportunity on EURUSD Market
๐ขhow to Enter to the Valid Entry With Assurance Profit
This CHART is For Trader's that Want to Improve Their Technical Analysis Skills and Their Trading By Understanding How To Analyze The Market Using Multiple Timeframes and Understanding The Bigger Picture on the Charts
NATGAS: Bulls Will Push
Looking at the chart of NATGAS right now we are seeing some interesting price action on the lower timeframes. Thus a local move up seems to be quite likely.
Disclosure: I am part of Trade Nation's Influencer program and receive a monthly fee for using their TradingView charts in my analysis.
โค๏ธ Please, support our work with like & comment! โค๏ธ
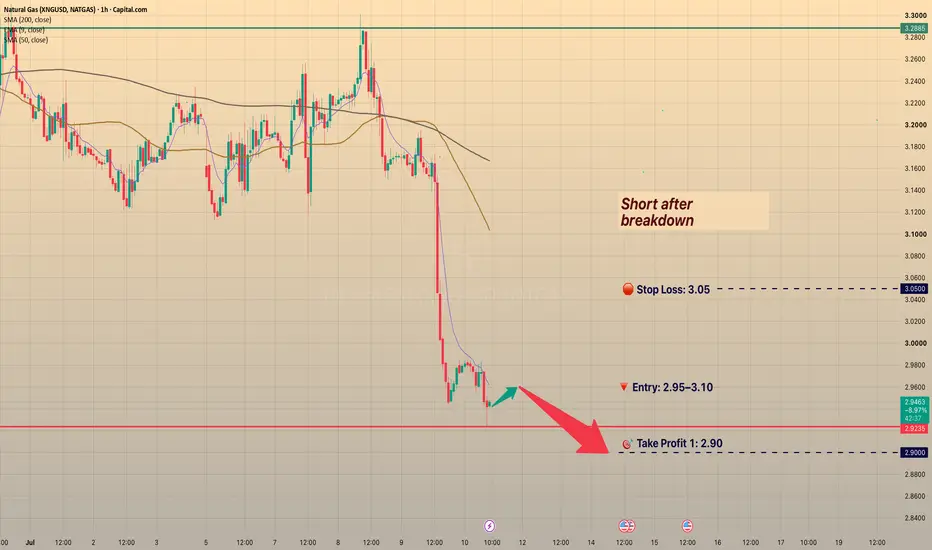
Natural Gas: Short after breakdown๐ฏ Trade setup:
Direction: Short after breakdown
๐ป Entry: 2.95โ3.10
๐ Stop Loss: 3.05
๐ฏ Take Profit 1: 2.90
๐ฐ News:
Natural Gas remains under pressure after the latest bearish supply signal. The market is still reacting to stronger storage builds and concerns about weaker near-term LNG export demand. Hot weather can support gas demand, but for now sellers are controlling the move.
๐ Analysis:
On the 1H chart, NATGAS broke below the key support near 2.94โ2.95 and is now trading around 2.94. The price remains below EMA 9, SMA 50 and SMA 200, confirming a strong bearish structure.
The breakdown is still active. If the price fails to recover above 2.98โ3.00, sellers may continue pushing the market lower. The next support zones are 2.90 and 2.85.
Scenario:
If NATGAS stays below 2.95โ3.10, the bearish setup remains valid and the price may continue toward 2.90โ2.85.
A recovery above 3.05 would weaken the short setup and could trigger a corrective rebound toward 3.06โ3.10.
โ ๏ธ Not financial advice.
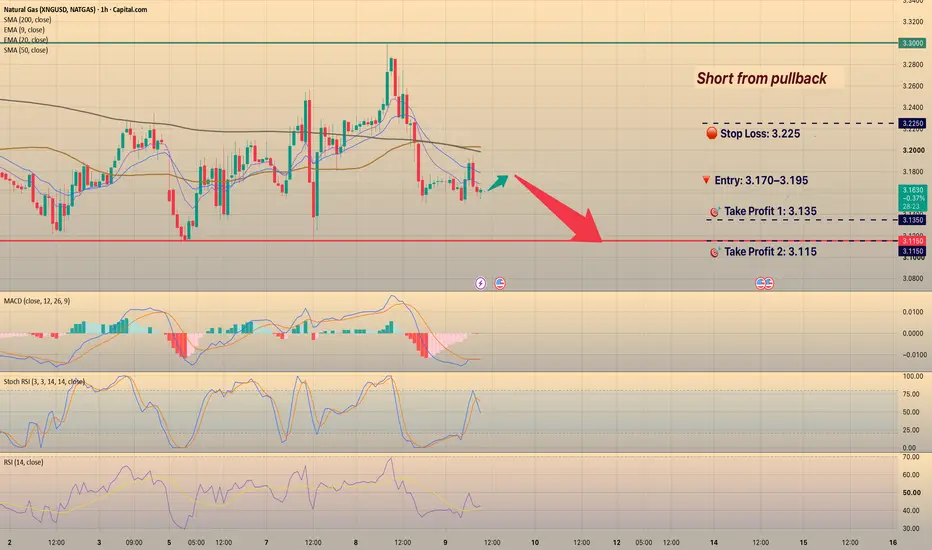
Natural Gas: Short from pullback๐ฏ Trade setup:
Direction: Short from pullback
Entry: 3.17โ3.95
Stop Loss: 3.225
Take Profit 1: 3.135
Take Profit 2: 3.115
๐ฐ News :
Natural Gas remains mixed. Hot weather and stronger cooling demand continue to support prices, while Middle East tensions keep global energy supply risks in focus.
However, U.S. prices are still capped by healthy domestic production and storage levels. Because of that, rallies can fade quickly without a stronger fundamental trigger.
๐ Analysis :
On the 1H chart, NATGAS failed to hold above the 3.27โ3.30 resistance zone and quickly pulled back toward 3.16.
This shows that buyers are losing momentum after the recent spike.
The nearest support is around 3.135โ3.115. If this area breaks, downside pressure may increase.
For bulls, the key condition is a recovery back above 3.20โ3.22.
Scenario :
If NATGAS rejects the 3.18โ3.20 pullback zone, downside pressure may continue toward 3.135 and 3.115.
A bullish scenario would require price to reclaim and hold above 3.22. That would weaken the short setup and could open the way for a retest of 3.27โ3.30.
โ ๏ธ Not financial advice.
Professorโs Risk Clinic: Why the Stop Was HitProfessorโs Risk Clinic: Why the Stop Was Hit
Todayโs patient is Natural Gas on the 1-hour chart.
The original idea was slightly bullish: Natural Gas was recovering from the 3.11โ3.16 support area and trying to break above the 3.220โ3.230 resistance zone.
The plan was:
Direction: Long after breakout / pullback
Entry: 3.220โ3.230
Stop Loss: 3.145
Take Profit 1: 3.260
Take Profit 2: 3.330
The trade was later closed because the stop was reached.
So what went wrong?
๐ The Diagnosis
The bullish idea was not completely wrong. Price did push above the 3.220โ3.230 area, and momentum was improving: MACD turned positive, RSI was near 60, and Stoch RSI was rising.
But the issue was not the direction.
The issue was confirmation and stop placement.
โ ๏ธ Mistake #1: Buying Before Full Breakout Acceptance
The entry was directly around resistance: 3.220โ3.230.
For this setup, price needed more than just a quick push above the level. It needed acceptance:
a clean hourly close above 3.230;
price holding above the breakout zone;
a successful retest of 3.220โ3.230 as support.
Instead, the breakout failed, and price flushed back down.
โ ๏ธ Mistake #2: Stop Inside the Support Zone
The broader support area was 3.11โ3.16.
The stop at 3.145 was inside that support zone, not clearly below it.
If support is a zone, price can dip into it, trigger stops, and then recover. That made the stop vulnerable to normal market noise.
โ ๏ธ Mistake #3: Natural Gas Needed More Room
Natural Gas is volatile. Sharp wicks, false breakouts, and liquidity sweeps are common.
A stop that looks safe on a calmer market can be too tight here, especially if it sits inside a major support zone.
๐ฏ Professorโs Verdict
The stop was hit because price failed to confirm acceptance above 3.220โ3.230 and returned into the broader support zone.
The direction was not necessarily bad.
But the entry was too close to resistance, and the stop was placed where price still had room to test support.
๐ Professorโs Rule
A stop should be placed where the trade idea is invalidated โ not where normal volatility can reach it.
Before entering a breakout trade, ask:
โHas price really accepted above the breakout level?โ
โIs my stop outside the support zone?โ
โAm I giving this market enough room?โ
A good idea can still become a losing trade if confirmation is weak and the stop sits in the wrong place.
This is educational analysis, not financial advice.
XNG/USD: Natural Gas Bull Run Ahead? Moving Average Confirms Buy๐จ๐ฐ THE GREAT NATURAL GAS HEIST โ VAULT BREAK-IN PLAN ๐ฐ๐จ
Asset: NATGAS/USD (Henry Hub Natural Gas Futures โ NYMEX: NG1!) โฝ๐
Energies Market Trade Opportunity Guide (Day/Swing Trade) ๐ฅ๐
๐ Yo Thief OG's โ the vault's glowing green again. Natural Gas has been creeping back up off the $3.00 psychological floor, and the crew's got eyes locked on the next resistance wall. Let's crack this one open. ๐๐จ
๐ THE PLAN
Bullish heist plan confirmed using moving average structure. Price action showing strength as it climbs off recent support โ the getaway van is warmed up. ๐๐จ
๐ฏ ENTRY
YOU CAN ENTER AT ANY PRICE LEVEL โ pick your window into the vault, thief's choice. ๐
๐ฆ TARGETS
Police force (major resistance) is stationed up ahead + overbought conditions building + trap zone likely + trend-change risk is real, so smart thieves grab their bag and roll out before the sirens hit. ๐
Day Trader Loot: TP1 @ 3.4000 | TP2 @ 3.5000
๐ FINAL Vault Target (Swing Crew): @ 3.6000
๐ Note: Dear Ladies & Gentlemen (Thief OG's) โ I'm not recommending you set only my TP. It's your own choice, you make the money, you take the money, at your own risk. ๐
๐ STOP LOSS
This is the Thief SL @ 3.0500 โ your escape hatch if the job goes sideways. ๐ช
๐ Note: Dear Ladies & Gentlemen (Thief OG's) โ I'm not recommending you set only my SL. It's your own choice, you make the money, you take the money, at your own risk. ๐
๐ CORRELATED PAIRS TO WATCH โ THE REST OF THE CREW:
๐ข๏ธ BLACKBULL:WTI Crude Oil โ energy-complex cousin; broad energy sentiment and oil-price swings often spill over into gas demand expectations
๐ข๏ธ BLACKBULL:BRENT Crude Oil โ global benchmark; watch for correlated energy-sector risk sentiment
โฝ $RBOB Gasoline โ refined products complex, moves alongside broader energy demand signals
๐ต TVC:DXY US Dollar Index โ commodities priced in USD, inverse-flavored relationship worth tracking
๐ HOSE:TTF (European Gas Futures) โ global LNG arbitrage driver; wide spreads vs Henry Hub pull export flows and price action
๐ LATEST REAL MARKET FUNDAMENTALS โ WHAT THE MARKET IS ACTUALLY SAYING:
Natural gas futures were trading around $3.28 per MMBtu, the highest in a week, supported by falling output and rising flows to LNG export plants ๐
Lower 48 production slipped to about 109.4 billion cubic feet per day in early July, down from 110.0 bcfd in June, and remained below the record December 2025 high of 110.6 bcfd โ๏ธ
Average flows to major LNG export terminals climbed to roughly 18.1 bcfd so far in July, up from 17.4 bcfd in June, reflecting stronger overseas demand ๐ข
Recent heatwave-driven cooling demand from power generators has been supporting withdrawals from storage, though weather forecasts have shifted cooler across the eastern US through mid-July, which could cap further upside ๐ก๏ธ
The most recent weekly storage report showed a larger-than-expected injection build, with actual data landing at 87 Bcf versus an 81 Bcf forecast โ inventories running comfortably above the five-year average
Looking further out, current market outlooks project Henry Hub spot prices averaging about $3.34/MMBtu in the second half of 2026 ๐
๐๏ธ Upcoming catalyst: next weekly Natural Gas Storage Report (Thursday release) โ always a volatility trigger for this pair
๐ฌ THIEF TRADER WISDOM OF THE DAY:
"A real thief doesn't chase the vault โ the vault comes to him. Patience is the best lockpick." ๐๏ธ
"Take the loot, dodge the sirens, live to rob another day." ๐๐จ
๐ Wishing the whole Thief OG crew clean entries, tight stops, and heavy bags today. Stay sharp, stay disciplined, and let's get this bread. ๐ฐ๐ฅ
โ ๏ธ Disclaimer: This is not financial advice. Trading involves risk. Manage your own risk and trade responsibly.
#NaturalGas #NATGAS #HenryHub #EnergyTrading #TradingView #ThiefTrader #ThiefOGs #CommoditiesTrading #DayTrading #SwingTrading
Quick Market Update ICEUS:DX1!
SP:SPX
PEPPERSTONE:NAS100
SPARKS:SILVER
In the video, I expressed my thoughts about the current market situation, and in my previous written analysis you can see the underlying logic.
In my opinion, we are getting close to taking long positions as the market moves into extremely oversold territory.
These opportunities will likely be short-lived and driven by underlying margin calls, which force other market participants to close their long positions by selling.
The Strait of Hormuz is the key variable. Once the economic pain becomes sufficiently severe, global powers may be compelled to take coordinated military action to reopen it in support of the U.S.โIsrael coalition.
Natural gas: mixed but slightly bullish recovery๐ฏ Trade setup:
Direction: Long after breakout / pullback
๐ป Entry: 3.220โ3.230
๐ Stop Loss: 3.145
๐ฏ Take Profit 1: 3.260
๐ฏ Take Profit 2: 3.330
๐ฐ News:
Natural gas is getting support from stronger summer demand. Hot weather forecasts and higher cooling demand are helping prices, while low wind generation may increase gas usage for power production. At the same time, abundant supply and storage levels still limit the upside, so the move remains fragile.
๐ Analysis:
On the 1H chart, Natural Gas is trading near 3.215 and testing the resistance zone around 3.22โ3.23. The price bounced from the 3.11โ3.16 support area and is trying to build a short-term bullish continuation.
MACD is turning positive, RSI is around 60, and Stoch RSI is rising, which shows improving momentum. However, the price needs to hold above 3.22โ3.23 to confirm buyers are in control.
Scenario:
If the price breaks and holds above 3.23, Natural Gas may continue higher toward 3.28 and 3.34. If the breakout fails and price returns below 3.16, the bullish setup becomes weaker and a move back toward 3.11 is possible.
โ ๏ธ Not financial advice.
NATGAS: Short Trade with Entry/SL/TP
NATGAS
- Classic bearish setup
- Our team expects bearish continuation
SUGGESTED TRADE:
Swing Trade
Short NATGAS
Entry Point - 3.2008
Stop Loss - 3.2185
Take Profit - 3.1734
Our Risk - 1%
Start protection of your profits from lower levels
Disclosure: I am part of Trade Nation's Influencer program and receive a monthly fee for using their TradingView charts in my analysis.
โค๏ธ Please, support our work with like & comment! โค๏ธ
XNGUSD: Bearish Pressure Continues๐ XNGUSD: Bearish Pressure Continues
๐ฏ Trade Setup:
Direction: Short from pullback
๐ป Entry: $3.160โ$3.180
๐ Stop Loss: $3.205
๐ฏ Take Profit 1: $3.130
๐ฏ Take Profit 2: $3.100
๐ฐ News :
The fundamental backdrop remains mixed. Hot weather and strong LNG export flows support demand, but high production and above-average inventories continue to limit upside. No major new catalyst appeared in the accessible feed during the latest two-hour window.
๐ Analysis :
XNGUSD trades near $3.146, below EMA 9, EMA 20, SMA 50 and SMA 200. The structure remains bearish, with lower highs and lower lows.
RSI near 35 shows weak momentum but is approaching oversold territory. MACD remains negative, confirming that sellers are still in control.
๐ Scenario:
The bearish scenario remains valid below $3.180โ$3.205. A confirmed break below $3.140 would support further downside.
A 1H close above $3.205 would invalidate the setup and could open a recovery toward $3.240.
โ ๏ธ Not financial advice.
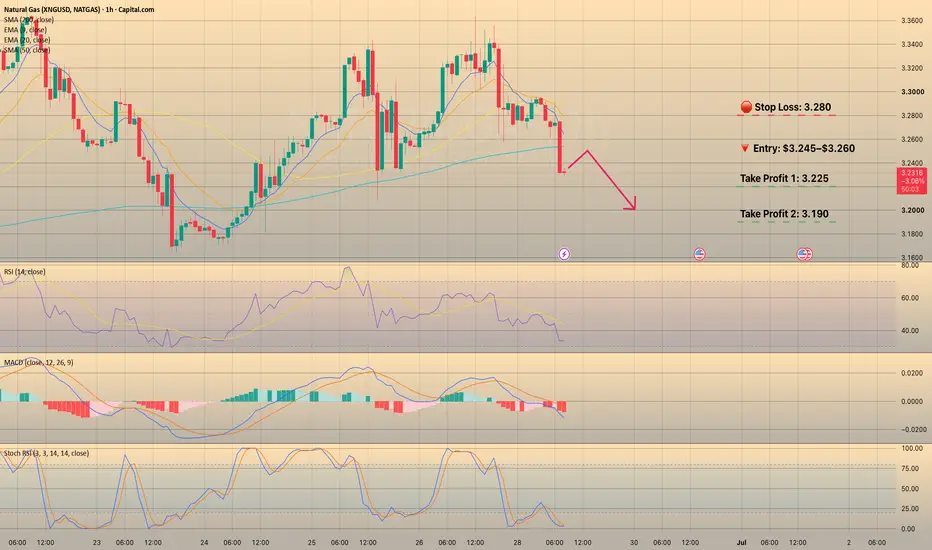
XNGUSD Update: SMA 200 Support Broken๐ฏ Trade setup:
Direction: Short after pullback
๐ป Entry: $3.245โ$3.260
๐ Stop Loss: $3.280
๐ฏ Take Profit 1: $3.220
๐ฏ Take Profit 2: $3.190
๐ Analysis:
XNGUSD has fallen to $3.235, breaking below the SMA 200 near $3.249 with a strong bearish candle. Price also remains below EMA 9, EMA 20 and SMA 50.
RSI is falling toward 35, while MACD confirms increasing bearish momentum. Stochastic RSI is oversold, so a brief rebound may occur before another decline.
Scenario:
๐ A failed retest of $3.245โ$3.260 would support further downside. A break below $3.220 could accelerate the move toward $3.190.
๐ A recovery above $3.260 would weaken the bearish signal. Holding above $3.280 could trigger a rebound toward $3.300.
โ ๏ธ Invalidation: Hourly close above $3.280.
โ ๏ธ Not financial advice.
The widow maker is ready give you a giftThey don't call natural gas the widow maker for a reason hahaha its extremely volatile commodity but I see an opportunity here in the charts I see a cup and handle at the lows of the chart and I'm here just to point that out and maybe have it in your watch list if your looking for a potential trade set up! To be clear I'm NOT in this! I will let you know if I do enter.