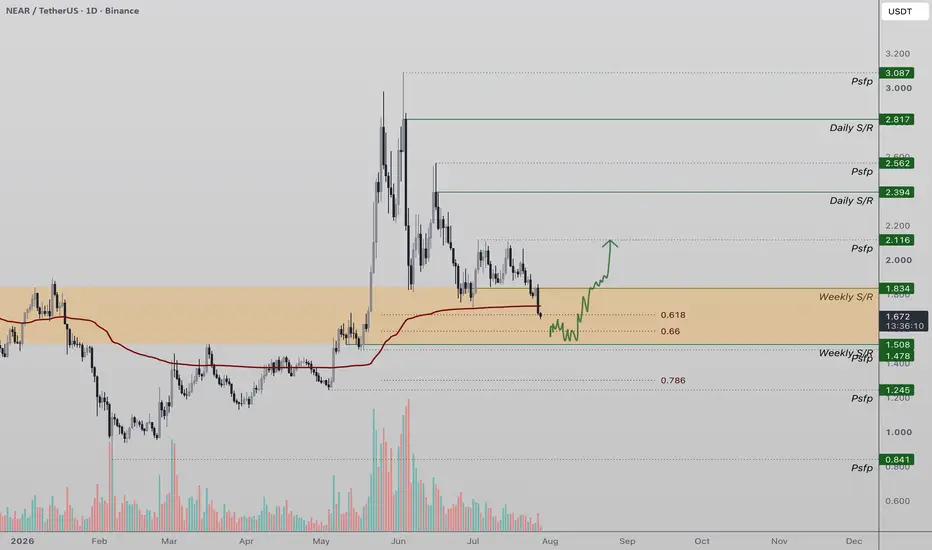
NEAR Tests Major High Timeframe Support, Reaccumulation ?NEAR is approaching a significant high timeframe support zone around the $1.50 level, an area that is supported by strong technical confluence. This region aligns closely with the local 0.618 Fibonacci retracement, creating a high-probability demand zone where buyers may begin stepping back into the market. When multiple technical indicators converge at the same price level, the likelihood of a meaningful market reaction increases.
Following the recent correction, price is now testing an area where the broader trend has an opportunity to stabilise. Rather than expecting an immediate reversal, traders should look for the formation of a higher low, which would indicate that buyers are beginning to absorb selling pressure and regain control of the market.
A bottoming structure remains the key confirmation needed before a sustained rally can develop. This could include a period of consolidation, multiple successful retests of support, or a shift in market structure through higher highs and higher lows on the lower timeframes. These signals would suggest that re-accumulation is taking place before the next impulsive move higher.
If buyers successfully defend the $1.50 support and confirm a higher low, the probability increases for a rotational move towards the next major resistance around $2.39. Until then, this remains a critical technical zone where market participants will be watching closely for signs that the correction has ended and the broader bullish trend is ready to resume.
In-depth trading ideas
Near Protocol NEAR price analysis and H&S targetCRYPTOCAP:NEAR continues to impress with its price structure.
Corrections remain controlled, while buyers continue defending key support levels.
Compared to our previous analysis, we're raising our preferred long-term accumulation zone.
👉 We now see $1.51–1.61 as the most attractive area to build a position.
From a risk-to-reward perspective, this range offers one of the best opportunities if the broader bullish scenario remains intact.
👨💻 There is also a more conservative approach.
Wait for OKX:NEARUSDT to break above $2.85 and successfully hold that level.
Yes, you'll likely miss part of the move.
But you'll also gain much stronger confirmation that a new uptrend is underway.
Ultimately, it comes down to your investment style.
🚀 One thing is becoming increasingly clear:
Near Protocol deserves to be on the watchlist.
The chart suggests that buyers are gradually bringing interest back into the project.
🎆 Because of that, we've even added one final long-term impulse target:
$10.40.
It's an ambitious objective, but if the next crypto cycle unfolds as expected, it no longer feels impossible.
💬 Do you think #NEAR has already started a new long-term uptrend, or will the market offer one last buying opportunity before moving higher?
______________
◆ Follow us ❤️ for daily crypto insights & updates!
🚀 Don’t miss out on important market moves
🧠 DYOR | This is not financial advice, just thinking out loud
NEAR USDT SHORT SIGNAL#153. NEAR/USDT – Trade Setup (SHORT)
📈 Position Type: SHORT
🕒 Timeframe: 1H
📊 Market: Futures
💰 Entry Zone:
1.660
🛑 Stop-Loss:
1.715
🎯 Take-Profit Targets:
• TP1: 1.628
• TP2: 1.593
• TP3: 1.559
• TP4.1.515
Tp5. 1.457
⚙️ Leverage:
5 *10
▫️ After TP1, move SL to Entry + 0.2%.
▪️ Exit Plan:
• 40% at TP1
• 20% at TP2
• 20% at TP3
10% at. Tp4
10% at TP5
📌 Risk Management:
Risk only 1–2% of your capital per trade.
⚠️ Always check and confirm the setup on your chart before entering the trade.
Trading Plan: NEAR/USDTSetup Overview:
A local upside expansion to fill the key imbalance and deliver price into the premium Point of Interest (POI), followed by a swift mark-down toward higher-timeframe demand.
Key Execution Phases:
Upper POI Test ($1.714 – $1.740):
An impulsive push into the 1.414 – 1.618 Fibonacci extension zone to rebalance the Key Imbalance and interact with the DC line.
Primary Mark-Down Phase:
A strong seller rejection from the resistance zone, triggering a sequential breakdown of local support levels.
Primary Target (HTF Demand):
Price delivery into the lower POI ($1.500 – $1.560) to test buyer volume and sweep accumulated sell-side liquidity.
Idea Invalidation:
A structural break and acceptance above $1.865 completely invalidates the bearish bias.
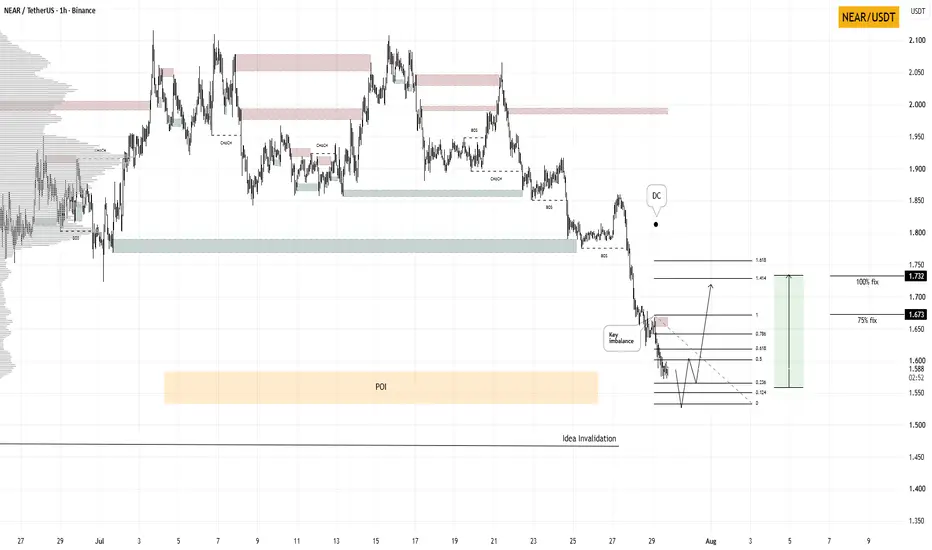
NEAR/USDT: 4H POI Reaction & 1.414 Fib TargetMarket Context & SMC Mechanics:
NEAR has delivered directly into our 4H POI. On its way down, price left a Key Imbalance above, which now serves as the primary upside liquidity target.
Execution Strategy:
We are waiting for a clear local reversal confirmation pattern inside the POI before executing. Profits will be secured in partials as price expands toward upper targets.
Entry: Confirmation inside POI (~1.550 – 1.589)
TP 1 (75% Fix): 1.673 (Key Imbalance fill / 1.0 Fib)
TP 2 (100% Fix): 1.732 (1.414 Fib External Expansion)
Idea Invalidation: Break and close below ~1.485
NEAR 4H – Sharp Break Below Range Into Trendline SupportNEAR on the 4H timeframe is currently trading around 1.971 after a sharp breakdown on July 25 that cut through the 1.780–1.860 range support and dropped into a low near 1.620–1.640, with price now attempting a recovery back toward the broken range from below while the descending trendline sits just overhead near 1.660–1.680.
The chart shows price ranging between 1.780–1.860 as the floor and 2.050–2.100 as the ceiling from early July through July 24, holding that structure consistently for nearly four weeks. A descending trendline originates from the late June low near 1.760 and slopes downward into the 1.620–1.640 area currently, having caught the July 25 spike low before price recovered sharply. The 1.780–1.860 horizontal zone that acted as the range floor throughout July has now flipped to resistance following the breakdown, and a secondary horizontal level near 1.680–1.700 sits just above the trendline as an additional reference. Price has recovered from the 1.620–1.640 spike low and is currently pressing back toward the 1.780–1.860 broken support zone from below.
The speed and depth of the July 25 breakdown followed by an equally sharp recovery creates an ambiguous picture — the move pierced the trendline on a wick but has not yet reclaimed the broken range support, leaving the structure in a transitional state.
Key Levels To Watch
→ 2.050–2.100 Prior range high, major resistance above
→ 1.960–1.980 Minor resistance, mid-range reference
→ 1.860–1.880 Upper broken range support, now resistance
→ 1.780–1.800 Lower broken range support, key reclaim level
→ 1.680–1.700 Horizontal reference, minor support
→ 1.620–1.640 Descending trendline and spike low, support below
→ Below 1.580 Extended breakdown territory, no clear support
A confirmed 4H close back above 1.780–1.800 and a hold above the broken range floor would suggest the July 25 breakdown was a liquidity sweep rather than a structural break, reopening a move toward 1.860–1.880 and potentially back toward the 2.050–2.100 range high.
A rejection at 1.780–1.800 and a return toward the descending trendline near 1.620–1.640 would confirm the breakdown as structural, and a close below that level would open extended downside toward 1.580 and below with no clear support visible.
Sharp breakdown followed by sharp recovery, reclaim of broken range now the key test. Reclaim 1.780–1.800 on confirmed close → breakdown invalidated, eyes on 1.860–2.050. Reject here → structure remains broken, retest of 1.620–1.640 trendline open. Bias neutral pending reclaim. Shift bullish only on confirmed close back above 1.780–1.800.
NEAR: local squeeze with $2.343 destinationThe Macro Picture 🗺️
NEAR unwound from the $3.085 macro ceiling and has spent the summer basing, holding $1.867 above the $1.744 local low. Price is coiling in the lower half of the range with the floor intact — a base rebuilding, not a breakdown.
The Setup ⚙️
The Range Floor 🟢
$1.744 (Local Low) is the demand shelf, with $1.129 (Macro Support) as the deeper backstop. The local low has held through July, and that's the base this range pivots on.
The Decision Point 🔴
$2.401 (Local High) is the gate. A daily close above it flips the local structure bullish; the $2.343 measured-move target sits just under it as the first objective.
The Roadmap 🛣️
Hold above $1.744 → push $2.343 → break $2.401. Invalidation is a clean daily close below $1.744 — that breaks the range.
This is a GRID Range Play: a defined band to rotate, buying the lower half and scaling out into the breakout.
More setups in profile.
#NEAR #NEARProtocol #crypto #trading #TA #3Commas #GRID
NEAR: Coiling for Its Next Move?Range continues to hold
NEAR remains trapped between the $1.72 support and $2.11 resistance, which has now had 3 previous attempts to break, with neither side able to take control. Price is continuing to coil within this range ahead of its next decisive move.
Moving averages provide support
The 100/50-day EMAs remain bullishly crossed, with price repeatedly pulling back into these rising averages. This keeps the broader structure constructive while the lower boundary of the range holds.
Momentum remains neutral
RSI continues to chop around the 50 level, reflecting the lack of clear direction. StochRSI is sitting just above oversold territory, but has yet to produce a convincing bullish momentum shift.
Volume remains subdued
Volume has declined throughout the consolidation, showing limited conviction from both buyers and sellers. A meaningful breakout will likely need to be supported by a clear expansion in volume.
Key levels to watch
A break and close above $2.11 would strengthen the bullish case and shift the focus towards $2.56, followed by the $3.08 high. A loss of $1.72 would instead increase the likelihood of a move back towards the key $1.50 breakout and retest zone.
In Summary
NEAR remains locked between $1.72 support and $2.11 resistance, with price continuing to coil around the rising 100/50-day EMAs. Neutral momentum and declining volume reflect the current lack of conviction, but the broader structure remains constructive while support holds. A break above $2.11 would favour a move towards $2.56 and potentially $3.08, while a loss of $1.72 would shift the focus back towards the important $1.50 support zone.
Nice 4H bullish candle close and Ready to take offI think Near is ready to take Off after close a clean 4h bullish candle and make corrective move to it's recent support Zone. I personally hunt the nice 4.5 R Trade but you can adjust when market move.
As always Disclaimer On, use proper Risk money management. Trading is a risky and you can lose all of your money if not educate well.
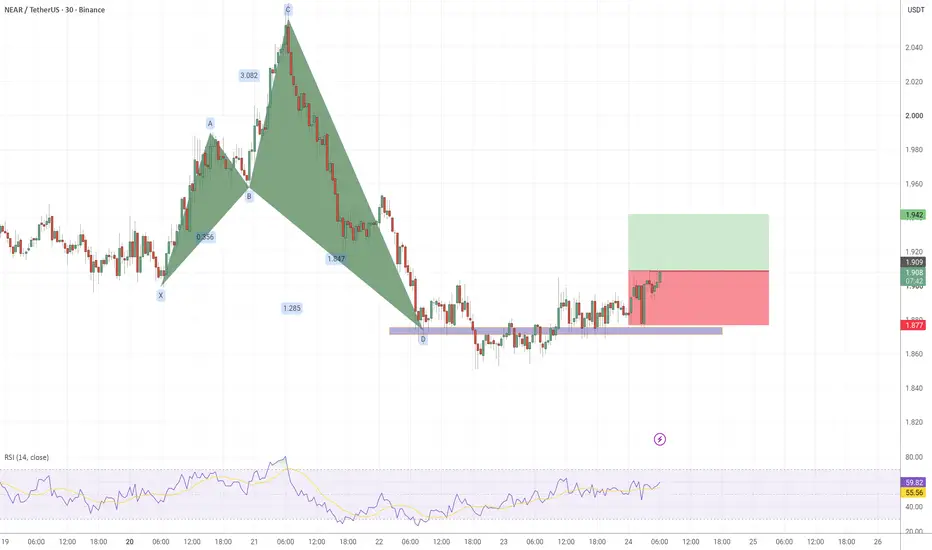
NEAR USDT LOMG SIGNAL#103. NEAR/USDT – Trade Setup (LONG)
📈 Position Type: LONG
🕒 Timeframe: 1H
📊 Market: Futures
💰 Entry Zone:
1.932
1.878
🛑 Stop-Loss:
1.850
🎯 Take-Profit Targets:
• TP1: 1.997
• TP2: 2.064
• TP3: 2.113
• TP4: 2.213
⚙️ Leverage:
5 *
▫️ After TP1, move SL to Entry + 0.2%.
▪️ Exit Plan:
• 40% at TP1
• 20% at TP2
• 20% at TP3
20% at. TP4
📌 Risk Management:
Risk only 1–2% of your capital per trade.
⚠️ Always check and confirm the setup on your chart before entering the trade.
NEARUSDT NEARUSDT | 1H Timeframe
NEARUSDT is currently ranging between 1.897 and 1.941.
As long as the price remains within this range, it's better to wait patiently. A trading opportunity may arise after a confirmed breakout and confirmation (such as a retest or a strong candle close) of either boundary.
- Breakout and confirmation above 1.941: Bullish (Long) scenario.
- Breakout and confirmation below 1.897: Bearish (Short) scenario.
As always, apply proper risk management and money management before entering any trade. This is not financial advice—always do your own analysis.
NEAR USDT SHORT SIGNAL#142. NEAR/USDT – Trade Setup (SHORT)
📈 Position Type:
🕒 Timeframe: 1H
📊 Market: Futures
💰 Entry Zone:
1.635
🛑 Stop-Loss:
1.7
🎯 Take-Profit Targets:
• TP1: 1.594
• TP2: 1.543
• TP3: 1.493
• TP4: 1.440
⚙️ Leverage:
5*10
▫️ After TP1, move SL to Entry + 0.2%.
▪️ Exit Plan:
• 40% at TP1
• 20% at TP2
• 20% at TP3
20%. at. TP4
📌 Risk Management:
Risk only 1–2% of your capital per trade.
⚠️ Always check and confirm the setup on your chart before entering the trade.
NEARUSDT: Key Imbalance Formed | 1.414 External Expansion TargetMarket Context & Order Flow
On the 15-minute timeframe, NEAR has established a distinct institutional market structure shift. Following a liquidity hunt into discount arrays, a key imbalance has been formed, confirming the presence of strong institutional buying pressure and an aggressive shift in Order Flow.
Technical Highlights:
Imbalance Confirmation: The recent impulsive move left a clear price inefficiency (imbalance), validating our local POI.
Fibonacci Confluence: The order delivery is engineered to target premium liquidity pools above the recent swing highs.
Execution Plan:
We are anticipating a sustained bullish expansion directly toward the 1.414 external Fibonacci expansion level, offering a projected ~7.32% move from the current structural accumulation zone.
Position management will be executed strictly in accordance with institutional key levels as the trade develops.
🚀 Boost this idea if you agree with the analysis, and feel free to share your thoughts in the comments below!
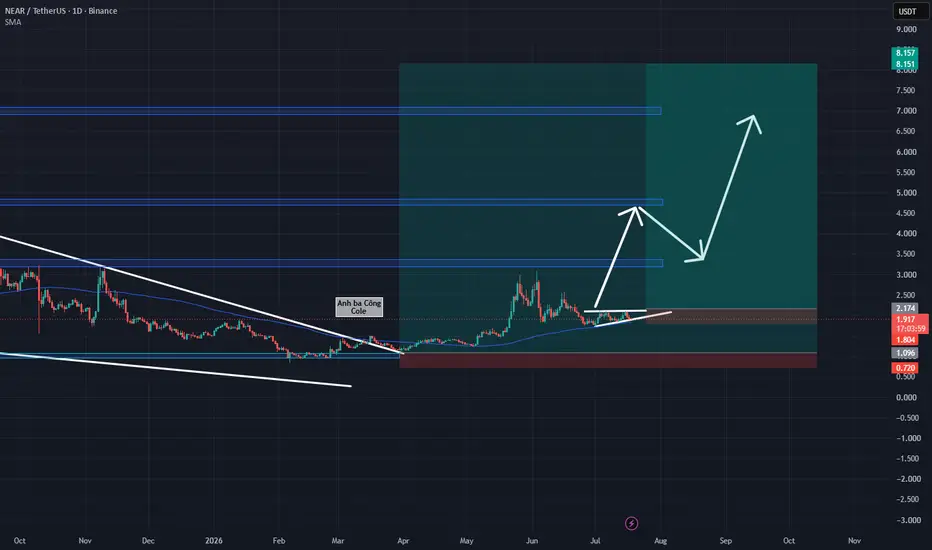
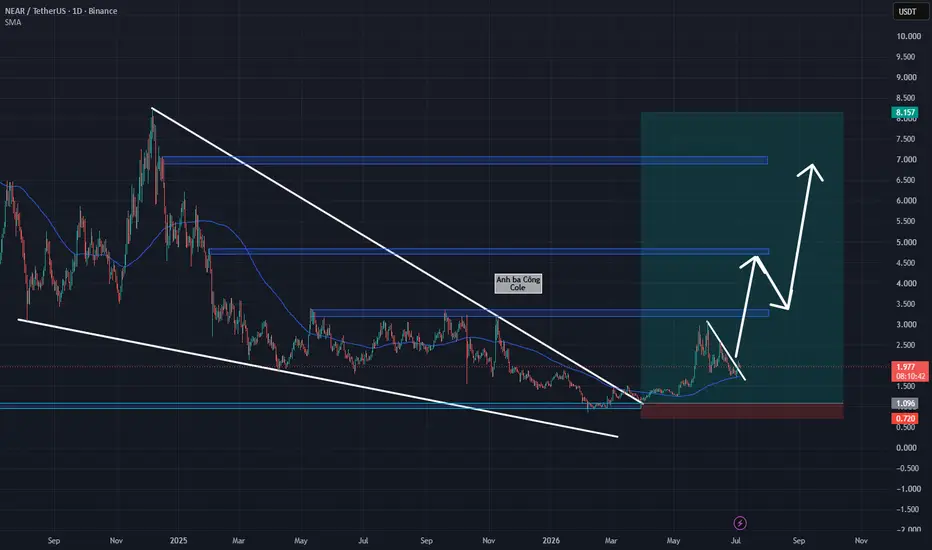
NEAR: Sustaining a Solid Bullish StructureNEAR: Sustaining a Solid Bullish Structure – High-RR Long Opportunity Within the Technical Compression
NEAR is displaying impressive intrinsic strength, continuing to advance precisely in line with the established upward trajectory from our previous analysis. Following its successful break and firm consolidation above the dynamic MA100 moving average line, the asset's market structure has officially registered a textbook sequence of higher highs and higher lows. This consistent price action signals that the buyers are completely dictating the macro direction.
Observing the visual data from the daily chart , after locking in a local peak near the $3
.08 milestone, the price action decelerated into an accumulation phase. The price is currently structuring a tight compression triangle directly on top of the dynamic MA100 support baseline. The formation of this consolidation pattern at such a strategic technical location reflects steady buying interest, proving that supply is depleted and the bulls are gathering momentum for the next expansion leg.
Consequently, this compressed price cluster opens up an excellent window to proactively establish an additional trend-following Long position. This trade setup secures a major edge by allowing for a very tight stop-loss placement just beneath the lower boundary of the triangle to safeguard capital, while optimizing the risk-to-reward (RR) parameters to a highly lucrative level as it targets overhead objectives.
Disclaimer: This is not financial advice, DYOR.
Trading Idea NEAR/USDT Long— Breakout above resistance and trendline consolidation, with a confirmed close above the daily MA50. The setup is based on the expectation of an uptrend continuation.
— Entry: $2.08 — Market buy order
— Stop: $2.00
— Target: $2.40
Risk per trade: 0.4% of the total deposit
Position size: 12% of the total deposit
RR 1:4.5
NEAR USDT SHORT SIGNAL#61.NEAR/USDT – Trade Setup (SHORT)
📈 Position Type: SHORT
🕒 Timeframe: 1 H
📊 Market: Futures
💰 Entry Zone:
1.918
1.992
🛑 Stop-Loss:
2.040
🎯 Take-Profit Targets:
• TP1: 1.878
• TP2: 1.826
• TP3: 1.769
• TP4: 1.701
TP5:
TP6:
⚙️ Leverage:
5-
⚠️ After reaching TP1, move Stop-Loss to Entry Price.
📌 Risk Management:
Risk only 1–2% of your capital per trade.
Always confirm the setup on your chart before entry
NEAR USDT SHORT SIGNALNEAR/USDT – Trade Setup (SHORT)
📈 Position Type: SHORT
🕒 Timeframe: 1 H
📊 Market: Futures
💰 Entry Zone:
1.990
2.050
🛑 Stop-Loss:
2.083
🎯 Take-Profit Targets:
• TP1: 1.941
• TP2: 1.878
• TP3: 1.826
• TP4: 1.768
TP5: 1.70
TP6:
⚙️ Leverage:
5-10
⚠️ After reaching TP1, move Stop-Loss to Entry Price.
📌 Risk Management:
Risk only 1–2% of your capital per trade.
Always confirm the setup on your chart before entry
NEAR Approaches Key SupportNEAR is currently correcting after rejecting from the Point of Control (POC), the highest-volume trading level within the previous range. Following this rejection, price is now approaching a significant area of technical confluence that could determine the next major move.
The key region to watch is the 0.618 Fibonacci retracement, which sits in close confluence with an important weekly support level and the Value Area Low (VAL). This combination creates a high-probability demand zone where buyers may attempt to regain control if price reaches the area.
As long as price action remains above this regional support, the broader outlook continues to favor a rotational move back toward higher resistance levels. A bullish reaction from this confluence would suggest that the current decline is simply a healthy correction within the broader trading range, increasing the probability of another move toward the Point of Control and the range highs.
However, failure to hold this support region would weaken the current structure and increase the likelihood of a deeper corrective move.
For now, NEAR is approaching one of the most important technical zones on the chart. How price reacts around the 0.618 Fibonacci, weekly support, and Value Area Low will likely determine whether buyers can resume the uptrend or whether further downside is required before a sustainable reversal can develop.
NEAR: correction stalls at the $2.0 decisionThe Macro Picture 🗺️
NEAR ran to a $3.0 structural peak in late May, then rolled into a steady correction that carried price back to a $1.75 June low. The bounce off that low has stalled at $2.0, and RSI has flattened right at the neutral 50 line — a market that has stopped falling but hasn't committed to a recovery. This $2.0 shelf is the pivot that decides whether the correction is basing or merely pausing before another leg lower.
The Setup ⚙️
The Reaction: Price found a floor at $1.75 and reclaimed $2.0, but the bounce lacks momentum — RSI drifting sideways rather than driving up. Buyers have stabilized the tape without yet wresting control, leaving both sides live at the decision.
The Trigger: The box resolves on a break of its edges — a reclaim of the $2.2 decision opens the path to the $2.4 supply and the upper correction range, while a loss of the $1.85 shelf puts the $1.75 low back in play. Until one gives, price rotates in between.
The Roadmap: Primary target on a bullish resolution sits at $2.4 — the June lower high, where the green roadmap points if buyers clear $2.2. Invalidation: a sustained 1D close below $1.75 would break the structure and open a deeper flush toward the $1.5 macro support.
Optimal Long Position Setup to Ride the Primary Bullish Wave
NEAR has just flashed a highly potent trend shift signal, marking the dominant return of the bulls. After establishing an impressive growth rally from the $1.09 base to a short-term peak of $3.05, the market underwent a healthy technical correction, forming a temporary descending trendline. However, the selling pressure officially dried up as the chart tapped into a rock-solid foundation.
Based on the visual data from chart, the moment the price retested the critical $1
.717 support area—which perfectly coincides with the MA100 trend moving average line—significant buying demand immediately stepped in. This strong rejection tail drove the price to completely break out above the short-term descending trendline, officially reinstating the market structure back into its original primary bullish momentum.
This structural breakout is a classic technical confirmation that buyers have completely regained control of the field. This presents an ideal window to establish a buy (Long) position to capture the next upward wave. The major benefit of this trade setup is that it offers a highly optimized risk-to-reward ratio, allowing us to position a tight stop-loss right underneath the MA100 line to protect capital in the safest manner possible.
Disclaimer: This is not financial advice, DYOR.