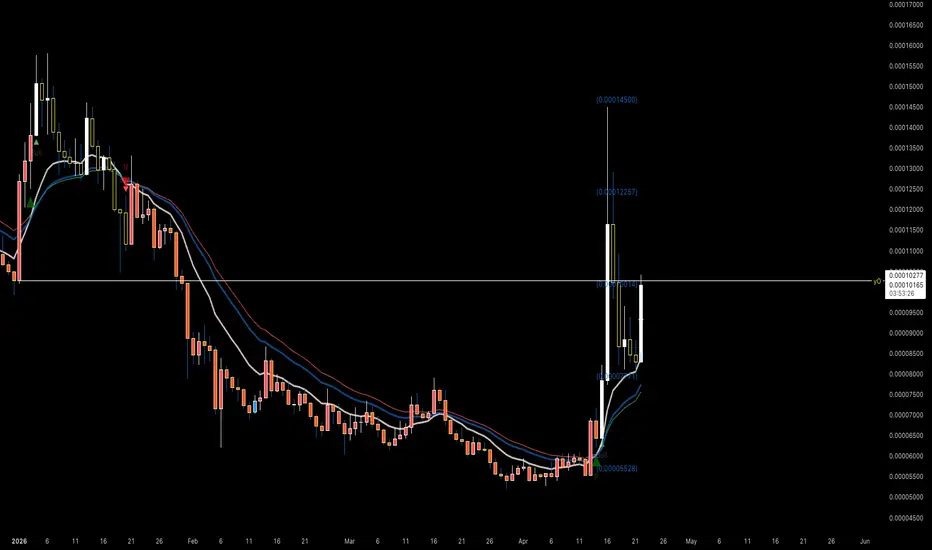
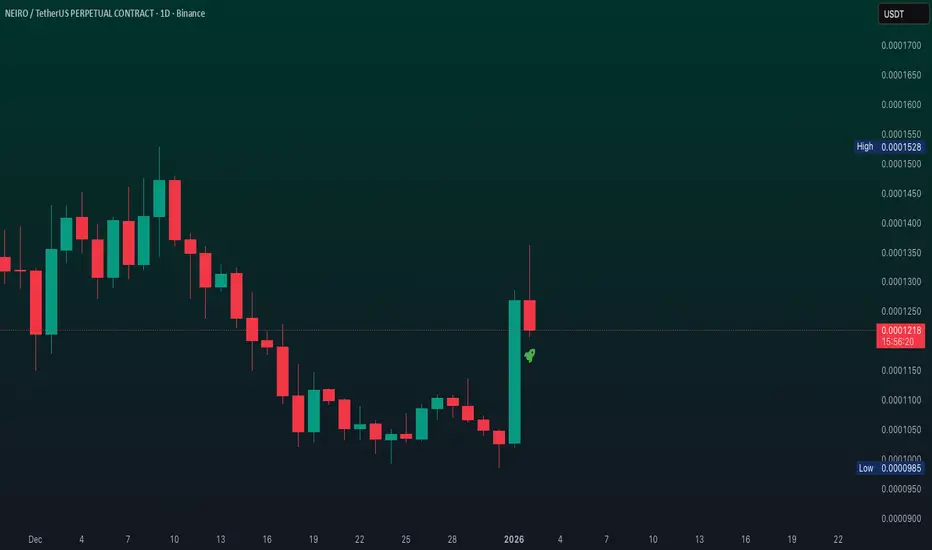
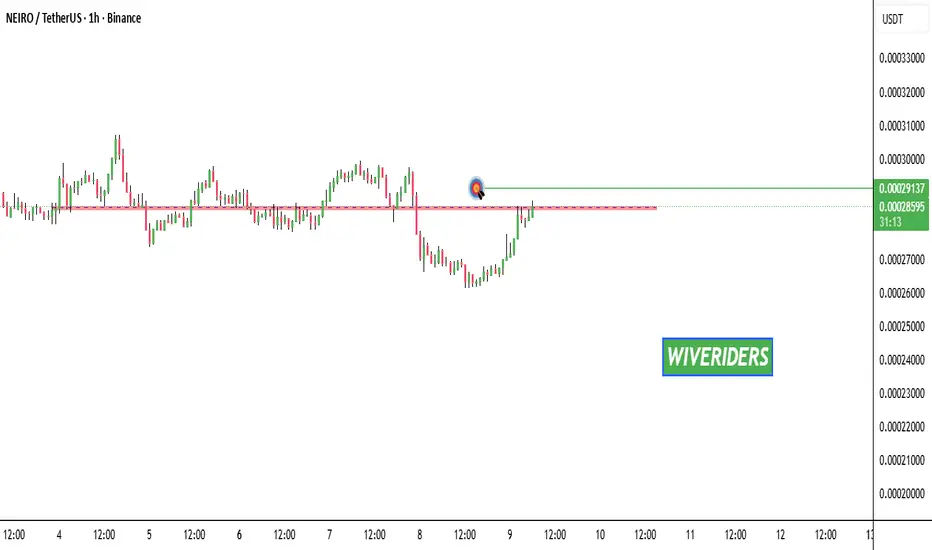
NEIRO at a Turning Point, Bull Flag Breakout or Breakdown?📊 Technical Analysis — CRYPTOCAP:NEIRO / USDT
⏳ Time Frame: 1D
📈 Pattern: Bull Flag
💵 Current Price: around 0.00009323 USDT
---
🟢 Pattern Overview — Bull Flag
The chart shows a clear Bull Flag formation following a strong upward impulse. After the initial rally, price entered a downward-sloping consolidation channel, characterized by:
🔺 Upper Trendline: Acting as dynamic resistance, currently around the 0.000093–0.000095 area.
🔻 Lower Trendline: Acting as dynamic support and helping main
In-depth trading ideas
NEIRO Descending Wedge Breakout & RetestNEIRO has broken out of its descending wedge, with price now retesting the breakout area. This is a key decision zone.
If the breakout is successfully defended and price sustains above the current demand area, the next major objective is the key resistance around 0.00007663. A decisive break above that level could open the way for a much larger bullish expansion toward the HTF supply zone around 0.00037–0.00044.
The setup remains bullish while the invalidation level at 0.00004431 holds.
Proba
NEIROUSDT Descending Trendline Under Pressure! Breakout Coming?📊 Technical Analysis
💵 Coin: CRYPTOCAP:NEIRO / #NEIRO
⌛ Time Frame: 4D 🕯️
📉 Pattern: Descending TrendLine / Long-Term Downtrend 📐🔻
🎯 Key Resistance: 0.00007750 → 0.00010200 → 0.00015200
🏆 Major Resistance: 0.00020950 → 0.00031000 → 0.00055300
🟡 Current Price Area: around 0.00006682
---
📐🔻 Descending TrendLine — Pattern Overview
🔻 NEIRO is still trading below the Descending TrendLine, which has been pressuring price since the previous high.
📉 This trendline indicates that every upward move
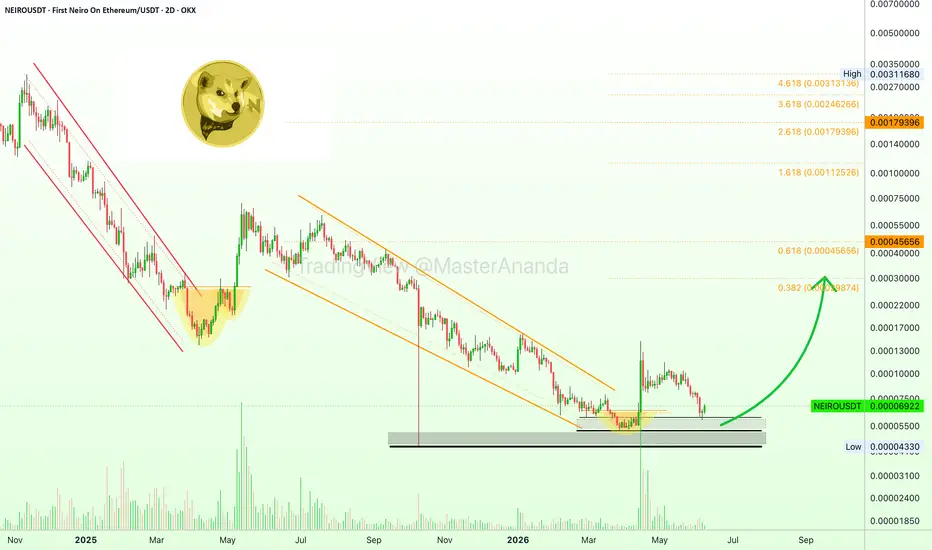
First Neiro on Ethereum: Easy 335% & 1,530% Long-TermHigher lows tend to lead to higher highs, and this simple fact alone, shown here through a sequence of candle patterns on a chart, opens for us the opportunity to secure a nice and easy 335% profits-trade. That is, the main resistance level that NEIROUSDT will hit as the continuation of the bullish move that started with the 29-March low, sits at $0.00029 and this gives us total profits potential of 335%.
The first move already produced +180% in a matter of days. The initial bullish breakout, t
First Neiro on Ethereum prepares for a new bullish waveNEIROUSDT looks right and ready for a new bullish wave. I shall described the classic price behavior and candles pattern that is present on this chart.
After a major low and also higher low vs the October 2025 flush, NEIROUSDT produces its first bullish jump as the initial bullish breakout. This move can be verified as the real deal due to really high volume. Real deal in the sense that it signifies the start of a new trend, an uptrend, a bull market.
Bullish conditions are confirmed because t
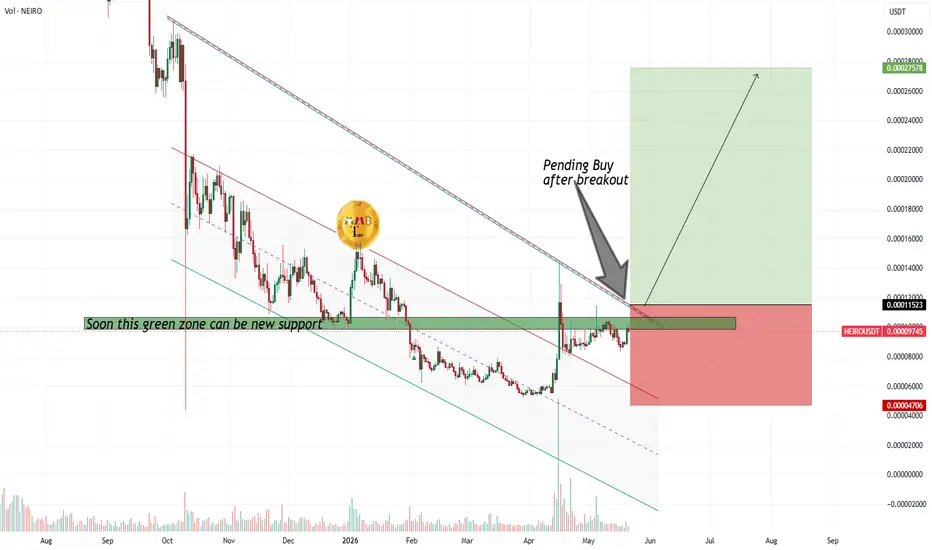
Neiro upcoming pump will cook only after a breakoutNEIRO has moved down from the falling trendline and may enter a short-term bearish or ranging phase. However, the anticipated direction remains bullish, with an expected breakout above the trendline. A pending buy order has been placed above the trendline, as shown on the chart, to capture the subsequent upward move.
Current Market Structure
NEIRO is currently trading below a key falling trendline. The price has pulled back from this resistance, suggesting a period of consolidation or minor
Neiro Big chance ahead (++MASSIVE PUMP++)NEIRO has broken above its previous descending channel, establishing a slightly bullish market structure. Rather than rushing to enter, a pending buy order is set above the next trendline resistance. A confirmed second breakout above that level would trigger a long entry, targeting a high-volume, substantial upward move.
Current Market Structure:
NEIRO has successfully broken out of its prior descending channel, signaling a potential shift from bearish to early bullish momentum. The price
NEIRO still maintains a bullish structure !First of all you should know that this is a volatile meme coin so do not forget risk management when taking a position
After a bullish change of character NEIRO has made a strong move upward and still maintains a bullish swing structure so we are looking for buy long positions at support zones
We are watching the swap zone as a key support area to enter buy long positions with controlled risk and it is better to scale in using DCA in this zone
Targets are marked on the chart take partial prof
23-04-26 Neiro, Stop guessing where the market is going"Stop trading like a gambler. Stop guessing where the market is going. Here is how you can actually start reading the charts like the institutions do."
"Most retail traders get trapped by looking at the same old support and resistance lines. But have you ever wondered why your stop loss gets hit just before the price goes in your direction? It’s not bad luck—it’s liquidity. The market is designed to hunt your stop losses before making its real move."
"I’ve been analyzing the NEIRO/USDT pair usin
NEIROUSDT.P: short setup from daily support at 0.00008208The setup on this chart looks highly promising. The breakdown could have happened yesterday, but buyers managed to hold the price above the support. However, instead of a bounce, we got consolidation: thanks to this delay, the BINANCE:NEIROUSDT.P has built up even more energy for a strong downward move.
The level has been tested and confirmed multiple times. This makes the setup completely transparent from a risk management perspective — the placement for the stop-loss is absolutely obvious a
First Neiro On Ethereum breaks out of bear market (PP: 1,600%)The first target on NEIROUSDT is $0.000459 with a total of 596% profits potential. This is the easy target and the one we are aiming for on the initial part of this bullish move.
Some projects are growing 8,000% in a matter of weeks. Others 4,000% and so on.
When we consider 400-600% as the target for the first move of this bullish wave we are being truly conservative, and I believe you already know how this works. When the action starts in full force, what tends to happen is the market moving
NEIRO – Broadening Wedge Inside Macro Descending ChannelNEIRO is trading inside a large descending channel on the higher timeframe, clearly respecting lower highs and lower lows within a structured bearish trend.
Inside that macro channel, price has formed a Descending Broadening Wedge. Unlike a falling wedge that compresses, this one is expanding, meaning volatility is increasing while still trending downward. That usually signals unstable structure and repeated liquidity grabs on both sides.
Current Position
Price is sitting near the lower half
NEIRO such a low price here can cause 6xNEIRO/USDT has experienced a prolonged bearish trend over recent years, with price now consolidating at a critical technical confluence. This zone combines a major daily support level, a long-term trendline support, and a potential all-time low (ATL) region—representing a significant multi-layered support structure.
Such a convergence often precedes a strong corrective or reversal move. From a technical perspective, a sustained hold above this area could initiate a substantial recovery.
Given
NEIRO/USDT at Critical Level – Breakout or Continue the Sell-OffNEIRO/USDT on the Daily (1D) timeframe remains in a medium- to long-term downtrend. Since the previous peak, price has consistently formed lower highs and lower lows, confirming strong bearish control. Currently, price is trading below a well-respected descending trendline, which continues to act as a major dynamic resistance.
---
Pattern Explanation
The dominant structure on the chart is a:
Descending Trendline / Bearish Market Structure
The descending trendline connects multiple lower hi
NEIRO WHALES ACCUMULATING🔥 Fortune AI Radar — CRYPTOCAP:NEIRO
Fresh activity detected on CRYPTOCAP:NEIRO today.
Data suggests increasing market interest & buyers stepping in.
Technicals currently lean bullish, with momentum trending upward.
Whales showing hints of accumulation and hype rising among traders.
NEIRO/USDT — Accumulation Before an Explosion or a Deeper Fall?NEIRO is currently sitting at a critical juncture that could define the next major move. The 2D timeframe structure shows a Descending Triangle pattern that’s tightening — a sign that selling pressure remains dominant, yet buyers are starting to show strong defense around the main demand area.
---
📊 Technical Overview
Primary trend: Mid-term downtrend with consecutive lower highs since early 2025.
Main Demand Zone: 0.00019 – 0.00015, a strong accumulation area that has repeatedly held again
NEIRO on Reversal Watch #NEIRO
The price is moving within a descending channel on the 1-hour frame and is expected to break and continue upward.
We have a trend to stabilize above the 100 moving average once again.
We have a downtrend on the RSI indicator that supports the upward break.
We have a support area at the lower boundary of the channel at 0.00033500, acting as a strong support from which the price can rebound.
We have a major support area in green that pushed the price upward at 0.00032700.
Entry price:
NEIRO/USDT — Bullish Reversal Setup or Bearish Continuation?🔑 Key Takeaways
NEIRO/USDT is currently sitting at a critical demand zone between 0.00030–0.00044. This area has acted as a strong defensive level for buyers, preventing deeper declines multiple times in recent months.
While the macro trend remains bearish, the recent structure shows a consolidation phase (sideways range), which could either become a base for a relief rally or a continuation pattern for another leg down.
The market stands at a crossroad: Will buyers push for a breakout, or wi