SHOP | Weekly Bullish, Daily Flip Zone DecidesBy analyzing the #SHOP (Shopify) chart, we can see a market where the weekly has already made its decision and the daily is deciding when.
1W Timeframe
Weekly chart:
The recovery from the 2022 lows was built internally — an i CHoCH , then repeated i BOS . In 2025 price broke the external swing high and printed a real CHoCH above CAD 220 . Internal breaks say a correction is progressing. An external break says the trend has changed hands.
Two protected lows frame the risk: CAD 33.26 external, CAD 99.87 internal — the working invalidation. Between them sits the weekly Order Block at CAD 123.03 – CAD 136.88 , which price returned into, reacted from, and rallied out of. That reaction is why the case is live.
Above, the resting liquidity at CAD 252.59 is the objective. Price is at CAD 178.41 — a correction inside an intact uptrend.
1D Timeframe
Daily chart:
Price ran out of the weekly block, printed a daily CHoCH , swept CAD 252.59 , and rolled over. It has now arrived at the Daily flip zone (CAD 155.69 – CAD 185.95) — resistance through July and August, support now — trading in the upper third of it.
The weekly says the direction. The daily says when.
The Bias
Bullish while price holds above CAD 99.87.
Scenario A. The flip zone holds and price continues toward CAD 252.59 . I want confirmation on the daily close first — an MSS from inside the zone, or a decisive bullish engulfing. A touch of the top edge is not a reaction.
Scenario B. Price works toward CAD 155.69 before turning. Same trade, better price.
Scenario C. A close beneath CAD 155.69 puts the weekly Order Block back in play as the deeper entry — not an invalidation.
Invalidation: a decisive close beneath CAD 99.87 .
And the rule: a break is a candle close, not a wick.
Fundamental Backdrop
Q2 2026 revenue of $3.58 billion , up 34% year over year, net income up 66%, margin expanding to 42%. AI-referred orders nearly 13x higher with conversion around 50% above organic search. Bernstein initiated at Outperform, Piper Sandler raised to $180, consensus near $171.
The counterweight: the stock fell nearly 8% in one session in early September on rotation out of high-multiple growth names — despite those earnings. P/E near 87 , down roughly 21% year to date.
A company compounding revenue in the thirties, repriced for multiple rather than performance. That is what produces a retracement this deep into structure — and why the confirmation matters more than the level.
This analysis will be updated as the market evolves.
Best Regards, BigBeluga 🐳
Shopify, Inc. Class A
No trades
No trades
In-depth trading ideas
SHOP - Reversal Strategy Long Setup
🍀Overview
I am not a discretionary technical analyst, so I rely on predefined setups rather than subjective chart analysis. I built the rules into a strategy to make the decision-making process more systematic.
This setup occurred before the strategy was developed. The trade is documented retrospectively and will be followed until the strategy exits or a discretionary exit is executed according to predefined rules.
🍀Process
Ticker : NASDAQ:SHOP
Date : 11/03/2025
Timeframe : Daily
Direction : Long
Strategy : Reversal Strategy
Strategy Overview : Overview: A Reversal Strategy for Trading on the Daily Timeframe
Strategy Chart : Please refer to the 2nd screenshot
Signals
Main signal: RSI Signals crossed above 30, indicating an exit from the oversold zone. This contributed a score of 0.5
Confirmation signal: NATR Oscillator reached 92.04, exceeding the required threshold of 80. This contributed a score of 0.5
Signal Scoring
Main signal score = 0.5
Confirmation signal score = 0.5
Long setup score = Main signal score + Confirmation signal score = 0.5 + 0.5 = 1.0
Long score threshold: 1.0
The long setup score met the required threshold. The strategy therefore placed a long bracket order.
Risk Management
Reward-to-risk ratio: 4:1
Entry: 92.95 (the close of the setup candle)
Stop distance: 26.39 (approximately 4x daily ATR)
Target distance: 105.60 (approximately 16x daily ATR)
Order Management : Bracket order
Limit entry: 92.95
Market stop: 66.56
Limit target: 198.55
Baseline
Assume the worst has already happened: the stop loss has been reached.
🍀Outcome
Trade Execution
11/03/2025: The daily candle closed, triggering the strategy to place a long bracket order.
13/03/2025: Price reached the trigger level, and the long entry filled.
Trade Status
Trading: active
P.S. I’m currently applying this strategy to the Nasdaq-100. Let me know which stock you’d like me to look at next.
Stay lucky!🍀
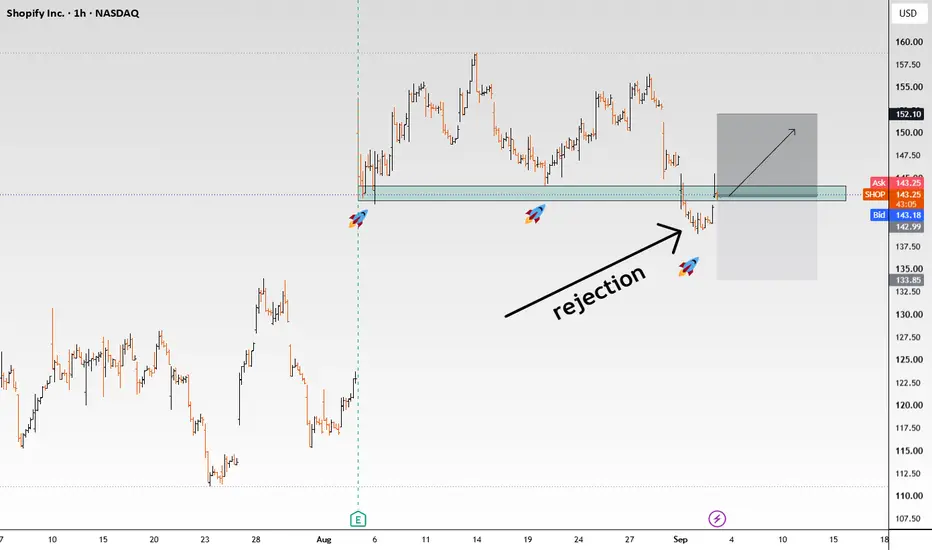
Shopify — 160 Pullback Before the Bigger Move Toward 250📈 Shopify — Strategic Pullback Before the Next Major Upside Leg
Shopify is presenting an interesting bullish setup, but the projected path is not a straight-line advance. The current analysis suggests that price may first retrace toward the 160 region, creating a deeper corrective phase before the larger upward movement develops.
The 160 area is therefore an important part of the roadmap. Rather than interpreting the projected decline as a complete change in direction, this scenario views it as an intermediate retracement within a broader bullish thesis. Once this phase is completed and the market regains upward traction, Shopify could begin a much stronger expansion toward the 250 target zone.
The key feature of this setup is the sequence of the move:
Current price action → retracement toward 160 → bullish transition → major expansion toward 250.
From a technical perspective, the anticipated pullback could provide the market with an opportunity to reset before another substantial advance. The reaction around 160 will therefore be an important area to monitor, as the subsequent price behavior can determine how quickly the larger bullish leg develops.
The broader outlook for Shopify can also be influenced by e-commerce growth, consumer spending, merchant activity, technology-sector sentiment, interest-rate expectations, and developments across global equity markets. These variables can affect volatility and timing, while the projected technical roadmap remains centered on the 160-to-250 sequence.
The larger objective is 250, but the route toward that destination may begin with a temporary move lower. This distinction is important: the projected dip does not necessarily invalidate the bullish thesis; instead, it forms part of the expected market structure.
📍 Initial Pullback Area: 160
📈 Overall Bias: Bullish
🔄 Expected Intermediate Move: Downward retracement
🚀 Major Upside Objective: 250
🎯 Projected Roadmap: 160 → 250
The setup is built around patience with the broader direction — first the anticipated retracement toward 160, then the potential bullish expansion toward 250.
SHOP: When an AI assistant becomes the main salespersonShopify started as a website builder for online stores, but today it is building Agentic Commerce – an ecosystem where the Sidekick AI assistant writes product descriptions, sets up ads, and sells goods directly inside ChatGPT, Google Gemini and Microsoft Copilot chats. The company trades on Nasdaq, and everyone who understands that controlling the entry point to commerce in the age of generative AI is more valuable than any algorithm is watching.
Fundamentals
The next earnings report is due in July 2026. On May 5 the company reported first quarter results. Revenue grew 34 percent to 3.17 billion dollars, beating estimates. Merchant solutions revenue jumped 39 percent. Free cash flow reached 476 million dollars with a 15 percent margin, and operating profit doubled to 382 million. Gross Merchandise Volume hit 101 billion dollars – the second consecutive quarter above 100 billion. The balance sheet holds 5.8 billion dollars in cash.
Sidekick showed explosive growth: the number of stores using it rose 385 percent, and over 12,000 custom apps have been built with its help. The platform launched Agentic Storefronts, allowing products to be sold directly inside AI chats. AI-driven traffic grew 8 times, and AI search orders increased nearly 13 times. Together with Google, the company introduced the Universal Commerce Protocol – an open standard for AI commerce.
Guidance for the second quarter calls for revenue growth of 27 to 29 percent, down from 34 percent in Q1. After the report shares fell 16 percent because the market had expected a more aggressive upgrade.
Risks
Gross margin contracted from 49.5 to 48.8 percent year over year due to faster growth of lower-margin merchant solutions and higher AI infrastructure costs. The CEO and other top executives sold millions of dollars worth of shares in late 2025 and early 2026. The Canada Revenue Agency is demanding access to seller data. A class action lawsuit in California was partially dismissed but not entirely. In Europe, GDPR complaints are brewing. A large portion of traffic depends on Google, and after six quarters of acceleration, revenue growth is slowing.
Technicals
On the two-week chart, price is moving inside an ascending channel. The active buying zone is located in the 85-87 dollar range, where the chart shows a confluence of the MA100, the 0.786 Fibonacci retracement, and a fair value gap – a classic golden pocket. Targets from the chart: first target 157 dollars, and after a confirmed breakout above that level, the second target is 290 dollars.
Shopify remains a technically undervalued asset with a long-term bullish structure. The post-earnings correction is bringing price closer to the only accumulation zone. The risks are already priced in. The golden pocket is holding, and the targets are above .
Shopify’s Pullback Holds Above Key Trend SupportSHOP is seeing buying interest following a retracement after breaking above the $187 level from a consolidation base. The stock remains in an uptrend, trading above both the 20-day and 50-day moving averages, which supports the prevailing bullish trend.
Shopify, Inc. is a $275bn market-cap global commerce company providing infrastructure and tools that enable businesses to start, scale, market, and operate across online and physical sales channels. Its integrated platform supports storefronts, payments, inventory and order management, fulfillment, customer relationships, analytics, financing, and other essential commerce functions through a single platform.
SHOP is a Narrow Moat company with revenue growth in each of the last three quarters and EPS growth in two of the last three quarters, with recent growth of 34% and 66%, respectively. Operating and net margins stand at 18% and 42%, while ROE and ROIC are 16% and 15%. The company also maintains a strong balance sheet, with current and debt-to-equity ratios of 5.4x and 0.01x.
Revenue and EPS are forecast to grow over the next three quarters, with next-quarter growth estimated at 37% and 40%, respectively. The average analyst target price is approximately $172.46, implying about 13% upside potential.
Shopify. Early starter on the AI channels.Possible a 30%+ growth business while becoming increasingly profitable. Q2 2026 revenue and GMV both grew more than 30%, while free-cash-flow margin reached 18%, showing meaningful operating leverage.
The bigger upside is monetization: Shopify can keep increasing payments penetration.
Selling more services to existing merchants.
Expanding into enterprise/retail, and using AI/agentic commerce to increase merchant sales and Shopify’s take rate.
Shopify is already positioning, its platform for shopping through AI channels.
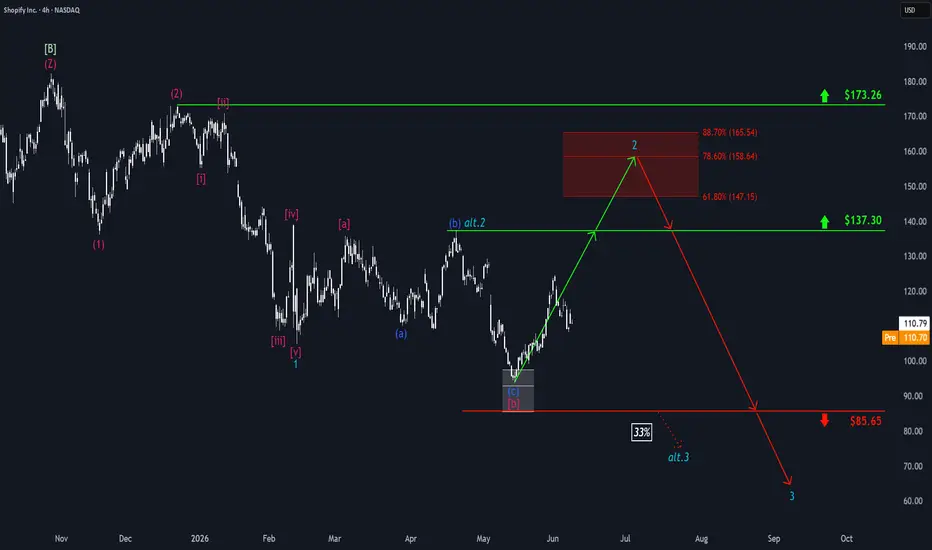
Shopify: Target Zone ReachedShopify recently developed strong upward momentum and ultimately reached our red Target Zone between $147.15 and $165.54. As the price has already started to turn lower as projected, we now consider the preceding corrective advance complete and see the stock in a downward impulse. As the next key step, this move should extend below the support at $124.62 and subsequently continue toward the lower $85.65 level. Under our alternative scenario, however, SHOP would advance above the resistance at $173.26 later on to establish another higher corrective top. We assign this scenario a probability of 37%.
SHOP Long-Term Cup & Handle BreakoutHi traders,
Technical Overview
The monthly chart for SHOP reveals a massive, multi-year Cup and Handle formation, a classic bullish continuation pattern that typically signals a significant trend reversal or extension.
The Cup: Formed between the 2021 peak and the late 2023 recovery. This deep, "U-shaped" consolidation shows a complete cycle of selling exhaustion and steady re-accumulation.
The Handle: Since reaching the resistance level near $175, the stock has entered a downward-sloping consolidation channel (the "handle"). This represents a healthy period of profit-taking and lower volatility before the next major move.The Signal: Bullish Consolidation
The stock is currently trading around $124.45. The handle is drifting downward toward previous support levels, which is exactly what technical traders look for to "shake out" weak hands before a breakout.
Key Observation: The long-term trajectory remains strongly bullish as the price stays well above the 2022-2023 lows, suggesting that the "Cup" base is solid.
Execution Plan Entry Trigger: A monthly candle close above the upper descending trendline of the handle (approx. $150) or, more conservatively, a breakout above the "rim" of the cup at $176.75.Technical Target: $300.67
This target is derived from the "measured move" of the pattern (the depth of the cup added to the breakout point).Estimated Upside: ~70.11% from the potential breakout zone.Stop Loss: A monthly close below the bottom of the handle, specifically under the $90.00 level. A break here would invalidate the immediate bullish setup.
Strategic Commentary Because this is a Monthly timeframe, this is a macro trade idea meant for long-term investors or swing traders with high conviction. The "Handle" may take several more months to fully resolve. However, if the pattern completes, the projected target of $300 would bring NASDAQ:SHOP $ back toward its historical valuation highs, supported by its dominant position in the e-commerce infrastructure space.Waiting for the breakout of the handle is essential to ensure you aren't caught in a prolonged "sideways" or "downward" grind.
SHOP | Shopify Delivers Another 30%+ QuarterShopify put worries about slowing growth to rest with a strong Q2
Revenue climbed 34% year over year to $3.6 billion, beating expectations by $140 million, while gross merchandise volume (GMV) rose 32% to $115.6 billion. Free cash flow came in at $654 million, with margins improving to 18%, up from 15% last quarter. Investors welcomed the results, sending the stock sharply higher
The strength wasn't limited to one part of the business. Growth was healthy across merchants of all sizes, different regions, and multiple sales channels. Shopify Payments accounted for 68% of GMV, up three percentage points from a year ago, while Shop Pay has now processed more than $400 billion in GMV since its launch
AI is also becoming a more meaningful driver of the business. Traffic and orders coming from AI-powered shopping experiences both tripled compared to last year. Orders placed through AI agents using Shopify's structured Catalog converted at roughly twice the rate of those relying on scraped web data. Another interesting takeaway is that 75% of AI generated orders came from outside Shopify's top 100 product categories, suggesting AI is helping smaller merchants get discovered by shoppers who might not have found them otherwise
Looking ahead, Shopify expects Q3 revenue growth in the low 30% range, comfortably ahead of the roughly 27% analysts were expecting. If achieved, it would mark the company's sixth straight quarter of more than 30% revenue growth. Management also expects free cash flow margins to improve further into the high teens to low 20% range
Just one quarter ago, investors were asking whether Shopify's rapid growth was finally fading. Q2 delivered a clear answer. Revenue and GMV continue to grow above 30%, profitability is moving in the right direction, and AI is becoming a real growth catalyst..Instead of disrupting Shopify's business, AI is starting to help merchants reach more customers and drive more sales.
SHOP: Monster Quarter Pullback – Premium Re-Entry SetupIdea: Long SHOP (Shopify Inc.)
Entry: $151.00
**Stop Loss:** $126.45
Take Profit: $201.96
**Risk/Reward:** ~1:2.2 (Risk $24.55 / Reward $50.96)
Timeframe: Swing / Position Trading (Weeks to Months)
The Setup
Shopify just delivered what President Harley Finkelstein called a "monster quarter". Q2 2026 revenue surged 34% year-over-year to $3.58 billion**, beating the $3.45 billion consensus by $130 million. Adjusted EPS of **$0.42 topped the $0.40 estimate. Gross merchandise volume (GMV) climbed **32% to $115.6 billion** — marking the fifth consecutive quarter of over 30% GMV growth.
The stock ripped over 28% premarket on August 5 and has been consolidating in the $144–$150 range. This post-earnings consolidation represents a healthy digestion phase — not a reversal — creating a compelling re-entry opportunity above the initial surge.
The Fundamentals
Revenue breakdown:
Merchant Solutions: $2.78B (+37% YoY)
Subscription Solutions: $802M (+22% YoY)
Profitability metrics:
Operating income: Rose 68% to $488M
Free cash flow: $654M at an 18% margin, up from 16% a year earlier
Operating expenses: Fell to 34% of revenue (-4 ppts YoY)
AI momentum: Sidekick AI assistant saw daily active merchants grow 3.6× YoY and daily sessions 4.8× — merchants created 36K custom apps in Q2 (vs 12K in Q1). AI traffic and orders tripled YoY, and AI Catalog converts at 2× scraped data.
Enterprise wins: Added Balmain, Guess, Avon, e.l.f. Cosmetics, Claire's, Burton, and Suitsupply in a single quarter.
Shareholder returns: Repurchased $1.42 billion of stock during the quarter.
Guidance raised: Q3 revenue growth guided to low-30% (above Street estimates of ~27%), gross profit growth mid-to-high 20s, and FCF margin high-teens to low-20s.
Analyst Backing
According to 52 analysts polled by S&P Global, Shopify has a consensus rating of "Buy" with an average price target of **$165.91**, implying **10% upside**. The range extends from $105 to $220.
Recent post-earnings upgrades (August 5-6):
JPMorgan Chase: Raised target to $185 (Overweight)
Citi: Raised target from $150 to **$196** (Buy)
Canaccord Genuity: Raised from $145 to **$180** (Buy)
ATB Cormark: Raised from $171 to **$186** (Buy)
Royal Bank of Canada: Set target to $180
Evercore ISI: Raised target to $175
Benchmark: Raised target to $170
Our **$201.96 take profit** sits below the highest Street target ($220) but above the average, representing a retracement toward the upper end of the analyst range.
Technical Setup
The stock is consolidating after a historic surge:
52-Week Range: ~$94 – $182
Current Price: ~$147 (Aug 6 close)
20-day SMA: ~$119.87 (approx.)
50-day SMA: ~$112.86 (approx.)
200-day SMA: ~$134.68
Key levels:
Support: $144–$147 (post-earnings consolidation zone and 50% Fib retracement)
Primary support: $126.45 (our stop level)
Resistance: $152–$155 (recent highs and call wall)
Major resistance: $180–$196 (post-upgrade analyst targets)
**Entry at $151** represents a **breakout confirmation** above the $147 consolidation and the first resistance zone. **Stop at $126.45** sits below the 200-day SMA ($134.68) and the 61.8% Fibonacci retracement level, offering structural protection. **Target at $201.96** aligns with the high end of analyst targets, just below the $220 Street-high.
The 1:2.2 R/R ratio provides favorable asymmetry — risking $24.55 to gain $50.96.
The Catalyst
The Q2 earnings beat on August 5 was the primary catalyst. The post-earnings consolidation represents classic profit-taking after a 28% surge — not a rejection of the thesis. The fundamental story remains intact:
GMV above +30% for five consecutive quarters — a streak that reprices a stock's multiple
AI monetization is real — traffic converting at 2× scraped data
International GMV growing 37% — law of large numbers hasn't caught up yet
Payments penetration at 68% of global GMV (up 3 ppts YoY)
$5B buyback providing a strong floor
Next catalysts:
Holiday GMV season (Q4 2026) — consensus expects $4.59B revenue (+37% YoY implied)
Agentic Storefronts — conversion rates vs. traditional storefronts
B2B scale — B2B GMV was +84% in Q4 2025
Key Risks
Valuation premium: P/E ratio of ~145x reflects premium pricing
Overvalued status: InvestingPro data places SHOP among the "Most Overvalued" stocks
Margin pressure: Subscription Solutions margins declined ~60 bps versus Q1 due to AI cloud costs
Consumer spending slowdown: Any weakness in retail could pressure GMV growth
Break below $126.45 would invalidate the support thesis
Conclusion
Shopify offers a high-probability re-entry setup on three pillars: a monster Q2 earnings beat with 34% revenue growth, 32% GMV growth (5th consecutive quarter above 30%), and raised guidance; a healthy post-earnings consolidation above key moving averages with support at $144–$147; and overwhelming institutional backing with 52 analysts maintaining a Buy consensus, an average target of $165.91, and a flurry of post-earnings upgrades pushing targets as high as $196.
Entry $151, Stop $126.45, Target $201.96 — a clean, risk-defined setup with favorable 1:2.2 asymmetry. Buying this consolidation after a historic quarter, with strong institutional backing and a beaten-down relative position (still ~15% below 52-week highs), should be well-rewarded as the stock continues its re-rating toward fair value.
⚠️ Disclaimer: This is a personal trading idea based on technical and fundamental analysis, not financial advice. Trading involves substantial risk of loss. Past performance is not indicative of future results. Always conduct your own research and risk assessment, and never risk more than you can afford to lose. Manage your position size appropriately.
Shopify surges after record resultsShopify surges after record results and reaches key levels following quarterly surprise
By Ion Jauregui – Analyst at ActivTrades
Shopify (NASDAQ: SHOP) shares posted a strong rally on Wall Street after the company reported quarterly results above market expectations, reinforcing the perception that e-commerce continues to maintain solid growth.
The stock closed the session at $201.97, after reaching an intraday high of $216, with a gain of nearly 25% following figures that increased buying interest in the company. Shopify reported quarterly revenue of $3.58 billion, a 34% year-on-year increase, while the gross merchandise volume processed through its platforms reached $115.6 billion.
In terms of earnings, the company reported adjusted earnings of $0.42 per share, exceeding market forecasts and confirming the improvement in profitability after several years focused on business expansion.
The company also presented a positive outlook for the next quarter, with revenue growth expected to be close to 30%, maintaining a high expansion rate within the technology sector.
E-commerce maintains its structural growth
Shopify’s results come at a time when digital commerce continues to gain importance within the global economy. The adoption of online channels, the growth of digital payments and the need for companies to improve their commercial capabilities continue to drive demand for this type of platform.
Shopify has evolved from a solution for creating online stores into an ecosystem that integrates business management tools, payments, data analytics and artificial intelligence-based solutions.
The sales volume generated by merchants through the platform reflects the scale achieved by the company and its position within the e-commerce market.
Technical analysis: strong bullish move after earnings release
From a technical perspective, the market reaction generated a relevant bullish breakout. The share price closed at $201.97, after reaching $216, accompanied by a significant increase in trading volume.
If the upward movement continues, the next technical reference levels are located at $237.10 and subsequently at $253.10, levels corresponding to previously observed resistance zones.
After a move of this magnitude, the price could enter a consolidation phase. In this scenario, the first support zone is located at $189.59, a level positioned above the previous candle and representing a short-term technical reference.
If the pullback extends further, the next area to monitor would be around $180.
The technical structure reflects a significant distance from the historical area of highest trading activity. The Point of Control (POC) is located at $155.46, below the current price, while the 50-session moving average stands at $172.32, acting as a dynamic reference within the recent trend.
Momentum indicators maintain a positive reading. The RSI stands at 66.44, showing buying strength without yet reaching levels considered extreme, while the MACD remains above its incremental average, confirming the improvement in momentum recorded after the earnings release.
Shopify returns to the spotlight in the technology market
Shopify’s market reaction reflects the continued importance investors place on companies capable of combining revenue growth with improved profitability.
The future evolution of the stock will depend on the company’s ability to maintain its growth rates, developments in digital consumption and competition within the technology sector, particularly with the incorporation of new artificial intelligence-based solutions.
Following the strong move after the earnings release, investors will continue to monitor price developments and the stock’s ability to consolidate the new levels reached.
*******************************************************************************************
The information provided does not constitute investment research. The material has not been prepared in accordance with the legal requirements designed to promote the independence of investment research and such should be considered a marketing communication.
All information has been prepared by ActivTrades ("AT"). The information does not contain a record of AT's prices, or an offer of or solicitation for a transaction in any financial instrument. No representation or warranty is given as to the accuracy or completeness of this information.
Any material provided does not have regard to the specific investment objective and financial situation of any person who may receive it. Past performance and forecasting are not a synonym of a reliable indicator of future performance. AT provides an execution-only service. Consequently, any person acting on the information provided does so at their own risk. Political risk is unpredictable. Central bank actions can vary. Platform tools do not guarantee success.
SHOP: Massive Ascending Wedge, Bearish Breakout Setup!Hello There,
welcome to my new analysis of SHOP from a weekly timeframe perspective. In the current stock market situation, some stocks form pivotal bearish setups which are likely to turn into bearish meltdowns, providing profitable short opportunities in the market. One of them is SHOP. The stock is forming an interesting formation which I recently spotted, providing the base for a short position to profit from falling prices.
When looking at my chart now, we can see how SHOP is forming this gigantic ascending wedge formation. Within the wedge, it has already completed the wave count. Now it broke down below the lower boundary with a massive bearish move. Below the lower boundary, it is now forming the bear flag formation, confirming the breakout and setting up the next bearish leg towards the downside.
This breakdown activated the lower target zones as seen in my chart. Given the current setup, the next bearish wave is likely to emerge in the near future. If the bearish momentum should accelerate and continue to accelerate after the target has been reached, further downside is likely to be expected. When the bearish volume increases, this will additionally confirm the bearish downside scenario.
In this manner, thank you a lot for watching!
The support is highly appreciated.
VP
SHOP: Red B Shattered! Sequence to Target C?Shopify ( NASDAQ:SHOP ) delivered a powerful response following its tap into the blue BC zone. While sellers were expected to step in and defend the red B zone to keep the broader bearish structure intact, they were completely overwhelmed. Buyers shattered the level with aggressive displacement, signaling a clear shift in control and giving the green light for this bullish sequence.
As the move unfolds, close attention must be paid to the overhead red HTF WCL zone. This higher-timeframe weekly control level is a major structural resistance area where sellers are naturally expected to re-engage and attempt to halt the advance, making it a crucial obstacle price must navigate on its upward path.
If price can successfully work through the HTF WCL zone, expectations favor the full completion of the sequence up to Target C inside the blue projection box. Monitoring price action at the HTF hurdle will be essential for managing risk as this expansion leg plays out toward its final sequence target.
$SHOP: Two Locks Overhead. 172 First, Then 183TSX:SHOP has been quietly building something. Bullish RSI divergence at the May low near 130. Price made a lower low, RSI made a higher low. That was the warning. The bounce that followed wasn't random.
Since then it reclaimed the 20, 50 and 100 EMAs one by one. Now there are two locks overhead, not one. First the 200 EMA at 171.90, testing it right now. Then the upper line of the triangle near 183. That's the real breakout level. Between the two sits the March supply zone around 175 to 180.
RSI at 61, above its average, still room before overbought. Momentum is there. Step one is a clean daily close above 172. Step two is clearing 183 with volume. That's what confirms the triangle break, not before. First tests of the 200 from below usually fail, so no rush. Rejected here and it rebuilds around 158 to 165 (EMA100).
Shop ready to break towards the highNASDAQ:SHOP
Looking at 8/21 135c at EOD assuming this doesn't completely reverse.
This looks good sitting on a high time frame trendline. It was ranging right on top of the 50% drawdown area. It dropped into a target fib area, reclaimed the range and held. It looks ready to break now. I would expect at least the top of the range near 135 if not an extension beyond.
$SHOP mapping a bearish 𝗔𝗕=𝗖𝗗 off the June 15 high.𝗦𝗛𝗢𝗣 · 𝟭𝟱𝗺 · June 21, 2026
NASDAQ:SHOP mapping a bearish 𝗔𝗕=𝗖𝗗 off the June 15 high.
𝗦𝘁𝗿𝘂𝗰𝘁𝘂𝗿𝗲
A = 114.95
B = 106.19
C = 109.66 (0.618 retrace of AB, current rejection)
D = 𝟭𝟬𝟬.𝟱𝟳 (target)
The D level is confluent two ways. It marks the 1.618 extension of the AB swing and the 2.618 reciprocal of the BC leg. Two methods, one level. That confluence is the reason the target earns attention, not the pattern name.
𝗧𝗵𝗲 𝘁𝗿𝗮𝗱𝗲 𝗶𝘀 𝗻𝗼𝘁 𝗹𝗶𝘃𝗲 𝘆𝗲𝘁.
C is an unconfirmed pivot. Price sits at 108.80, less than a point under it. A setup is not a fill.
𝗖𝗼𝗻𝗳𝗶𝗿𝗺𝗮𝘁𝗶𝗼𝗻
15m close below 𝟭𝟬𝟲.𝟭𝟵. That break opens the CD leg toward 100.57.
𝗜𝗻𝘃𝗮𝗹𝗶𝗱𝗮𝘁𝗶𝗼𝗻
15m close above 𝟭𝟬𝟵.𝟲𝟲. Above C, the pivot never formed and the short is dead.
A pattern is innocent until the level breaks. Geometry proposes. The tape confirms.
Paper analysis. No position held. Not financial advice.
𝗣𝗿𝗼𝗰𝗲𝘀𝘀 𝗼𝘃𝗲𝗿 𝗽𝗿𝗲𝗱𝗶𝗰𝘁𝗶𝗼𝗻. 𝗥𝗶𝘀𝗸 𝗳𝗶𝗿𝘀𝘁, 𝗮𝗹𝘄𝗮𝘆𝘀.
SHOP — Daily/15m — Bearish lean, level-gatedSHOP — Daily/15m — Bearish lean, level-gated
Reading the weight of evidence as down-leaning here, but gated on one level. Direct on the bias, honest on the invalidation.
BEAR CASE — confluence:
1. Structure: rejection at ~114 → lower high → break under 0.702 fib (108.54). A-B-C topping into double-top.
2. Volume: declining into the bounce — advance running on fading participation. Bearish divergence.
3. Momentum: RSI mid-range, rolling over, no confirming thrust.
TRIGGER: 15m close < 108.5 holding on volume → fib path 106.19 → 104.33.
INVALIDATION (the danger): failed-breakdown risk. Price already tested ~106 and bounced. A higher low + 108.5 holding as support flips this from a top to a base — thesis dead. Not a double-top anymore if buyers defend the level.
Net: bearish-IF-108.5-breaks, neutral until confirmed. Structure-anchored, not a prediction. The level decides.
Not financial advice.
Shopify: Moved Higher, Then SlippedShopify was recently able to achieve further gains but then lost its footing and slipped noticeably lower. Only recently did the first signals to the upside begin to emerge again. We currently see SHOP in a corrective upward movement, which should fade in our red Target Zone ($147.15–$165.54). After that, the price should continue the ongoing downward impulse and initially move below the support at $85.65. In our alternative scenario, SHOP would no longer reach the red Target Zone but would instead sell off directly below the support at $85.65 (probability: 33%).
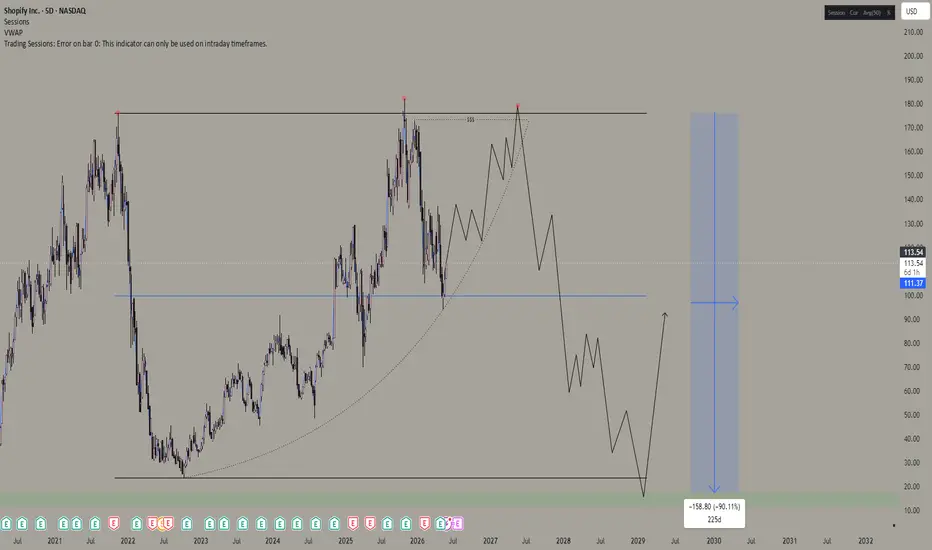
Shopify - Potential 90% drop ???Shopify is showing a clean macro liquidity curve that could be developing into a much larger distribution model.
If this structure confirms with a clear HTF bearish close / structural breakdown , the downside potential could be brutal — possibly even a 90% macro reset from the highs.
I know that sounds extreme, but these models don’t confirm overnight.
They build slowly while the crowd still believes the story.
For now, I’m not calling the top .
I’m watching the liquidity curve, the HTF structure, and whether SHOP starts confirming the distribution instead of continuation.
Ranges of this size are not to be ignored.
Shopify long tailed monthly candleNASDAQ:SHOP is forming a long tailed monthly candle, historically that has indicated a trend reversal
* 115 will be a big resistance as 50DSMA and 100WSMA are present there and about to cross
* looking for it to test the upper descending trendline at 124 ish which also lines up with 100DSMA
---------
Shopify has been lagging the market despite great earnings and guide
Being a Canadian native company also helps it somewhat