NEOUSDT — Bear Flag Signals Another Leg Down?📊 Technical Analysis 🔍
💵 Coin: NASDAQ:NEO / #NEO 🪙
⌛ Time Frame: 8H ⏰
📉 Pattern: Bear Flag / Bearish Continuation Pattern 🏳️🔻
🎯 Potential Target: -8.60% 📉💥
📍 Current Price: around 1.844 USDT 💰
🔻 Key Support: around 1.786 USDT 🛡️
🟨 Resistance / Sell Zone: around 1.89 – 1.93 USDT 🚧📉
---
📉🏴 BEAR FLAG PATTERN 🔻📐
📌 NEO/USDT appears to be forming a Bear Flag after experiencing a sharp decline from the previous area. 📉💨
🏳️📐 The flag structure is characterized by an upward-sloping channel, with price forming limited higher lows and higher highs. 📈↗️
⚠️ However, the upward movement inside the channel still appears to be a consolidation after the decline, rather than a confirmed bullish reversal. 🔄📉
🔻 As long as price remains below the major resistance, this structure still has the potential to develop into a bearish continuation pattern. 🚨📉
---
🔴📉 BEARISH SCENARIO — PRIORITY 🐻⚠️
📉 If price fails to break and hold above the 1.89–1.93 area, sellers could potentially regain control. 🔴💪
⬇️ A breakdown of the lower trendline support would be an important confirmation that the Bear Flag is breaking down. 📐💥
🎯 The initial target could move back toward the 1.786 USDT area. 📍⬇️
📉🔥 If selling pressure increases, the pattern projection indicates a potential decline of around -8.60% from the breakdown area. 🎯💥
⚠️ Confirmation: An 8H candle close below the support/channel would strengthen the bearish confirmation. 🕯️🔻
---
🟢🚀 BULLISH SCENARIO — INVALIDATION ⚠️📈
🚀 If price successfully breaks above the upper channel resistance, the bearish scenario could begin to weaken. 📈💥
📈 If the 8H candle closes strongly above the 1.89–1.93 area, the Bear Flag could experience a failed breakdown / bullish invalidation. 🟢🚨
🔥 Such a breakout could open the possibility of a retest toward higher resistance levels, particularly around 1.97–2.05 USDT. 🎯📈
⚠️ Until a breakout is confirmed, the upward movement inside the channel should still be considered a relief rally, rather than a valid reversal. 🔄👀
---
🧩🔍 KEY CONCLUSION 📊
🔻 The Bear Flag remains the main structure on the chart. 🏴📉
📉 The bearish bias will become stronger if the lower trendline is broken. 💥⬇️
🎯 Potential pattern projection is around -8.60%. 📉📐
🟨 The 1.89–1.93 area is an important resistance zone to watch. 🚧👀
🟢 The bearish scenario will be INVALIDATED if price successfully breaks out and closes strongly above the upper channel resistance. 🚀📈
---
⚡🎯 KEY LEVELS TO WATCH 👀
🔴 Bearish Trigger: Lower trendline breakdown 📉💥
🟨 Resistance Zone: 1.89–1.93 🚧
🔻 Key Support: 1.786 🛡️
🎯 Pattern Target: Around -8.60% 📉
🟢 Bullish Invalidation: Break & close above the upper channel 🚀
> ⚠️ Key Level: Watch the breakout — either the lower trendline breaks for bearish continuation, or the upper resistance breaks and invalidates the Bear Flag. 👀📉📈
---
#NEO 🪙 #NEOUSDT 📊 #Crypto 🚀 #CryptoAnalysis 🔍 #TechnicalAnalysis 📉 #BearFlag 🏴 #BearishPattern 🔻 #BearishContinuation 📉 #PriceAction 📐 #CryptoTrading 💰 #Altcoins 🚀 #NEOAnalysis 🔎 #TradingSetup 🎯 #MarketAnalysis 📊
In-depth trading ideas
neousdt longInstructions:
Entry point: yellow
Stop loss: red
Take profit: green
👉Leverage x 5-10-20 for crypto
👉Leverage x 20-50-100 for commodities, stocks, indices, and forex
👉Margin 1-5% max.
Always practice risk and money management.
Invest a maximum of 5% on any trade or across all your trades.
Invest only what you can afford to lose, as no one is in control of the market.
👉Our analyses are primarily based on:
breakouts: two trend lines (ascending and descending) and a line indicating a horizontal breakout.
chart patterns: shoulders and head, triangle parttern, elliott impulse, etc etc.
We don't always have the time to track them at all times or to represent them visibly, given the numerous signals, the number of channels to manage, and especially because of the often rapid pace of market movements.
indicators: We associate at least two indicators with this technique.
👉Depending on the circumstances, we use specific indicators, often setting 3 or more take profit levels.
👉Indeed, there are good days in trading and also bad days. No one can promise to win every trade, and like all traders worldwide, we also experience stop-loss orders. However, we win more than we lose and remain positive.
👉You can close the position before or after the take profit orders indicated by the green lines if you are personally satisfied; the same applies to stop loss orders.
👉We must stay positive, clear-headed, and humble.
we cannot provide all instructions or all trades here on this channel.
Good luck to us all, and may God guide us. Amen.
#NEOUSDT is back at its historical demand zone!#NEO
The price is moving within a descending channel on the 1-hour timeframe and has reached the lower boundary. It is now poised for a bounce and is expected to retest this boundary.
The Relative Strength Index (RSI) indicates a downward trend, which is likely to continue given the overbought conditions.
There is a key support zone in green at 1.70, and the price has bounced off this zone several times, making it a strong support level.
The price is trending towards the 100-period moving average, which we are approaching. This trend supports an upward move.
Entry Price: 1.82
Target 1: 1.85
Target 2: 1.88
Target 3: 1.92
Stop Loss: At the resistance zone in green
Remember this simple rule: Money management.
Any questions? Please leave a comment.
Thank you.
NEO / NEOUSDT Long Setup | Breaker Block ReclaimMARKET ANALYSIS
NEO is currently reacting from a key technical area highlighted on the chart.
As long as the protected support zone remains intact, the bullish market structure remains valid and higher liquidity targets may continue to attract price action.
A breakdown below the invalidation level would weaken the current bullish scenario and require a reassessment of market conditions.
📍 Entry, Stop Loss and Take Profit levels are marked directly on the chart.
━━━━━━━━━━━━━━
⚠️ DISCLAIMER
This publication is provided solely for educational and market observation purposes.
Nothing contained in this analysis should be considered financial advice, investment advice, or a recommendation to buy or sell any financial instrument.
All trading and investment decisions remain solely the responsibility of the individual trader.
Always conduct your own research and apply proper risk management before entering any position.
━━━━━━━━━━━━━━
🎯 PARALOG
▪️Crypto Market Analysis
▪️BTC Futures Signals
▪️Bitcoin & Altcoin Market Analysis
Precision • Momentum • Timing
━━━━━━━━━━━━━━
Exchange: #MEXC Futures
#bitcoin #btc #crypto #futures #technicalanalysis
Long Swing Trade for #NEO/USDT | 12H TFLong Swing Trade for #NEO/USDT | 12H TF
NEO/USDT is trading inside a long-term Falling Wedge and is currently rebounding from the lower support trendline. Price is attempting to reclaim the wedge resistance, while selling pressure continues to weaken. A confirmed breakout above the descending trendline could trigger a bullish move toward the next key resistance levels.
Fundamental: NEO is a Layer-1 blockchain focused on building a smart economy through digital assets, digital identity, and smart contracts.
Entry: 1.96 – 1.82
Target 1: 1.990
Target 2: 2.009
Target 3: 2.038
Target 4: 2.058
Mid-Term Holding: 2.155
Risk Management: Book partial profits at each target.
After TP1, move SL to Entry.
After TP2, move SL to TP1.
SL: 1.76
NEO / NEOUSDT Bullish Setup | Futures Trade IdeaMARKET ANALYSIS
NEO is currently reacting from a key technical area highlighted on the chart.
As long as the protected support zone remains intact, the bullish market structure remains valid and higher liquidity targets may continue to attract price action.
A breakdown below the invalidation level would weaken the current bullish scenario and require a reassessment of market conditions.
📍 Entry, Stop Loss and Take Profit levels are marked directly on the chart.
━━━━━━━━━━━━━━
⚠️ DISCLAIMER
This publication is provided solely for educational and market observation purposes.
Nothing contained in this analysis should be considered financial advice, investment advice, or a recommendation to buy or sell any financial instrument.
All trading and investment decisions remain solely the responsibility of the individual trader.
Always conduct your own research and apply proper risk management before entering any position.
━━━━━━━━━━━━━━
🎯 PARALOG
▪️Crypto Market Analysis
▪️BTC Futures Signals
▪️Bitcoin & Altcoin Market Analysis
Precision • Momentum • Timing
━━━━━━━━━━━━━━
Exchange: #MEXC Futures
#bitcoin #btc #crypto #futures #technicalanalysis
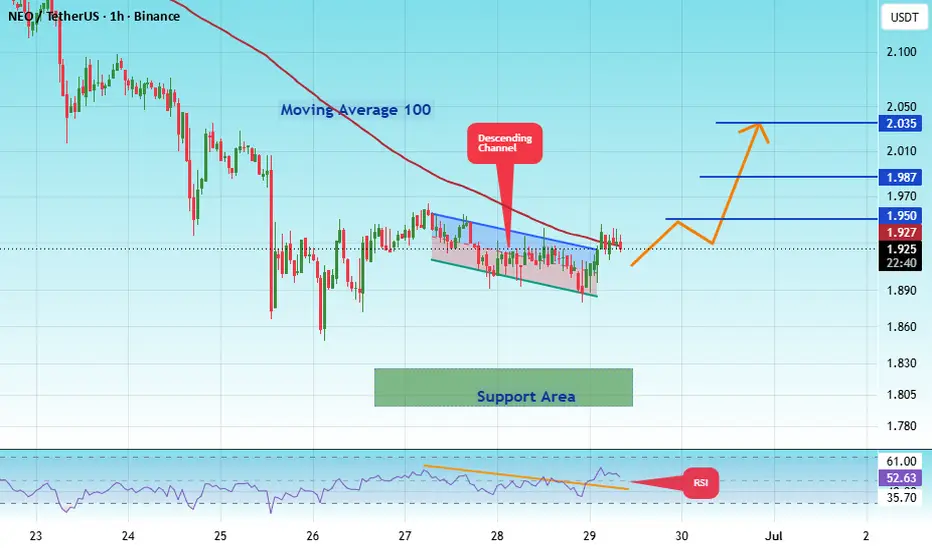
#NEOUSDT is back at its historical demand zone!#NEO
The price is moving within a descending channel on the 1-hour timeframe and has reached the lower boundary. It is now poised for a bounce and is expected to retest this boundary.
The Relative Strength Index (RSI) indicates a downward trend, which is likely to continue given the overbought conditions.
There is a key support zone (in green) at 1.80, and the price has bounced off this zone several times, making it a strong support level.
The price is trending towards the 100-period moving average, which we are approaching. This trend supports an upward move.
Entry Price: 1.92
Target 1: 1.95
Target 2: 1.98
Target 3: 2.03
Stop Loss: At the resistance zone (in green)
Remember this simple rule: Money Management.
Any questions? Please leave a comment.
Thank you.
NEOUSDT - Bear Flag, Preparing for a Breakdown or a Rebound?📊 On the 2-hour timeframe, NEOUSDT remains in a well-defined downtrend, characterized by a sequence of Lower Highs (LH) and Lower Lows (LL). After a sharp decline (Flagpole), the price is now moving gradually higher within an Ascending Channel, forming a classic Bear Flag pattern. 🚩
📉 A Bear Flag is a bearish continuation pattern. The current upward movement inside the channel appears to be a retracement (relief rally) rather than a genuine trend reversal.
⚠️ At the moment, the price is still trading within the channel and has not produced a convincing bullish breakout. As long as the price remains below the channel resistance, sellers are likely to stay in control.
---
📐 Bear Flag Pattern Explanation
🔻 Flagpole
- 📉 The strong bearish impulse created the Flagpole, indicating aggressive selling pressure and strong bearish momentum.
📈 Flag
- The price is gradually climbing inside an Ascending Channel.
- 📊 During the formation of the flag, both volume and momentum typically weaken, suggesting that the current rally is only a temporary pullback.
🚨 Bearish Confirmation
- ✅ A valid bearish signal will occur if the price breaks down below the channel support with a strong candle close.
- 📉 Such a breakdown could trigger another bearish continuation move in the direction of the previous Flagpole.
---
🟢 Bullish Scenario
✅ A bullish outlook will only be confirmed if:
🟢 The price successfully breaks above the upper channel resistance with a strong candle close.
📊 The breakout is supported by increasing trading volume.
🔄 The previous resistance is successfully retested and turns into new support (Successful Retest).
🎯 If these conditions are met, the price could continue toward higher resistance levels, and the Bear Flag would be considered invalid (Bear Flag Failure).
---
🔴 Bearish Scenario
📉 The bearish scenario remains the primary expectation as long as the price continues trading inside the channel.
🚨 Bearish confirmation occurs if:
❌ The price loses the channel support.
📉 A candle closes below the support level.
📊 The breakdown is accompanied by increasing trading volume.
🎯 If the breakdown is confirmed, the price may continue its decline toward the following support levels:
🎯 1.895 USDT
🎯 1.875 USDT
🎯 1.850 USDT
📌 These levels represent key support zones and could become the next downside targets once the Bear Flag is confirmed.
---
📌 Conclusion
📉 As long as the price remains inside the Bear Flag, the overall market structure stays bearish.
📊 The current upward movement still appears to be a retracement within a larger downtrend, meaning sellers continue to maintain control.
⏳ Traders should wait for either a confirmed breakout or breakdown before making trading decisions, as the current price action still represents a consolidation phase.
💡 "The trend is your friend until it bends."
⚠️ For now, the trend continues to favor the bears until proven otherwise.
---
#NEOUSDT #NEO #BearFlag #BearishContinuation #TechnicalAnalysis #CryptoAnalysis #PriceAction #SupportResistance #AscendingChannel #Breakdown #BullishScenario #BearishScenario #Altcoins #CryptoMarket #RiskManagement #ChartAnalysis #Trader
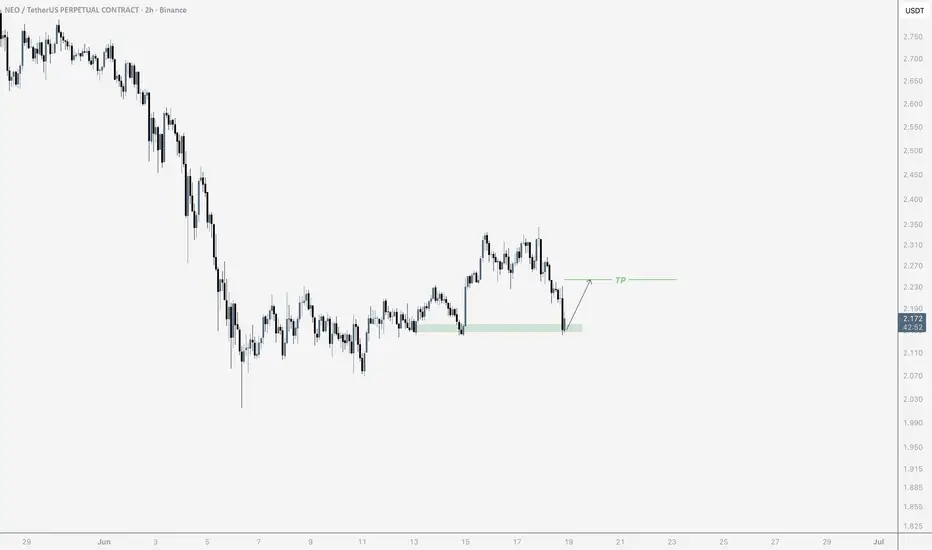
$NEO 2H📊 On the 2-hour timeframe, the price is currently sitting near a bottom zone. However, due to the overall market sentiment, I still expect further downside, so a major rally seems unlikely.
🎯 A move toward the marked zone could still be considered.
⚠️ Only consider an entry if the price shows a positive reaction to the specified level. Otherwise, I don't recommend entering the trade.
Neousdt shortInstructions:
Entry point: yellow
Stop loss: red
Take profit: green
👉Leverage x 5-10-20 for crypto
👉Leverage x 20-50-100 for commodities, stocks, indices, and forex
👉Margin 1-5% max.
Always practice risk and money management.
Invest a maximum of 5% on any trade or across all your trades.
Invest only what you can afford to lose, as no one is in control of the market.
👉Our analyses are primarily based on:
breakouts: two trend lines (ascending and descending) and a line indicating a horizontal breakout.
chart patterns: shoulders and head, triangle parttern, elliott impulse, etc etc.
We don't always have the time to track them at all times or to represent them visibly, given the numerous signals, the number of channels to manage, and especially because of the often rapid pace of market movements.
indicators: We associate at least two indicators with this technique.
👉Depending on the circumstances, we use specific indicators, often setting 3 or more take profit levels.
👉Indeed, there are good days in trading and also bad days. No one can promise to win every trade, and like all traders worldwide, we also experience stop-loss orders. However, we win more than we lose and remain positive.
👉You can close the position before or after the take profit orders indicated by the green lines if you are personally satisfied; the same applies to stop loss orders.
👉We must stay positive, clear-headed, and humble.
we cannot provide all instructions or all trades here on this channel.
Good luck to us all, and may God guide us. Amen.
Neousdt long Roddy01-SIGNALSPROVIDER Instructions:
Entry point: yellow
Stop loss: red
Take profit: green
👉Leverage x 5-10-20 for crypto
👉Leverage x 20-50-100 for commodities, stocks, indices, and forex
👉Margin 1-5% max.
Always practice risk and money management.
Invest a maximum of 5% on any trade or across all your trades.
Invest only what you can afford to lose, as no one is in control of the market.
👉Our analyses are primarily based on:
breakouts: two trend lines (ascending and descending) and a line indicating a horizontal breakout.
chart patterns: shoulders and head, triangle parttern, elliott impulse, etc etc.
We don't always have the time to track them at all times or to represent them visibly, given the numerous signals, the number of channels to manage, and especially because of the often rapid pace of market movements.
indicators: We associate at least two indicators with this technique.
👉Depending on the circumstances, we use specific indicators, often setting 3 or more take profit levels.
👉Indeed, there are good days in trading and also bad days. No one can promise to win every trade, and like all traders worldwide, we also experience stop-loss orders. However, we win more than we lose and remain positive.
👉You can close the position before or after the take profit orders indicated by the green lines if you are personally satisfied; the same applies to stop loss orders.
👉We must stay positive, clear-headed, and humble.
we cannot provide all instructions or all trades here on this channel.
Good luck to us all, and may God guide us. Amen.
neousdt longInstructions:
Entry point: yellow
Stop loss: red
Take profit: green
👉Leverage x 5-10-20 for crypto
👉Leverage x 20-50-100 for commodities, stocks, indices, and forex
👉Margin 1-5% max.
Always practice risk and money management.
Invest a maximum of 5% on any trade or across all your trades.
Invest only what you can afford to lose, as no one is in control of the market.
👉Our analyses are primarily based on:
breakouts: two trend lines (ascending and descending) and a line indicating a horizontal breakout.
chart patterns: shoulders and head, triangle parttern, elliott impulse, etc etc.
We don't always have the time to track them at all times or to represent them visibly, given the numerous signals, the number of channels to manage, and especially because of the often rapid pace of market movements.
indicators: We associate at least two indicators with this technique.
👉Depending on the circumstances, we use specific indicators, often setting 3 or more take profit levels.
👉Indeed, there are good days in trading and also bad days. No one can promise to win every trade, and like all traders worldwide, we also experience stop-loss orders. However, we win more than we lose and remain positive.
👉You can close the position before or after the take profit orders indicated by the green lines if you are personally satisfied; the same applies to stop loss orders.
👉We must stay positive, clear-headed, and humble.
we cannot provide all instructions or all trades here on this channel.
Good luck to us all, and may God guide us. Amen.
Neo · Ten years of experience summed up; The market cycle & NEO Conventional wisdom says a bear market unravels 2.5 faster than a bull market, and this is understandable for many reasons. Profit taking is not the same as building a position. But, truly, this information is based on the stock market, the Cryptocurrency market is new so this wisdom can hardly apply and we see here why.
The inverse is true. The previous bull market lasted over a year while the bear market is a really long one, but it depends how you look at it.
If the bear market is taken to end in May 2022 or December 2022, then both the bear and bull markets of the past are of equal length. If we take the entire period after 2021 to be a bear market, then we have a prolonged one, but this would be a faulty conclusion.
December 2022 through December 2024 was a bullish period, higher highs and higher lows, regardless if total growth was below our expectations. Our expectations are no mandate for the market, the market does what it wants.
I was of the belief that certain patterns must be followed, that certain things must happen based on certain assumptions and beliefs. As it happens with most of everyone, time and experience proved all of my assumptions wrong. What does put pressure on the market are the times, the present moment; what is happening in your surroundings, with us, the world, politics and such, the human mind.
If we are going through a good period, it will be reflected on the market regardless of the past. If we are going through a bad period, as humans, a collective, as a civilization, as a unit or group, then it will be reflected on the market. There are big and small permutations of these variables.
Sometimes the dynamics of the Cryptocurrency market, our own small group, will become immune to the rest of the world and express its own tendencies. At other times, the world events will be highly consequential to everything we say, think, belief and do in relation to the price, state and health of the projects we buy, hold, exchange and trade.
What I am trying to say is that nothing is set in stone, everything is open to change at all times and there is nothing certain. This is my conclusion after more than a decade reading, tracking, following and reviewing these things.
My belief might say that the market must go down because I saw it going down in the past, yet the market goes up. And I agree with the latter part.
Many people think and understand that the Cryptocurrency market must go through some deep pain, even more; why? Because they saw it happen before.
You know what? I've seen the market grow. So my belief is that it must grow because I've seen it before... Just kidding... Everything I share is not based on experience but rather based on the charts.
NEOUSDT is going up.
Namaste.
#NEOUSDT is back at its historical demand zone!#NEO
The price is moving within a descending channel on the hourly timeframe. It has reached the lower boundary and is trending towards a bounce. A retest of this boundary is expected.
The Relative Strength Index (RSI) indicates a downward trend, and this trend is likely to continue due to the overbought condition.
A key support zone (in green) has been found at 2.50. The price has bounced off this zone several times, making it a strong support level.
The price is trending towards the 100-period moving average, which we are approaching. This trend supports an upward move.
Entry Price: 2.70
First Target: 2.76
Second Target: 2.83
Third Target: 2.90
You can close at the second target or wait for the third target to be reached. The choice is yours.
Stop Loss: At the resistance zone (in green).
Remember this simple rule: Money Management.
Any questions? Please leave a comment.
Thank you.
#NEO is back at its historical demand zone!#NEO
The price is moving within a descending channel on the hourly timeframe. It has reached the lower boundary and is trending towards a bounce. A retest of this boundary is expected.
The Relative Strength Index (RSI) indicates a downward trend, and this trend is likely to continue due to the overbought condition.
There is a key support zone in green at 2.73, and the price has bounced off this zone several times, making it a strong support level.
The price is trending towards the 100-period moving average, which we are approaching. This trend supports an upward move.
Entry Price: 2.82
First Target: 2.88
Second Target: 2.96
Third Target: 3.06
Stop Loss: At the resistance zone in green
Remember this simple rule: Money management.
Any questions, please leave a comment.
Thank you.
NEO Squeeze Imminent at 3.3% Leverage Bottom... With Spot Z Accelerating
The most important number on this panel is the squeeze status — Imminent at 48 bars of compression with bandwidth tightened to 13.78 percent. That is an unusually long coil. Bandwidth at this level with 48 bars of sustained compression means the release when it comes will be sharp. Direction is what needs confirming, and the volume data is starting to give an answer.
Signal board shows 27 green to 27 red out of 112 — a perfect split. EMA 3 to 1, Ichi TK 6 to 7, C>T 5 to 8, DD/SS 1 to 7, candle patterns 7 to 7. Every metric is deadlocked. This is exactly what a 48-bar coil looks like on the signal board — the market genuinely has not picked a direction yet. Bounce reading 15.2 percent at 4.1x Breakout confirms the most recent move is attempting resolution. Prem negative 0.24 percent Backwardation at negative 0.4 sigma with Yield at negative 265 APY negative 0.4 sigma Bull — funding is leaning bullish at a moderate level.
Spot Z at 0.66 Active is the first reading above average of all today's setups. Futures Z only 0.09 Average, combined 0.14 Average. SpotZ 1:5 reads 0.66 to negative 0.57 then 1.24 with double upward acceleration arrows — this is the acceleration pattern that precedes a real spot-driven move. S/F volume at 3.07 million spot against 17.66 million futures is 5.74x Elevated, but the spot dollar value at 8.86 million against 51 million futures shows futures still dominant in absolute size. Futures Only Elevated squeeze at 6 bars Speculative is running alongside the imminent spot squeeze.
Leverage at 3.3 percentile Bottom is the structural standout. This is the lowest leverage reading of all setups reviewed today — lower even than ZEN and CFX. At 3.3 percentile Bottom with price at 12.6 percent of range Floor and OBV Z at 0.79 Inflow with no divergence, the preconditions for a real squeeze resolution to the upside are the strongest here of any token today.
The honest read: NEO is the cleanest setup of this batch. Forty-eight bars of compression, 3.3 percentile leverage bottom, Spot Z accelerating with double upward arrows, OBV inflow, and backwardation funding pricing a move up. The split signal board simply reflects the coiling — it will resolve when the squeeze fires. Watch the next two to three bars for Spot Z to sustain above 1.0 and the squeeze to transition from Imminent to Fired. If that happens with OBV Z above 1.0, the 6.531 range high becomes the measured target. Supply reference sits at 23.83.
Is That Crypto Pump Real? Data Says No. Here's Why.
Stop Losing Money to Fake Volume. Find Real Moves Now.
Trade the REAL Crypto Volume. Stop Getting Faked Out.
NEO/USDT — Descending Channel: Breakout or Further Downside?On the NEO/USDT 1D timeframe, price action is still moving within a clear downtrend structure, indicated by a Descending Channel (Bearish Channel).
Red line → Dynamic resistance (upper trendline)
Yellow line → Dynamic support (lower trendline)
Current price is in the mid–upper channel area, نزدیک resistance
This structure shows that the market is still under bearish pressure, but a short-term reversal potential is starting to emerge.
---
📐 Pattern: Descending Channel
A Descending Channel is formed by:
Lower Highs (LH)
Lower Lows (LL)
📌 Characteristics:
Main bias: Bearish
However, it often leads to a bullish breakout if resistance is broken
In this chart:
Price has bounced multiple times from channel support
Currently testing resistance → a critical zone
---
🟢 Bullish Scenario
📈 Bullish confirmation if:
Price breaks and closes above the channel resistance (red line)
Breaks above the ~2.95 level
🎯 Upside targets:
3.30
3.50
4.00
💡 Meaning:
A breakout from this channel could signal an early trend reversal or at least a relief rally with strong upside potential.
---
🔴 Bearish Scenario
📉 Bearish continuation if:
Price fails to break out and gets rejected at resistance
Moves back down inside the channel
🎯 Downside targets:
Retest of channel support
Around 2.30 – 2.10
💡 If support breaks:
Potential for deeper downside (trend continuation)
---
⚠️ Key Levels
Main resistance: 2.95
Next resistance: 3.30 – 3.50 – 4.00
Strong support: 2.30 area
Critical support: 2.10
---
🧠 Conclusion
Main trend remains bearish (descending channel)
Price is at a crucial area → near resistance
A significant move is likely once a key level is broken
👉 Main focus: breakout or rejection around 2.95
#NEO #NEOUSDT #CryptoAnalysis #TechnicalAnalysis #Altcoin #CryptoTrading #Bearish #Bullish #Breakout #DescendingChannel #SupportResistance #Crypto
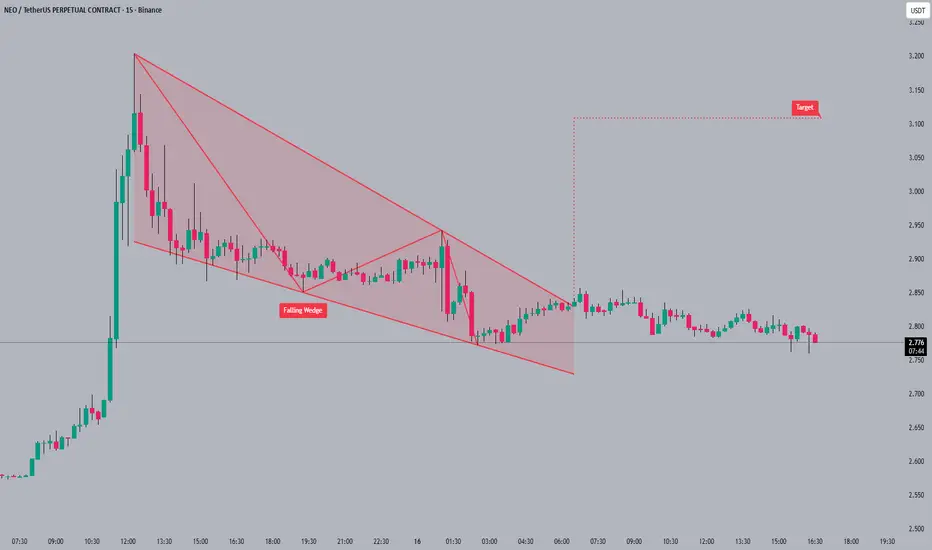
#NEO#NEO is consolidating around the 2.78 level 🧐 after breaking out of a falling wedge pattern. The wedge breakout suggests a potential reversal 📈 with increasing buying pressure. The next target is near the 3.10 level which could be a key area of resistance 🚀.
A breakout from a falling wedge can signal a shift from bearish to bullish sentiment.
#NEO #crypto #trading #altcoin
#NEO/USDT is back at its historical demand zone!#NEO
The price is moving within a descending channel on the hourly timeframe. It has reached the lower boundary and is heading towards a breakout, with a retest of the upper boundary expected.
The Relative Strength Index (RSI) is showing a downward trend, approaching the lower boundary, and an upward bounce is anticipated.
There is a key support zone in green at 2.63, and the price has bounced from this level several times. Another bounce is expected.
The indicator is showing a trend towards consolidation above the 100-period moving average, which we are approaching, supporting the upward move.
Entry Price: 2.70
First Target: 2.81
Second Target: 2.92
Third Target: 3.08
Stop Loss: Below the green support zone.
Remember this simple thing: Money management.
For any questions, please leave a comment.
Thank you.
NEO: Almost Ready to Bounce.Another request: NEO.
When requesting a coin analysis please mention in which timeframe otherwise will be post it for the 4hrs and /or Daily
NEO for the Daily projection is to the upside with target of $5.65 by March or sooner.
and for the 4hrs TF is also to the upside but it might drop a bit more with target around $3.95 within next 2 weeks.
#NEO/USDT is back at its historical demand zone!#NEO
The price is moving within a descending channel on the hourly timeframe. It has reached the lower boundary and is heading towards a breakout, with a retest of the upper boundary expected.
The Relative Strength Index (RSI) is showing a downward trend, approaching the lower boundary, and an upward bounce is anticipated.
There is a key support zone in green at 3.60. The price has bounced from this level several times and is expected to bounce again.
The indicator is showing a trend towards consolidation above the 100-period moving average, which we are approaching, supporting the upward move.
Entry Price: 3.68
First Target: 3.75
Second Target: 3.84
Third Target: 3.95
Stop Loss: Below the green support zone.
Don't forget one simple thing: Money Management.
For any questions, please leave a comment.
Thank you.
#NEO is back at its historical demand zone!#NEO
The price is moving within a descending channel on the 1-hour frame, adhering well to it, and is on its way to breaking it strongly upwards and retesting it.
We have a bounce from the lower boundary of the descending channel, this support at 5.45.
We have a downtrend on the RSI indicator that is about to be broken and retested, supporting the upside.
There is a major support area in green at 5.30, which represents a strong basis for the upside.
Don't forget a simple thing: ease and capital.
When you reach the first target, save some money and then change your stop-loss order to an entry order.
For inquiries, please leave a comment.
We have a trend to hold above the 100 Moving Average.
Entry price: 5.55
First target: 5.63
Second target: 5.73
Third target: 5.86
Don't forget a simple thing: ease and capital.
When you reach your first target, save some money and then change your stop-loss order to an entry order.
For inquiries, please leave a comment.
Thank you.