Nexo: is the rally over? key levels and targets for todayNexo
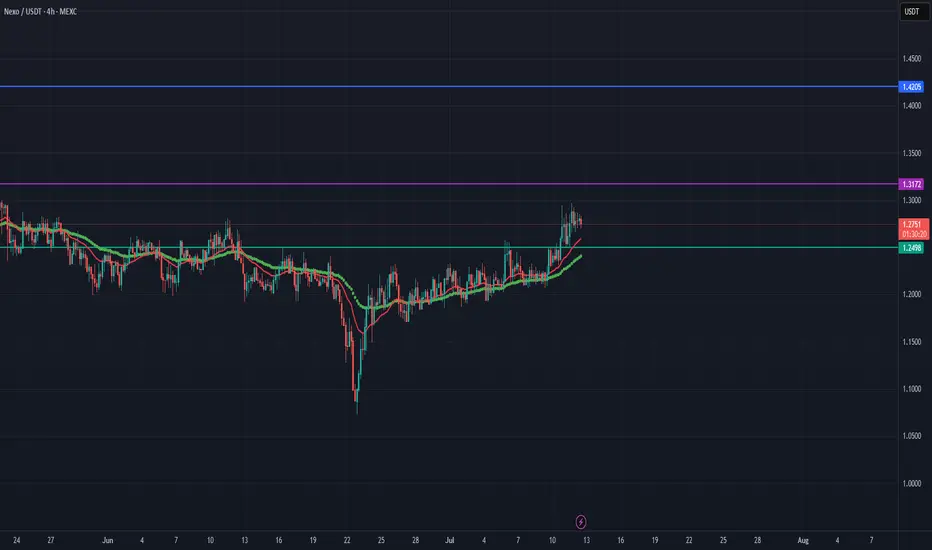
Nexo is poking right into a heavy daily supply zone while the whole alt market is waking up again on the back of fresh optimism around liquidity returning to crypto, according to industry sources. Today price tagged that 0.91–0.93 resistance pocket and stalled, even though broader risk sentiment is still risk‑on. When an under‑the‑radar coin runs into an old sell wall during a bullish week, I start hunting for a fade instead of chasing.
On the 4H chart, price is pressing the top of the green demand area with RSI already near overbought and curling, hinting at tired bulls. VPVR shows the thickest volume node below current price, not above, so there’s more “air” overhead than support. I’m leaning short here, looking for a mean‑reversion move back into the mid‑range as late longs get squeezed.
My base plan: if Nexo keeps rejecting this red zone, I like a short targeting the 0.86 area first, with potential extension toward the lower green demand if momentum really flips. If price closes and holds solidly above this supply band with strong volume, I’m wrong and will step aside instead of fighting a breakout. I might be wrong, but fading euphoria at resistance has paid my bills more often than breakouts with FOMO entries.
In-depth trading ideas
NEXO: rally or correction? key levels to watch for todayNEXO. Who’s hunting yields instead of meme pumps right now? Lending tokens are back on the radar as the market rotates into higher‑yield plays, and after that nasty flush NEXO already squeezed hard off the lows. According to market chatter, centralized earn platforms are seeing renewed interest, so this move is not happening in a vacuum.
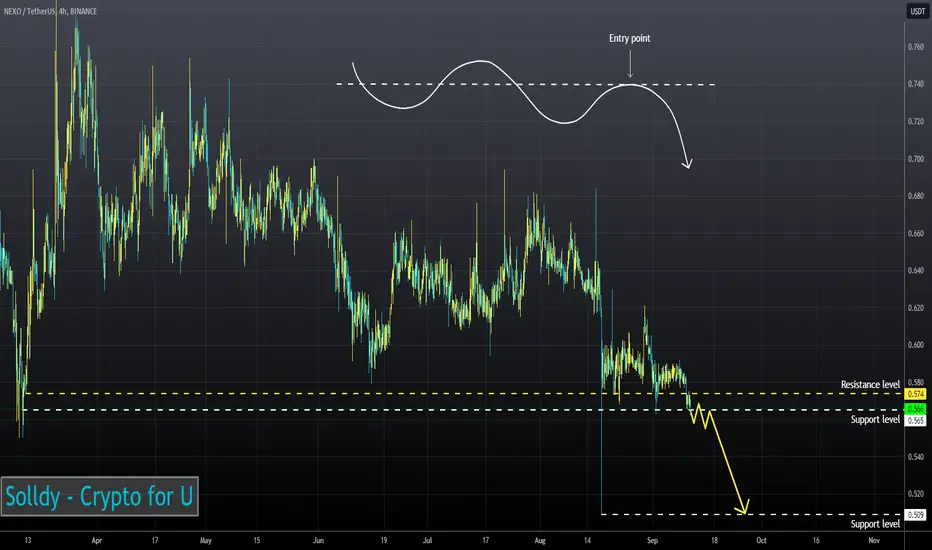
On the 4H chart price is parked right in a fat supply zone around 0.84‑0.87 where we last distributed before the dump. RSI just cooled from overbought and is rolling over, while VPVR shows the main volume magnet lower, near 0.79‑0.80. So short term I lean to a corrective move down before any serious breakout. I might be wrong, but fading euphoric bounces into old supply has paid my bills more than once.
My base case: rejection from this zone and a pullback toward 0.80, maybe 0.76, where I’ll watch for a fresh long setup ✅. Aggressive traders can look for shorts here with invalidation above 0.88, targeting that 0.80 cluster. If bulls punch through 0.87 on strong volume, the door opens to 0.93 then the psychological 1.00, but a clean break and hold below 0.80 would be a warning to step aside ⚠️.
Technical Analysis of NEXO/USDT (Weekly Timeframe)Pattern and Structure:
The chart displays a harmonic pattern, possibly a Gartley or Bat formation, with the key points X, A, B, C, and D marked.
A broadening wedge (or expanding triangle) is also forming, showing increasing volatility.
Key Price Levels
Current Price: $1.423
Resistance Zone: $1.80 - $2.10
Support Zone: $1.15 - $1.35
Trade Setup
The chart suggests a bullish breakout scenario, with a target of $1.80 - $2.10.
The risk zone (stop-loss) is marked around $1.15, indicating a risk-reward ratio favoring long positions.
Conclusion
Bullish bias is evident, but confirmation of a breakout above $1.50 would add more confidence.
Traders might look for long entries above $1.50, targeting $1.80 - $2.10.
A drop below $1.15 would invalidate this bullish scenario, signaling a retest of lower levels.
TradeCityPro | Navigating NEXO's Financial Waters👋 Welcome to TradeCityPro!
In this analysis, I want to discuss the NEXO coin for you. The NEXO project is a payment platform. This coin has always had issues with the US government and has been involved in several legal cases, but now, with Trump as president, it's experiencing a more relaxed environment.
📅 Weekly Timeframe
In the weekly timeframe, we are witnessing an upward trend that started from a low of $0.521 and has managed to reach $1.523 with high buying volume and upward momentum.
🔍 After reaching the $1.523 area, a correction phase started, and the price dropped to $0.923, forming a range box between $0.923 and $1.523.
🔼 Considering the size of the candles, price behavior, and volume, it seems that buyers have been stronger than sellers in this range because they have managed to test the resistance at $1.523 three times, weakening this area with each attempt.
✨ Currently, the price is moving toward this resistance again. Given the high market momentum and key indices like TOTAL, this coin could also see significant momentum if it aligns with these indices, potentially breaking this resistance.
🚀 If the $1.523 resistance is broken, the price targets are around the Fibonacci Extension levels of 1 and 1.618, which approximately align with the $2.6 and $4.9 areas.
💵 Regarding market cap, the current price has a market cap of $900 million. Given this market cap, the potential to reach these targets could increase.
📉 In case of a correction, the first significant area is $0.923. A break below this area could signal a trend change. A break below 50 in the RSI could also indicate a trend change.
📅 Daily Timeframe
In the daily timeframe, we can see more details of the price movement within the box. As observed, the price in its last upward move has managed to move toward the $1.542 resistance after breaking the previous high of $1.065.
👀 After reaching $1.542 and the peak of buying volume, a price correction began with decreasing volume, correcting down to the 0.5 Fibonacci level. This area is also an important support zone, and the price has reacted to this zone, now moving back toward the $1.542 resistance.
⚡️ Currently, breaking the 60.23 level in the RSI could be very crucial. If this area is breached, considering the momentum entering the market, the likelihood of breaking $1.542 increases.
📈 The best long trigger currently is at $1.542. If the price stabilizes above this area, we can expect an upward price movement.
💥 On the other hand, if selling volume enters the market and we see large red candles, more significant corrections are possible, and the price could drop at least to the previous low of $1.212, the 0.5 Fibonacci area.
💫 In case of a deeper correction, the next support areas are the 0.618 Fibonacci level ($1.144), $1.065, and $0.0950. If the RSI breaks below 50, we can expect a confirmation of a downward momentum, making it a risky move to anticipate further price drops without solid triggers.
📝 Final Thoughts
This analysis reflects our opinions and is not financial advice.
Share your thoughts in the comments, and don’t forget to share this analysis with your friends! ❤️
NEXO Technical Analysis in Daily TimeframeHello everyone, I’m Cryptorphic.
For the past seven years, I’ve been sharing insightful charts and analysis.
Follow me for:
~ Unbiased analyses on trending altcoins.
~ Identifying altcoins with 10x-50x potential.
~ Futures trade setups.
~ Daily updates on Bitcoin and Ethereum.
~ High time frame (HTF) market bottom and top calls.
~ Short-term market movements.
~ Charts supported by critical fundamentals.
Now, let’s dive into this chart analysis:
NEXO is trailing in the middle of the support and resistance trendlines. It is interesting to see how the 50 EMA disallows the price from moving further, while the support at $1.170 holds it.
A close above the 50 EMA will push the price for a short-term gain of 20%-25%. If the support weakens, consider entering NEXO at around $1.065.
Key levels:
- Primary Support: $1.170
- Lower Support: $1.065
- Primary Resistance: 50 EMA ($1.22)
- Short-term Target: $1.4 to $1.5
DYOR, NFA.
Please hit the like button to support my content and share your thoughts in the comment section. Feel free to request any chart analysis you’d like to see!
Thank you!
#PEACE
NEXO/USDT I BUY SETUP✔︎📈 BINANCE:NEXOUSDT SIGNAL
✔︎ENTRY : 1.462
🏓TARGETS :
✔︎ T1 : 1.660
✔︎ T2 : 1.859
✔︎ T3 : 2.103
✔︎ Long term T4 - T5
✘ STOP : 1.360
🚦Stop Trigger:
• If you make capital management: Stop is activated when one candle opening and closing
below the stop level of the same time frame of the signal.
• If you don't make capital management: Stop is direct without waiting for the candle to close.
💡Risk management :
• Enter the trade with 10% to 20% of your capital to reduce risk and save cash to enter other opportunities.
• Sell (25% to 50%) on (T1) and don't move your stop-loss.
• Sell 50% on (T2) and move your stop loss to the entry point.
• You are safe now, and the next 25% is up to you.
💡Reason for this trade:
This trade gives my trading system a sign of strength:
• My trading system is based on liquidity and reversal zones.
• When the liquidity is swept from one side under certain conditions, we will wait for the price on the other side.
The liquidity will attract the price like a magnet.
• the first side that has been swept:
1- failure swing point
2- liquidity pool
3- valu area deviation
• Opposite side targets:
1- range high
2- monthly resistance
3- fibonacci extension
💡Entry setup
1- reclaim valu area low
⚠️WARNING:
• I'm not a financial advisor.
• Do your own research (DYOR).
#NEXO/USDT - Long - Potential 21.68%
Strategy: Long
Exchange: BYBIT
Account: Spot
Entry mode: Market order in range
Invest: 5%
Exit:
• Target 2 : 1.1 20.32%
• Target 1 : 1.012 11.72%
Entry: 0.9142 ⌁ 0.9142
• Current market price: 0.9142
• Stop: 0.812 (-11.18%)
Technical indicators:
Resistance break in confirmed uptrend. Dip into liquidity zone has pushed price through the 0.886 resistance. No overhead resistance.
• ⎿ 24h Volume: 27476.249278
• ⎿ Satoshis: 0.9142
• ⎿ Analysis: TradingView
My nexo spot predictionJust simple elliot wave counting possibility. Tradingview does not want me publish just 1 sentence, so I will try my best explaining the count. Elliotwave is a simple method made by mr Elliot (search in google) by counting the market wave pattern. His pattern consist of 5 waves. Since the law of the market can be counted, according to mr Elliot, in 5 wave signal. Search more in google the probability wave length and period. Ok, the best way making use if this means method is to determine which wave you are at the moment, and then the waiting game begins. Enjoy
Nexo Buying Frenzy: Seize the Opportunity Now!**Short fundamental analysis of Nexo (NEXO)**
* Nexo is a centralized cryptocurrency lending and borrowing platform that offers users high interest rates on their deposits and low interest rates on their loans.
* Nexo has a strong focus on security and is one of the few lending platforms that has been independently audited by Armanino LLP.
* Nexo has a large and growing user base of over 4 million users in over 200 countries.
* NEXO is the native token of the Nexo platform and is used to pay for platform fees and to earn rewards.
**Recent news about Nexo**
* Nexo has recently launched a new feature called Nexo Boost, which allows users to earn higher interest rates on their deposits by locking up their NEXO tokens.
* Nexo has also recently announced that it is expanding its services to the United States.
**Disclaimer**
The information provided in this response is for informational purposes only and should not be construed as financial advice.
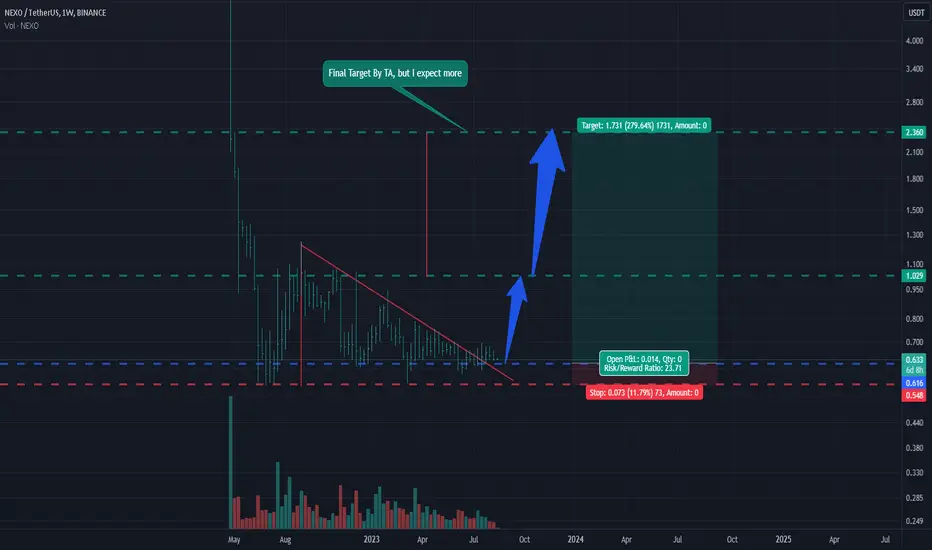
Nexo in bullish descending bullish descending triangle pattern
What Is a Descending Triangle Chart Pattern?
A descending triangle is a powerful technical analysis pattern with a predictive accuracy of 87%. The pattern is flexible and can break out up or down, and is a continuation or a reversal pattern.
A descending triangle has one declining trendline that connects a series of lower highs and a second horizontal trendline that connects a series of lows. A descending triangle can be bearish or bullish or a reversal or continuation pattern, depending on the direction of the price breakout.
A descending triangle occurring during a price uptrend, with a price breakout above the resistance line, is considered a bullish continuation pattern. (See chart below)
Conversely, a descending triangle occurring during a price downtrend, with the price breaking out above the resistance line, is considered a reversal pattern.
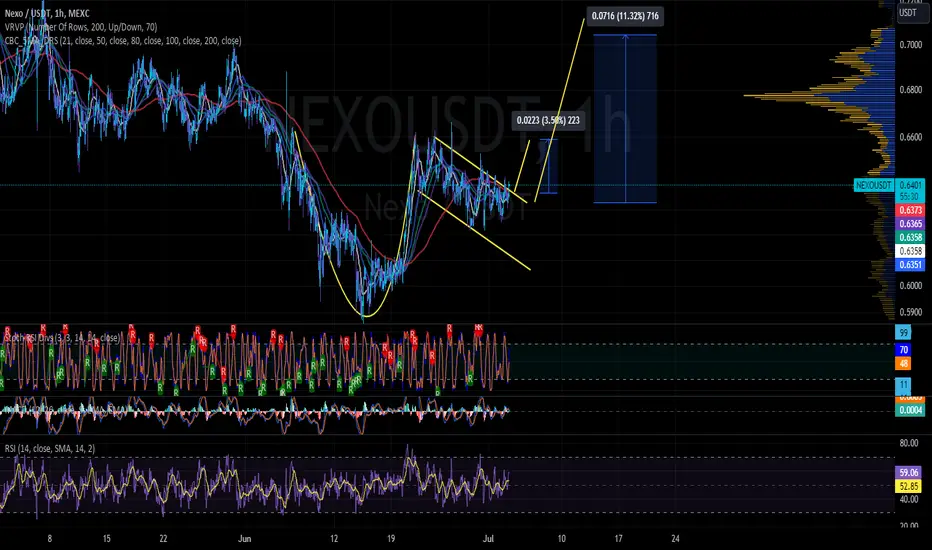
NEXO Cup and HandleNEXO is on my radar.
2 possible plays.
1.larger cup and handle for 11% gain which may take a few weeks to play out. Smaller shorter play is playing the channel.
2. It is breaking out of the descending channel i would add leverage to this. I'm not a huge fan of this project so make sure you have a stop loss