NATURAL GAS — Why I’m Targeting $2.20–$2.25 Before Looking longMy current medium\-term bias on U\.S\. Natural Gas remains bearish, with **$2\.20–$2\.25** as the major downside area I’m watching\.
This isn’t simply a price target\. There are several technical and macro factors that make this area particularly interesting\.
### THE TECHNICAL CASE
Natural Gas has continued to struggle to sustain rallies, with selling pressure repeatedly returning into strength\.
On the higher\-timeframe chart, the **$2\.20–$2\.25 region stands out as an important historical support area**\.
It also lines up closely with the longer\-term trend structure I’m following and could potentially create another major test of the lows in this region\.
That makes $2\.20–$2\.25 much more interesting to me than simply picking an arbitrary downside target\.
### WHY I THINK WE CAN GET THERE
The geopolitical premium in energy remains one of the biggest variables\.
Markets can price geopolitical risk extremely quickly — but they can also remove that premium aggressively when fears of supply disruption begin to fade\.
If tensions involving Iran continue to ease and the market becomes increasingly confident that major energy infrastructure and supply routes will remain intact, Natural Gas could lose part of the geopolitical/risk premium that helped support energy prices\.
At the same time, Natural Gas remains extremely sensitive to:
• Weather\-model changes
• Storage injections and overall inventories
• LNG feedgas demand
• U\.S\. production levels
• Power burn
• Broader energy\-market sentiment
If weather demand disappoints while production remains strong and storage continues moving toward comfortable levels, I believe sellers could remain in control\.
### WHY $2\.20–$2\.25 MATTERS TO ME
This is where the trade becomes particularly interesting\.
My thesis isn’t simply:
**“Natural Gas is going to $2\.20\.”**
It’s:
**Bearish toward $2\.20–$2\.25 → reassess the fundamentals and price structure → potentially transition from bearish to aggressively bullish\.**
If NG reaches this area while the longer\-term fundamentals remain constructive, I would start looking very seriously for evidence of accumulation and a major cycle bottom\.
Natural Gas has historically demonstrated just how violently it can reprice once supply/demand conditions tighten\.
A confirmed bottom around $2\.20–$2\.25 could therefore offer a very different opportunity from the short thesis I’m currently following\.
### WHAT WOULD INVALIDATE THE BEARISH THESIS?
I’m watching for sustained higher\-timeframe acceptance above major resistance rather than reacting to individual intraday spikes\.
A genuine shift in weather demand, tightening storage expectations, falling production, materially stronger LNG demand, or renewed geopolitical disruption could also change the fundamental picture quickly\.
Natural Gas is volatile\. The thesis has to evolve with the data\.
### MY ROADMAP
**Current bias:** Bearish
**Primary downside area:** $2\.20–$2\.25
**At $2\.20–$2\.25:** Reassess rather than automatically remain short
**Long\-term opportunity:** Potential major accumulation zone if price action and fundamentals confirm a bottom
For me, **$2\.20–$2\.25 isn’t just the destination for the bearish trade — it could potentially be where the much bigger Natural Gas trade begins\.**
— **JHMacro**
In-depth trading ideas
NATGAS The Target Is DOWN! SELL!
My dear followers,
This is my opinion on the NATGAS next move:
The asset is approaching an important pivot point 2.705
Bias - Bearish
Safe Stop Loss - 2.719
Technical Indicators: Supper Trend generates a clear short signal while Pivot Point HL is currently determining the overall Bearish trend of the market.
Goal - 2.680
About Used Indicators:
For more efficient signals, super-trend is used in combination with other indicators like Pivot Points.
Disclosure: I am part of Trade Nation's Influencer program and receive a monthly fee for using their TradingView charts in my analysis.
———————————
WISH YOU ALL LUCK
NATGAS: Bearish Continuation & Short Trade
NATGAS
- Classic bearish setup
- Our team expects bearish continuation
SUGGESTED TRADE:
Swing Trade
Short NATGAS
Entry Point - 2.705
Stop Loss - 2.720
Take Profit - 2.681
Our Risk - 1%
Start protection of your profits from lower levels
Disclosure: I am part of Trade Nation's Influencer program and receive a monthly fee for using their TradingView charts in my analysis.
❤️ Please, support our work with like & comment! ❤️
Natural Gas: Breakout Test Near 2.80📊 Natural Gas: Breakout Test Near 2.80
🔥 What happened?
Natural Gas continued the bullish recovery after holding the 2.64-2.67 support zone. Price reclaimed the moving averages and is now testing the key resistance area around 2.80-2.81.
This is the same zone where previous upside attempts were rejected, so the market is now at an important decision point.
🧠 Why did this happen?
The move is mainly technical: buyers defended support, reclaimed 2.71, and pushed price through 2.74-2.76. Once price moved above EMA9, EMA20, SMA50 and SMA200, short-term momentum accelerated.
But the fundamental background is still mixed. EIA recently reported a larger-than-expected 33 Bcf storage build, and inventories remain above the five-year average. That keeps the broader upside limited. At the same time, short-term weather and power demand can still support quick rebounds.
📉 Indicators
RSI is around 76, which means Natural Gas is already overbought on the 1H chart. MACD remains bullish, and price is above all key moving averages, so momentum is strong.
The problem: price is now directly under resistance at 2.80-2.81. This is not the best place to chase longs unless there is a clean breakout.
🎯 What’s Next?
Bullish Scenario:
If Natural Gas breaks and holds above 2.80-2.81, the next upside targets are 2.84-2.86.
Rejection Scenario:
If price fails at 2.80-2.81, a pullback toward 2.76, then 2.74-2.71, is possible.
Bearish Risk:
If price falls back below 2.71, the breakout attempt weakens and the market may return toward 2.67-2.64.
💡 Key Takeaway
Natural Gas has completed a strong support bounce and is now testing the key 2.80-2.81 resistance zone. Momentum is bullish, but RSI is overheated. A breakout confirms continuation; rejection may trigger a healthy pullback.
⚠️ Not financial advice.
Natural Gas: support bounce or another rejection?Natural Gas: support bounce or another rejection?
📰 News :
Natural Gas remains under pressure as cooler weather forecasts reduce expected power demand for air conditioning. High US production and comfortable storage levels also limit upside.
LNG demand is not strong enough to fully absorb supply, so the broader macro picture is still bearish. However, price is now testing the 2.67–2.68 support zone, where buyers are trying to defend the previous low.
The next important catalyst is the EIA storage report. A smaller-than-expected build could support a rebound, while a larger build would increase downside pressure.
📈 Bullish scenario:
If Natural Gas holds above 2.67–2.68 and reclaims 2.71, buyers may try to push price toward 2.74 and 2.76–2.80.
📉 Bearish scenario:
If price closes below 2.67 on H1, the support bounce fails. In that case, sellers could push Natural Gas toward 2.62–2.60.
⚪ Neutral scenario:
While price stays between 2.67 and 2.71, the market remains in consolidation with no confirmed direction.
⚠️ Invalidation:
The long setup is invalidated if Natural Gas holds below 2.66.
⚠️ Not financial advice.
Natural Gas Broke the Trendline. Now It Has to Prove the BreakNatural gas has finally disrupted the bearish structure that controlled price through most of July.
The move above the major descending trendline is meaningful because previous rebounds repeatedly failed before reaching this point. Buyers are now producing a stronger recovery and the latest pullbacks are no longer extending the sequence of lower lows.
But the trend has not fully reversed.
Price is now testing the shorter-term resistance structure around the current area. This is where momentum needs to become acceptance.
The primary scenario remains constructive if buyers hold above the broken bearish trendline and establish price above short-term resistance. That would strengthen the developing higher-low structure and increase the probability of a broader recovery toward the upper part of the previous range.
The alternative scenario is a failed breakout. If price falls back beneath the broken trendline and buyers cannot reclaim it, the recent advance would look more like a short-covering rally than a genuine change in control.
Invalidation: Sustained acceptance back below the broken descending structure would weaken the bullish recovery thesis and restore pressure toward the lower trend boundary.
For now, momentum favours buyers, but the trend remains young. The next consolidation will show whether this was simply a strong rebound or the beginning of a more durable structural shift.
Natural Gas: Buyers are pressing the Wedge top again📊 Natural Gas: Buyers are pressing the Wedge top again
Natural Gas is pushing back toward the upper boundary of the rising wedge, with price trading near 2.84-2.85 after holding the lower trendline.
The structure is still constructive: price remains above EMA9, EMA20 and SMA50, while the 200 SMA is lower near 2.75. Buyers are still in control of the short-term trend, but price is now approaching a difficult resistance zone.
The Zig Zag structure also supports the idea of higher swing lows. After the move from 2.6377, Natural Gas printed a higher swing around 2.8222, and now price is trying to push toward the next swing zone near 2.8695. This shows that the market is still building upward structure, but it is also getting close to the wedge top.
The key resistance is 2.86-2.87. This is where the previous rejection happened, and it also matches the upper wedge boundary.
RSI is around 62, so momentum is positive but not extremely overheated. MACD is turning higher again, which supports the breakout attempt, but confirmation is still needed.
If Natural Gas breaks and holds above 2.87, the next upside target is 2.90, then potentially 2.95.
If price rejects again from 2.86-2.87, the first pullback zone is 2.82-2.81. A break below 2.81 would weaken the wedge and open a deeper move toward 2.78, then 2.75.
⚠️ Not financial advice.
Natural Gas — Pullback Before the Next Drop | Target 2.20Natural Gas is currently showing a bearish outlook, with sellers maintaining control of the broader market structure. After the recent downside pressure, price may experience a temporary upward correction before the next selling wave begins.
The expected upside move is viewed as a short-term pullback rather than a confirmed trend reversal. If price reaches the anticipated resistance area and selling pressure returns, the market could resume its bearish movement and continue toward lower levels.
From a technical perspective, the overall structure remains tilted toward the downside. Buyers may attempt to push price higher in the short term, but unless they manage to establish strong bullish momentum and break key resistance levels, the recovery could provide sellers with another opportunity to enter.
The primary downside objective for this setup is around 2.20, where price may potentially react to demand and profit-taking.
Bias: Bearish 🔻
Setup: Sell on Pullback
Target: 2.20 🎯
Outlook: Temporary Upside Correction → Bearish Continuation
As always, proper confirmation and risk management should remain the priority before execution.
Global Gas Is Expensive, but the U.S. Market Is Still TradingNatural gas has returned to its April base even though the international LNG market is sending a very different signal. The weakness is not a story of absent demand. It is a story of domestic supply and storage still outrunning the channels available to absorb them.
The latest EIA report delivered a potentially supportive surprise. U.S. storage increased by 28 Bcf, below the expected 38 Bcf build, bringing total inventories to 3,084 Bcf. Futures initially reacted positively, but the recovery failed to develop into sustained follow-through.
That reaction matters more than the headline.
A smaller-than-expected injection should have strengthened the argument for a tighter summer balance. Instead, the market quickly returned its attention to the remaining storage surplus, steady production and the approaching end of the peak cooling season.
The overlooked detail is the disconnect between U.S. and global gas markets.
Asian and European LNG prices rose sharply in July, yet U.S. LNG exports slipped slightly from the previous month. Scheduled maintenance and operating constraints prevented exporters from responding fully to the higher international premium. Global scarcity therefore provided less support to the domestic market than the price gap might suggest.
The market appears to be pricing a comfortable U.S. balance rather than a global shortage. Hot weather continues to support power-sector consumption, but record production and above-average inventories are limiting the impact of that demand.
What the chart confirms
On the daily chart, price has lost the 3.00 area and subsequent recoveries have produced lower highs. The latest decline has returned Natural Gas to the 2.68–2.72 region, where buyers previously established the April base.
The level is familiar, but the context is weaker.
In April, the area developed after a period of stabilisation. This time, price is approaching it through an organised decline, with shorter rebounds and no meaningful recovery above the former support areas.
Primary interpretation
The bearish interpretation remains stronger while price stays below the 2.80–2.90 region.
Continuation would become more credible if the market establishes daily acceptance below the April base and fails to recover quickly. A temporary move under the area would not be enough; sellers still need to demonstrate that lower prices can be sustained.
Alternative interpretation
The decline may still become a failed breakdown rather than the beginning of a lower trading range.
That scenario would gain weight if price quickly recovers above 2.80 and then reclaims the recent lower-high region near 2.90. Smaller storage builds, renewed heat or stronger LNG feedgas demand after maintenance could support that interpretation.
It is not the primary view because the chart has not yet shown meaningful buying follow-through.
What would change the current view
The bearish reading would weaken after a sustained recovery above 2.90 and would require a broader reassessment if price reclaims 3.00.
The recovery scenario would lose credibility if the market accepts prices below the April base without an immediate response from buyers.
What comes next
The next EIA storage report will test whether the latest smaller injection was an isolated result or the beginning of a tighter pattern.
The August Short-Term Energy Outlook will also matter because updated production, storage and demand forecasts may change the market’s assumptions. In both cases, the price reaction will be more informative than the headline alone.
The U.S. gas market is ignoring expensive global gas because its domestic surplus still has nowhere urgent to go.
Natural Gas coils under SMA 200. What’s next?Natural Gas coils under SMA 200. What’s next?
Natural Gas is trading near $2.77, stuck inside a tightening range after recovering from the $2.68 support area.
The interesting part is that price is not falling anymore, but it is also not strong enough to break higher. Buyers keep defending dips, while sellers continue to appear near $2.80–2.82, where the SMA 200 and the upper side of the pattern are located.
The macro picture explains this compression.
Hot US weather supports short-term demand because higher temperatures increase power burn for cooling. Recent storage data also helped sentiment: the latest EIA build was smaller than expected, showing that demand is absorbing more supply than traders feared.
But the upside is still capped. Inventories remain above the five-year average, and high US production keeps the market comfortable.
This creates a simple setup: weather supports the market, but supply limits the breakout.
Technically, Natural Gas is trading around the EMA 9, EMA 20 and SMA 50, which confirms indecision. The real battle is near $2.80–2.82, where the SMA 200 and the upper side of the pattern are located.
If buyers reclaim this zone, the recovery can continue. If sellers defend it again, the market may stay under pressure.
Scenarios
🟢 Bullish scenario:
A clean H1 close above $2.82 would weaken bearish pressure and could open the way toward $2.90, then $2.98.
🔴 Bearish scenario:
A break below $2.72 would show that buyers are losing control. In this case, Natural Gas could retest $2.68.
⚪ Neutral scenario:
While price stays between $2.72 and $2.82, Natural Gas remains compressed with no confirmed direction.
For now, the key question is simple: $2.82 breakout or $2.72 breakdown?
⚠️ Not financial advice.
NATGAS: Expecting Bearish Movement! Here is Why:
Remember that we can not, and should not impose our will on the market but rather listen to its whims and make profit by following it. And thus shall be done today on the NATGAS pair which is likely to be pushed down by the bears so we will sell!
Disclosure: I am part of Trade Nation's Influencer program and receive a monthly fee for using their TradingView charts in my analysis.
❤️ Please, support our work with like & comment! ❤️
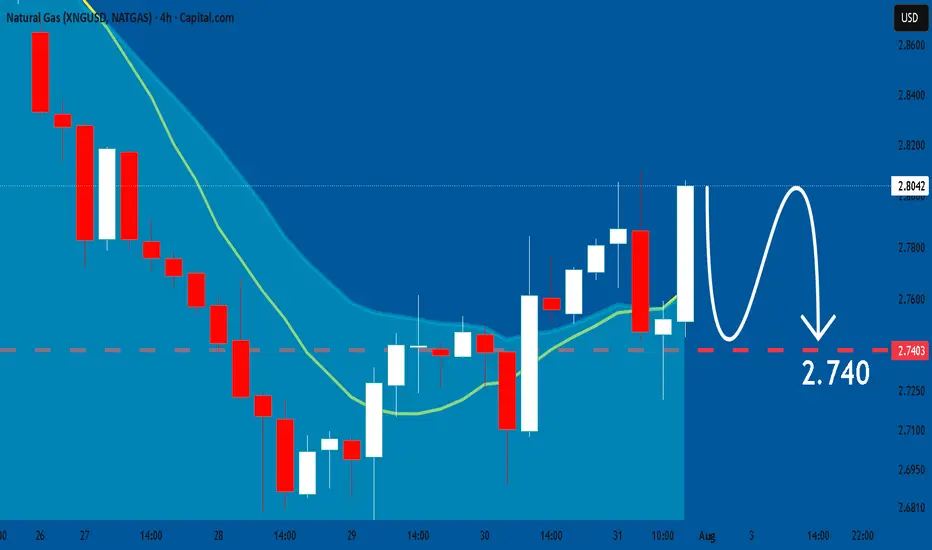
NATGAS The Target Is DOWN! SELL!
My dear friends,
Please, find my technical outlook for NATGAS below:
The instrument tests an important psychological level 2.804
Bias - Bearish
Technical Indicators: Supper Trend gives a precise Bearish signal, while Pivot Point HL predicts price changes and potential reversals in the market.
Target - 2.757
About Used Indicators:
Super-trend indicator is more useful in trending markets where there are clear uptrends and downtrends in price.
Disclosure: I am part of Trade Nation's Influencer program and receive a monthly fee for using their TradingView charts in my analysis.
———————————
WISH YOU ALL LUCK
NATGAS Trade setup: sellers test key support 🎯 Trade setup:
Direction: Short from breakdown / resistance retest
🔻 Entry: 2.745–2.760
🛑 Stop Loss: 2.850
🎯 Take Profit 1: 2.700
🎯 Take Profit 2: 2.650
📰 News:
Natural gas remains under pressure as U.S. futures extend losses. The market is being weighed down by high production, robust storage levels, softer LNG feedgas demand and forecasts for milder August temperatures.
EIA data also shows U.S. gas inventories remain above the five-year average, limiting upside pressure despite seasonal summer power demand. This keeps the fundamental backdrop bearish unless weather forecasts turn hotter or LNG demand improves.
📊 Analysis:
On the 4H chart, NATGAS is trading near 2.75 after breaking down from the recent consolidation structure. Price remains below EMA 9, EMA 20, SMA 50 and far below SMA 200, confirming that sellers are still in control.
RSI is near 33 and Stoch RSI is deeply oversold, so a short-term bounce is possible. However, MACD remains bearish and the price is still holding below the 2.800–2.830 resistance zone.
A rejection from 2.745–2.760, or a failed reclaim of 2.800, would support a continuation toward 2.700 and 2.650.
⚠️ Not financial advice.
The Natural Gas Will Jump from a Support LevelHello Traders
In This Chart EURUSD HOURLY Forex Forecast By FOREX PLANET
today EURUSD analysis 👆
🟢This Chart includes_ (EURUSD market update)
🟢What is The Next Opportunity on EURUSD Market
🟢how to Enter to the Valid Entry With Assurance Profit
This CHART is For Trader's that Want to Improve Their Technical Analysis Skills and Their Trading By Understanding How To Analyze The Market Using Multiple Timeframes and Understanding The Bigger Picture on the Charts
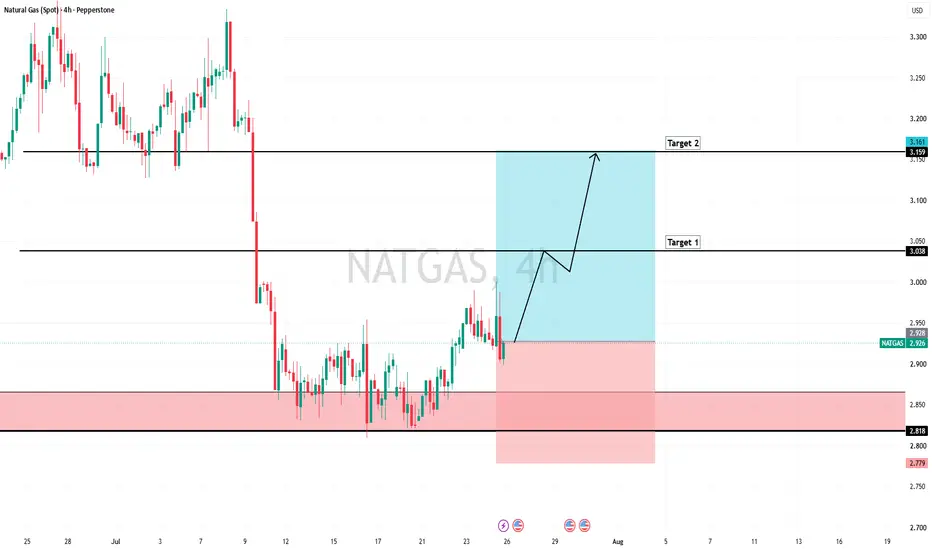
Natural Gas at Major Demand — Is a Strong Rebound About to BeginEntry: 2.696
TP1: 2.773
TP2: 2.921
TP3: 3.287
Stop Loss: 2.604
Natural Gas is testing a well-established daily demand zone, while RSI is approaching oversold territory. Broader gas markets are also receiving support from renewed supply concerns linked to Middle East tensions and QatarEnergy’s extended force majeure for European buyers.
The combination of technical support and improving fundamental sentiment creates the potential for a rebound from current levels.
Natural gas - the tape and hedge funds show us cluesUpdate 29th July 2026:
Hedge funds remain net short on natural gas as retail traders are net long.
I called it earlier back in June that natural gas prices would start falling.
The DOM & tape on Quantrader shows that hedge funds are unwilling to open any
longs even at these levels.
There is an untapped demand zone since 2024 which is at approx $2.25 - $2.35.
Surprisingly, retail positions are still net long, which tells me that traders are
hanging onto their losing positions. This should result in a further unwinding
of long positions as producers and leveraged funds continue with short
hedging.
A further decline of -12% is likely over the next few days/weeks.
The Natural Gas Will Jump from a Support LevelHello Traders
In This Chart EURUSD HOURLY Forex Forecast By FOREX PLANET
today EURUSD analysis 👆
🟢This Chart includes_ (EURUSD market update)
🟢What is The Next Opportunity on EURUSD Market
🟢how to Enter to the Valid Entry With Assurance Profit
This CHART is For Trader's that Want to Improve Their Technical Analysis Skills and Their Trading By Understanding How To Analyze The Market Using Multiple Timeframes and Understanding The Bigger Picture on the Charts
Natural Gas: Bullish recovery faces the $3.00 test🎯 Trade Setup
Direction: Long after pullback and bullish confirmation
🔻 Entry: 2.900–2.920
🛑 Stop Loss:2.845
🎯 Take Profit 1: 2.985
🎯 Take Profit 2: 3.040–3.050
Trend Analysis
Natural gas is trading near $2.93 and remains above the EMA 9, EMA 20, EMA 50 and SMA 200. The short-term structure is still bullish, but momentum is cooling near the $2.985–3.00 resistance zone, suggesting possible consolidation.
Macro Outlook
The latest EIA storage build of 32 Bcf was below the 35 Bcf consensus but close to the five-year average of 30 Bcf, providing mild support to prices. However, inventories remain above average. Hot-weather demand supports the market, while high US production may limit further upside.
Conclusion
The bias remains cautiously bullish while price holds above $2.90. A confirmed H1 breakout above $3.00 could open the way toward $3.04–3.05, while an H1 close below $2.845 would invalidate the bullish scenario.
⚠️ Not financial advice.
Natural Gas Trade Setup: Recovery attempt toward Resistance📌 Natural Gas: Recovery attempt toward $2.91 Resistance
🎯 Trade setup:
Direction: Long from support / after confirmation
Entry: 2.840–2.865
🛑 Stop Loss: 2.805
🎯 Take Profit 1: 2.910
🎯 Take Profit 2: 2.945
📰 News:
Natural gas remains under pressure from bearish fundamentals, as traders continue to monitor U.S. production, storage levels and LNG export demand. Recent market sentiment has been cautious, with upside limited by concerns that supply remains sufficient while demand catalysts are not strong enough yet.
At the same time, the market is not fully bearish. Seasonal cooling demand and global LNG risks may continue to provide support, especially if weather forecasts point to stronger power-sector consumption. For now, Natural Gas remains range-bound unless price breaks above key resistance.
📊 Analysis:
On the 1H chart, Natural Gas is recovering from the $2.807 support zone and is now trading near $2.86. Price is back above EMA 9, EMA 20 and SMA 50, showing improving short-term momentum.
However, price is still below the SMA 200 near $2.90 and below the key resistance at $2.91. This means the current move is a rebound attempt, not a confirmed bullish reversal yet.
MACD is positive and rising, while RSI is around 61, confirming stronger short-term momentum. Stoch RSI is already near the overbought zone, so a short pullback before continuation would make the setup healthier.
⚠️ Not financial advice.
Natural Gas at Harmonic Reversal Zone — Pullback Ahead?A harmonic pattern has completed near a Potential Reversal Zone (PRZ), suggesting the current move could be approaching exhaustion.
Expecting a potential pullback or retracement from this zone. Watching closely for price confirmation before the next major move.
Disclaimer: This is not financial advice. Trade with proper risk management.
NATGAS: Short Trade with Entry/SL/TP
NATGAS
- Classic bearish pattern
- Our team expects retracement
SUGGESTED TRADE:
Swing Trade
Sell NATGAS
Entry - 2.882
Stop - 2.898
Take - 2.853
Our Risk - 1%
Start protection of your profits from lower levels
Disclosure: I am part of Trade Nation's Influencer program and receive a monthly fee for using their TradingView charts in my analysis.
❤️ Please, support our work with like & comment! ❤️
The Natural Gas Will Jump from a Support LevelHello Traders
In This Chart EURUSD HOURLY Forex Forecast By FOREX PLANET
today EURUSD analysis 👆
🟢This Chart includes_ (EURUSD market update)
🟢What is The Next Opportunity on EURUSD Market
🟢how to Enter to the Valid Entry With Assurance Profit
This CHART is For Trader's that Want to Improve Their Technical Analysis Skills and Their Trading By Understanding How To Analyze The Market Using Multiple Timeframes and Understanding The Bigger Picture on the Charts