Midnight NIGHT price analysis⚠️ $NIGHT — caution advised
If you’re holding or trading #Midnight, this is the moment to stay extra careful.
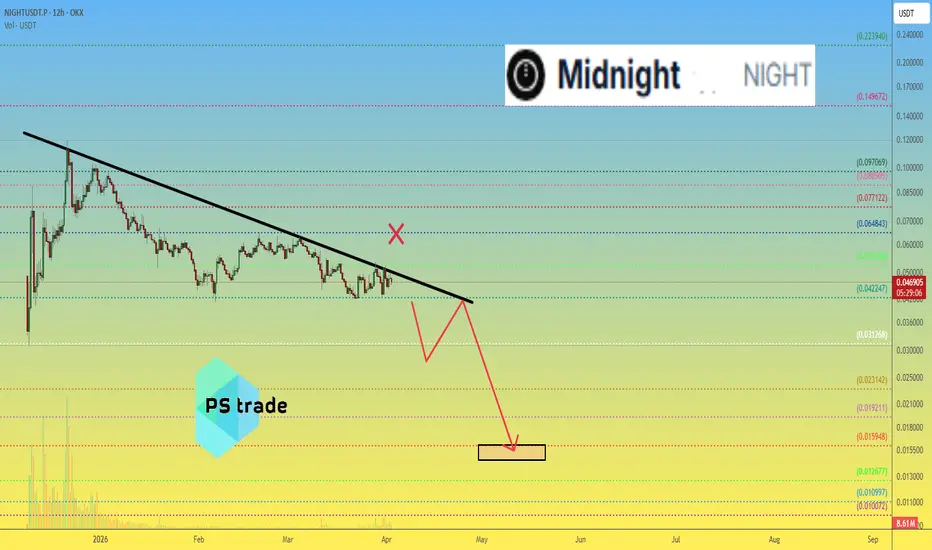
📉 OKX:NIGHTUSDT.P situation:
As long as price remains below $0.065,
there is a strong probability that the current pattern resolves to the downside.
🎯 Potential targets:
🔹 Mid target: $0.028
🔹 Final target: around $0.015
At this stage, the structure is quite clear:
🔻 below key level → sellers in control
🔻 any bounce may just be part of a larger move down
❓Do you think #NIGHT can hold here, or is the downside already in motion?
______________
◆ Follow us ❤️ for daily crypto insights & updates!
🚀 Don’t miss out on important market moves
🧠 DYOR | This is not financial advice, just thinking out loud
NIGHT3xLong/Tether
No trades
No trades
In-depth trading ideas
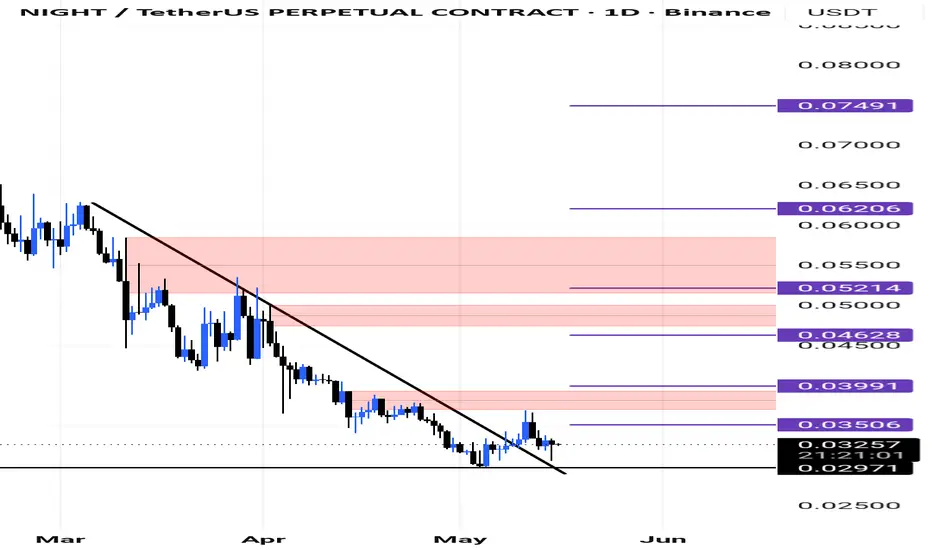
MIDNIGHTUSDT - Descending Trendline, Breakout or Further DeclineOn the 1D timeframe, MIDNIGHT/USDT remains in a clear downtrend, as indicated by the yellow Descending Trendline, which has repeatedly acted as a strong rejection zone. Every time the price approaches this trendline, selling pressure returns, forming lower highs and maintaining the bearish market structure.
📍 Currently, the price is trading around the 0.0300–0.0310 USDT support area, just below the primary descending trendline. This suggests that the market has entered a consolidation phase after an extended decline.
⚠️ As the price continues to compress near the end of the trendline, the probability of a significant impulsive move increases. However, the direction of the breakout still requires confirmation through increased trading volume and a strong daily candle close.
---
📉 Pattern: Descending Trendline
A Descending Trendline reflects seller dominance, as every upward movement is consistently rejected at a declining resistance line.
✨ Key Characteristics of This Pattern:
✅ The trendline has been tested multiple times, making it a strong and reliable resistance.
✅ The Lower High structure remains intact.
✅ Price is consolidating near support, indicating decreasing volatility.
📌 As long as the trendline remains unbroken, the overall market structure continues to favor the bears.
---
🟢 Bullish Scenario
A bullish scenario becomes more likely if the price manages to:
🚀 Break above and close a daily candle above the Descending Trendline.
📈 Confirm the breakout with a noticeable increase in trading volume.
🔄 Successfully retest the broken trendline as new support.
🎯 Potential upside targets after a confirmed breakout:
🎯 0.0340 USDT
🎯 0.03945 USDT
🎯 0.04243 USDT
💹 If buying momentum continues to strengthen, the next targets could be:
🎯 0.04818 USDT
🎯 0.05182 USDT
💡 A breakout above a long-term descending trendline often signals the beginning of a trend reversal from bearish to bullish.
---
🔴 Bearish Scenario
As long as the price remains below the Descending Trendline, bearish pressure is likely to persist.
The bearish scenario becomes stronger if:
❌ Price is rejected once again at the trendline resistance.
📉 The 0.0300 USDT support level fails to hold.
📊 Selling volume increases during a breakdown.
⚠️ A breakdown below support could trigger another wave of selling, leading to new Lower Lows and extending the current downtrend.
---
📌 Conclusion
📍 MIDNIGHT/USDT is currently trading at a critical technical level. The Descending Trendline remains the key resistance that will determine the market's next major move.
🐂 Until a confirmed breakout occurs, the bearish trend remains dominant.
🚀 However, if buyers successfully break above the trendline with strong volume, the probability of a bullish trend reversal will increase significantly.
⏳ Since the price is approaching the intersection of support and the descending trendline, traders should wait for a confirmed breakout or breakdown before making trading decisions.
«⚠️ Disclaimer: This analysis is based solely on technical analysis and price action. Always practice proper risk management and do your own research (DYOR) before making any investment or trading decisions.»
---
#MIDNIGHT #MIDNIGHTUSDT #Crypto #Cryptocurrency #Altcoin #Trading #TechnicalAnalysis #ChartAnalysis #PriceAction #DescendingTrendline #Breakout #Breakdown #Bullish #Bearish #Support #Resistance #CryptoTrading
MIDNIGHT – Descending Trendline, Is a Reversal About to Begin?The MIDNIGHT (NGT)/USDT Daily (1D) chart is still trading within a medium-term downtrend structure, marked by a strong Descending Trendline extending from the previous peak around 0.11 USDT. 📉
However, there are some interesting signs that selling pressure may be weakening. 👀 Price is currently testing a major trendline resistance that has rejected multiple bullish attempts in the past.
💡 A breakout above this trendline could become the first signal of a potential market structure shift from bearish ➡️ bullish.
---
📉 Pattern Formation: Descending Trendline 🔻
🔻 Descending Trendline Resistance
📌 Formed by a series of Lower Highs (LH) since the beginning of the downtrend.
📌 This trendline has acted as a dynamic resistance, continuously pushing the price lower over the past several months.
📌 The longer this trendline remains intact, the stronger the potential move once a breakout occurs. 💥
📋 Pattern Characteristics
✅ The downtrend remains valid as long as the price stays below the trendline.
✅ A valid breakout would require a Daily candle close above the trendline accompanied by increasing volume.
✅ A successful retest after the breakout could provide additional confirmation before the next upward move.
---
🟢 Bullish Scenario 🚀
The bullish case strengthens significantly if the price manages to break and hold above the Descending Trendline.
🎯 Bullish Targets
🥇 Target 1
➡️ 0.03945 USDT
🥈 Target 2
➡️ 0.04243 USDT
🥉 Target 3
➡️ 0.04818 USDT
🏆 Target 4
➡️ 0.05182 USDT
🚀 Bullish Potential
📈 A breakout of the trendline would end the prolonged Lower High structure.
📈 It would increase the probability of forming a new Higher Low (HL) and Higher High (HH) structure.
📈 It would also open the path toward the next major horizontal resistance zones.
✅ Additional Confirmation
🔹 Daily candle closes above the trendline.
🔹 Rising volume during the breakout.
🔹 Successful retest of the trendline as new support.
🔹 Bullish momentum begins to dominate the market.
---
🔴 Bearish Scenario ⚠️
The bearish scenario remains valid if the price fails to break the trendline and gets rejected once again.
⚠️ Bearish Risks
If another rejection occurs at the trendline:
🔻 Price could revisit the support area around 0.03300 USDT
🔻 The next support zone is located around 0.03000 – 0.02900 USDT
🔻 If these supports break, the downtrend could continue and form a new Lower Low (LL).
📉 Bearish Signals
❌ Strong rejection candles appear near the trendline.
❌ A false breakout (fakeout) occurs.
❌ Selling volume increases during rejection.
❌ Price falls back below key resistance levels.
---
🔍 Conclusion
MIDNIGHT/USDT is currently at a critical decision point ⚡ as price tests a major Descending Trendline Resistance that has controlled the market structure since the previous peak.
📌 As long as the price remains below the trendline, the broader downtrend remains intact.
📌 However, a confirmed breakout could become the catalyst for a trend reversal and open the door toward the 0.03945 – 0.05182 USDT target zone. 🚀
🎯 Traders should closely monitor price action around this trendline, as it may determine the next major directional move over the coming weeks.
⚠️ Always manage your risk and wait for confirmation before entering a position.
#MIDNIGHT #NGT #MIDNIGHTUSDT #Crypto 🚀 #Cryptocurrency #Altcoin #TechnicalAnalysis 📊 #ChartAnalysis #PriceAction #SupportAndResistance #Trendline #DescendingTrendline 🔻 #BreakoutSetup #BullishBreakout 🟢 #BearishScenario 🔴 #SwingTrading #CryptoTrading #Trader #CryptoMarket #Altseason #MarketStructure
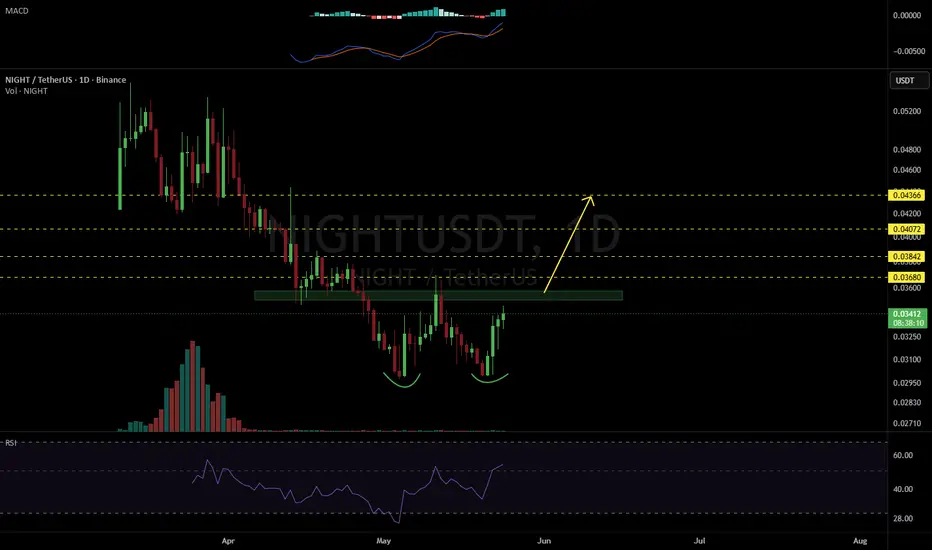
NIGHT/USDT – Breakout Watch📊 NIGHT/USDT – Breakout Watch
The recent move out of the accumulation zone shows increasing buyer interest, and price is now attempting to establish support above the previous range. This is a positive sign and often precedes stronger expansion phases.
What needs to happen?
✅ Hold above the current accumulation zone (~0.035–0.041)
✅ Continue forming higher lows
✅ Break recent local highs with volume
If these conditions are met, the path toward $0.066 becomes increasingly realistic.
The trade is still 5%+ since confirmed trend .
Trends depending the confirmed view
📊 NIGHT/USDT – TP Trend Outlook
🎯 TP 1: 0.04481 (+27%)
📈 Early trend confirmation and first momentum target.
🎯 TP 2: 0.05857 (+66%)
📈 Strong bullish continuation if momentum remains intact.
🚀 Runner: 0.06634 (+88%)
📈 Major breakout target if the trend fully develops and buyers maintain control.
As long the trade stays confirmed there will be a follow.
Probability Assessment
🟡 Current status: Breakout setup developing even with the small time manipulation press trend
🟢 Bullish scenario: Confirmed trend continuation above local resistance could open the way toward 0.066
🔴 Invalidation: Losing the accumulation zone would weaken the breakout thesis
👉 In short: NIGHT looks like it's preparing for a breakout, but confirmation is still needed before calling $0.066 the next destination.
This is our trading expectation and not financial advice — everything depends on confirmed trend continuation.
THE NIGHT:USDT BREAKOUT ARE NEAR There is huge chance this token can have a return to new high, and with the upcoming volume unexpected night breakout. ( this study made depending confirmed trend)
🚀The follow will be between 1-5 days, exactly the swing follow.
And the expecting depending on data that this token can breakout in one of these days.
NIGHT/USDT — Breakout or Another Breakdown?The MIDNIGHT/USDT 1D timeframe chart is still under medium-to-long-term bearish pressure. Price continues moving below the descending trendline, which has acted as a major resistance since early 2026. However, the lower area is beginning to show signs of accumulation and a possible reversal phase if a breakout successfully occurs. 👀
🔍 Chart Structure Analysis
Overall, the market is still forming:
🔻 Lower Highs
🔻 Lower Lows
📉 A consistent downtrend
⚠️ Repeated rejection from the trendline resistance
The yellow trendline indicates that sellers are still dominating the market as long as price remains below resistance and fails to close strongly above it.
On the other hand, price is starting to move sideways at the bottom area, which may indicate:
✅ A consolidation phase
✅ Weakening bearish momentum
✅ A possible base formation for reversal
---
📐 Pattern Formation
🔻 Descending Triangle / Falling Resistance Structure
The main pattern on this chart is a descending resistance structure continuously pressuring price downward.
✨ Pattern Characteristics:
📉 Descending resistance line
📊 Price range getting tighter
⚡ Volatility gradually decreasing
🚀 Usually followed by a strong breakout move
This pattern may lead to:
✅ Bullish reversal if a valid breakout occurs
❌ Bearish continuation if support fails to hold
The trendline remains the key level determining the next market direction. 🎯
---
🟢 Bullish Scenario
Bullish confirmation will occur if price can:
1️⃣ Break above the yellow trendline resistance
2️⃣ Close a daily candle above resistance
3️⃣ Show increasing breakout volume 📈
🎯 Bullish Targets:
🟢 0.035750
🟢 0.038050
🟢 0.042300
🟢 0.048100
🟢 0.051900
🟢 0.056500
If momentum strengthens and the crypto market remains supportive, then 0.056500 could become the next major recovery target. 🚀
📌 Additional Bullish Confirmations
✅ Higher low structure begins forming
✅ Bullish engulfing or breakout candle appears
✅ Increasing volume during breakout
---
🔴 Bearish Scenario
Bearish momentum still remains the primary scenario as long as price stays below the trendline. 📉
If price fails to break out and gets rejected again, then the market could:
❌ Continue the downtrend
❌ Create a new lower low
❌ Trigger further support breakdowns
⚠️ Important Levels to Watch
If lower support breaks, price may revisit:
🔻 0.029000
🔻 Or even lower psychological support levels
Sellers still control the market until a valid breakout is confirmed. 🐻
---
📊 Conclusion
MIDNIGHT/USDT is currently at a critical area after experiencing a prolonged downtrend. The descending resistance trendline remains the key factor for determining the next major move. ⚡
🔥 Breakout = potential major reversal
❌ Rejection = bearish continuation
Traders should wait for breakout confirmation before entering aggressively, as the market is still under bearish pressure. 📌
---
#MIDNIGHT #MIDNIGHTUSDT #Crypto #TechnicalAnalysis #Altcoin #CryptoTrading #Bullish 📈 #Bearish 📉 #Breakout #Downtrend #Resistance #Support #ChartAnalysis #PriceAction #CryptoMarket #Trader #Altseason #Bitcoin
#NIGHTUSDT Fails Bullish Shift While Respecting Supply ZonesYello Paradisers! Are you tracking the evolving structure on #NIGHT (NIGHTUSDT), or are you still reacting to every small move while smart money continues to distribute within the range?
💎#NIGHTUSDT has printed a clear Selling Climax (SC), where aggressive sell-side pressure initially got absorbed, hinting at a possible reversal. However, unlike a typical bullish accumulation, the market failed to produce a strong Change of Character (CHoCH) or any confirmed shift in structure to the upside.
💎Instead of transitioning into accumulation, price continued to respect the bearish market structure, forming lower highs and weak rallies. The lack of bullish follow-through after the SC suggests that demand is not strong enough to take control.
💎The market attempted minor upward moves, but each rally was capped within well-defined bearish supply zones, where sellers consistently stepped in. This clean reaction from supply confirms that smart money is likely distributing rather than accumulating.
💎Currently, price is reacting again from a key Supply Zone (~0.0365–0.0380), showing rejection and continuation to the downside. As long as price remains below this zone, the bearish structure remains intact.
💎The marked Possible Break of Structure (BoS) level around 0.0345 is a critical support. A clean break and acceptance below this level would confirm continuation of the bearish trend and signal further downside expansion.
💎It’s important to understand that in weak markets, Selling Climaxes without follow-through often lead to continuation, not reversal. The absence of a strong Sign of Strength (SOS) reinforces the bearish bias.
💎Looking ahead, the primary Draw on Liquidity (DOL) lies below the current structure, with price likely seeking lower liquidity levels once support is taken.
💎However, if price manages to reclaim and hold above the Supply Zone (~0.0380) with strength, that would invalidate the bearish outlook and open the door for a potential structural shift.
Discipline is key, Paradisers! Don’t assume reversals, let the market confirm. Follow the structure, respect the supply zones, and avoid getting trapped by weak rallies.
MyCryptoParadise
iFeel the success 🌴
Night / Usdt.PBINANCE:NIGHTUSDT.P
**🟦 SUPPORT**
* 0.04024 🧊 → main bounce zone 📈
* 0.03800 🧊 → stronger support / liquidity below 📈
**🟥 RESISTANCE**
* 0.04172 🚧 → first rejection 📉
* 0.04335 🚧💧 → liquidity zone (red box) → price may spike, grab liquidity, then reject / fakeout
* 0.04622 🚧 → major resistance 📉
**💡 Price behavior idea:**
* Bounce 📈 from **0.04024**, if breaks → move to **0.03800**
* Reject 📉 at **0.04172**
* Sweep into **0.04335 liquidity 💧** → possible trap → rejection
* Strong push → test **0.04622** and likely reject
---
⚠️ **Disclaimer:**
Not financial advice. Crypto is highly volatile, and levels can fail. Always use risk management and confirm with your own analysis before trading.
$NIGHT Approaching Key Liquidity — Potential Long Setup Loading
NIGHT remains in a HTF bearish structure, printing lower highs and struggling below key value areas. Current price is mid-range, meaning no confirmed long yet — patience is required.
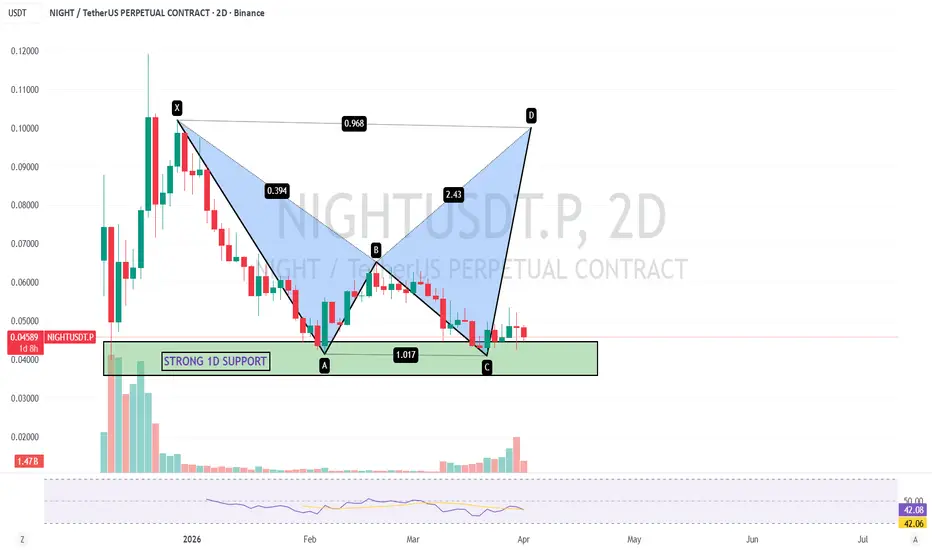
Price is moving toward sell-side liquidity below 0.044–0.040, a key zone holding weak lows. This aligns with a strong 1D support area, making it a high-probability region for a liquidity sweep before any reversal attempt.
From chart context, resistance sits around 0.048–0.050, with higher targets near 0.055 if a bullish shift occurs. However, without a proper sweep and reclaim, upside remains limited.
A harmonic structure is also forming, pointing toward a potential reaction from the current support zone, but confirmation is still required.
Volume remains weak and RSI MA is neutral, showing no strong buyer presence yet. Watch for a sweep below 0.044 followed by strong reclaim and displacement for a valid SAFE MODEL long.
Analysis by Leo524.
Night looking strong but still within rangeRange forming after a sharp sell off and bounce. Price is compressing between support and resistance which usually leads to expansion.
Key observations
Structure still weak but short term momentum is shifting
Lower zone continues to hold showing demand
Mid range acting as the key battle zone
Volume shows acceptance not breakout
What matters next
Hold support and form higher lows this becomes a base
Rejection at highs keeps this as chop
Break and hold above range high signals continuation
No chase here
Wait for confirmation
Watch the floor first
NIGHTUSDT Forming Falling WedgeNIGHTUSDT is forming a clear falling wedge pattern, a classic bullish reversal signal that often indicates an upcoming breakout. The price has been consolidating within a narrowing range, suggesting that selling pressure is weakening while buyers are beginning to regain control. With consistent volume confirming accumulation at lower levels, the setup hints at a potential bullish breakout soon. The projected move could lead to an impressive gain of around 190% to 200% once the price breaks above the wedge resistance.
This falling wedge pattern is typically seen at the end of downtrends or corrective phases, and it represents a potential shift in market sentiment from bearish to bullish. Traders closely watching NIGHTUSDT are noting the strengthening momentum as it nears a breakout zone. The good trading volume adds confidence to this pattern, showing that market participants are positioning early in anticipation of a reversal.
Investors’ growing interest in NIGHTUSDT reflects rising confidence in the project’s long-term fundamentals and current technical strength. If the breakout confirms with sustained volume, this could mark the start of a fresh bullish leg. Traders might find this a valuable setup for medium-term gains, especially as the wedge pattern completes and buying momentum accelerates.
✅ Show your support by hitting the like button and
✅ Leaving a comment below! (What is your opinion about this Coin?)
Your feedback and engagement keep me inspired to share more insightful market analysis with you!
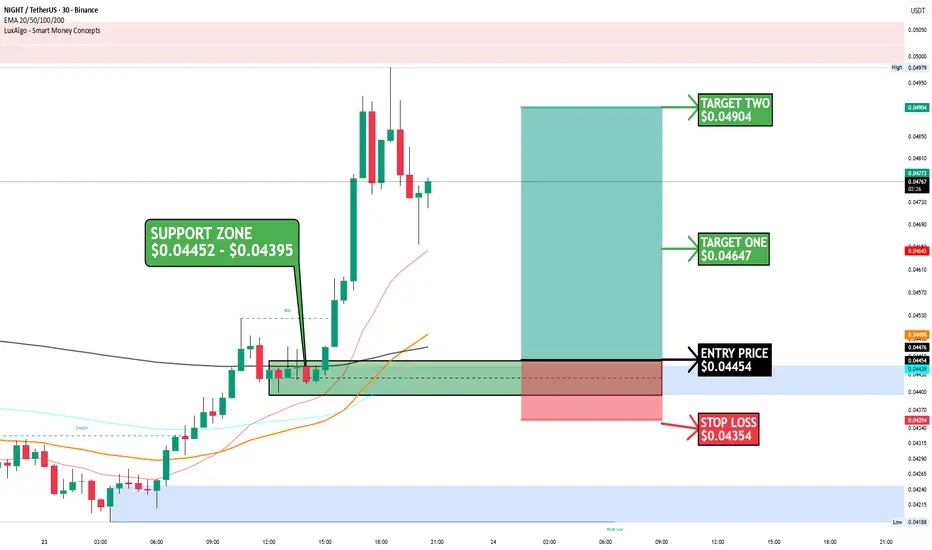
$NIGHT / USDT – Bullish Continuation SetupAlright guys, this one is looking clean 👇
🌙 Trend: Strong uptrend after a solid breakout
Price is making higher highs + higher lows → bulls clearly in control
🟢 Key Demand Zone:
$0.04452 – $0.04395
👉 This is where buyers stepped in before the pump
👉 Perfect retest zone for continuation
🎯 Entry Zone:
$0.0445 area
💡 Wait for bullish confirmation (wick rejection / strong candle)
🛑 Stop Loss:
$0.04354
👉 If this breaks, structure weakens
🎯 Targets:
TP1: $0.04647
TP2: $0.04904
📊 What I’m Seeing:
✔️ Breakout + retest structure
✔️ Price holding above EMAs (bullish momentum intact)
✔️ Clean liquidity grab before continuation
⚠️ Game Plan:
If price holds the support → expect continuation to targets
If support fails → likely deeper pullback
👀 Crypto Dude Take:
This is a classic buy-the-dip in an uptrend setup
Momentum is there… just need confirmation
#Crypto #TradingView #NIGHT #Altcoins #PriceAction
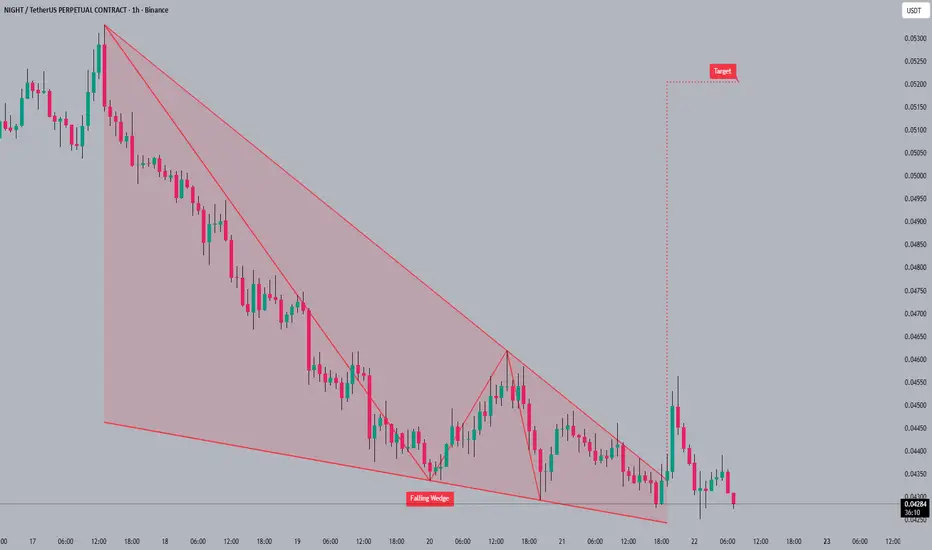
#NIGHT#NIGHT has broken out of a falling wedge pattern 🚀 and is currently consolidating near the breakout level. This bullish pattern suggests a potential trend reversal 🔄, with increased volume confirming the breakout. The next target for #NIGHT is around 0.05250 🎯, based on the pattern's projection.
#NIGHT #crypto #trading #altcoin
Night opportunity is almost hereNIGHT remains in a clear downtrend after failing to reclaim the prior range and rolling over beneath dynamic resistance. Each bounce attempt has been sold, showing a lack of sustained demand and continued distribution.
Price is now trading below key moving averages, which are acting as resistance on pullbacks. Until those levels are reclaimed, rallies look corrective rather than impulsive.
The major area of interest sits lower, where high-volume support previously stepped in. That zone represents the most logical area for buyers to re-enter with conviction.
For now, patience is key. Let price find a floor and show signs of stabilization before considering any upside thesis.
Trend first. Confirmation second. Chasing last.
$NIGHT 4H CHART UPDATE
📌This is a 4-hour chart, so it shows the short to mid-term price movement of $NIGHT.
📌The orange ascending trendline is very important.
You can clearly see that price respected this trendline two times before and moved UP from it.
📌Now price is coming to this trendline for the 3rd time.
👉 This is a decision area.
📌As long as price holds above this trendline, buyers are still defending it and price can move higher again.
📌But if this trendline breaks and price closes below it,
⚠️ then strong selling pressure can come, and price may drop fast.
📌Simple logic (for beginners):
➡️ Hold the trendline = chance to go up
➡️ Lose the trendline = risk of big drop
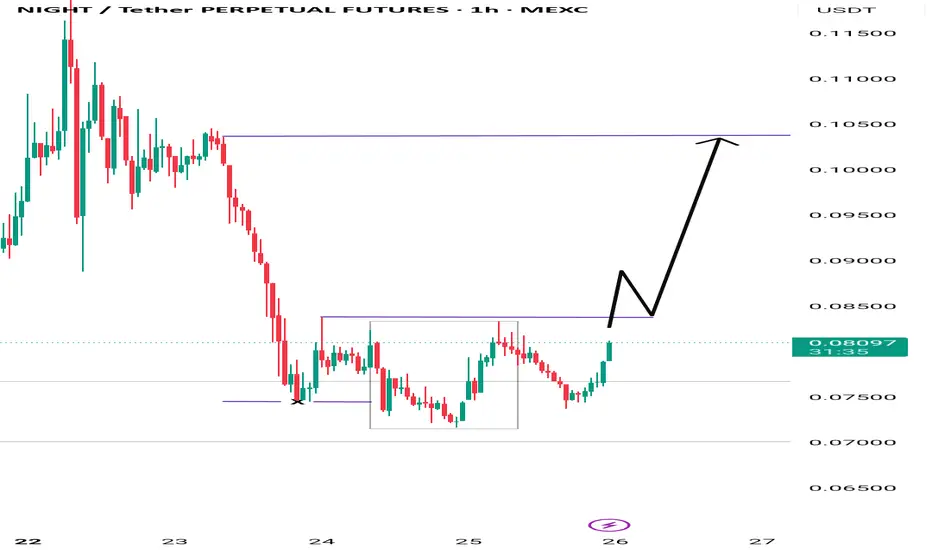
$NIGHTUSDT QUICK ANALYSIS (1H)OKX:NIGHTUSDT has been under sustained pressure as a large whale deploys algorithmic selling on Bybit—offloading roughly 200K NIGHT every 10 minutes. This steady supply is creating short-term volatility and testing whether recent buyers truly have conviction.
Despite the distribution, price has already printed a Bullish Change of Character (CHoCH) and is holding above a well-defined demand zone. This suggests the market may be absorbing sell pressure and not collapsing under it.
Confluence Highlights
Clear CHoCH confirms a bullish structure shift
Price repeatedly defends $0.0580–$0.0587, validating demand
Whale selling is controlled, not a panic dump (algorithmic execution)
Upside inefficiencies remain open at $0.061 → $0.0635 → $0.0674
Stop is well-defined below the structure at $0.0566
👉Trade Plan
Buy Zone: $0.05870 – $0.05800
Entry: $0.05840
Targets:
T1: $0.06100
T2: $0.06350
Final Target: $0.06740
Stop Loss: $0.05660
⚠️ If $0.058 fails, expect a liquidity sweep toward $0.050, where major bids are stacked.
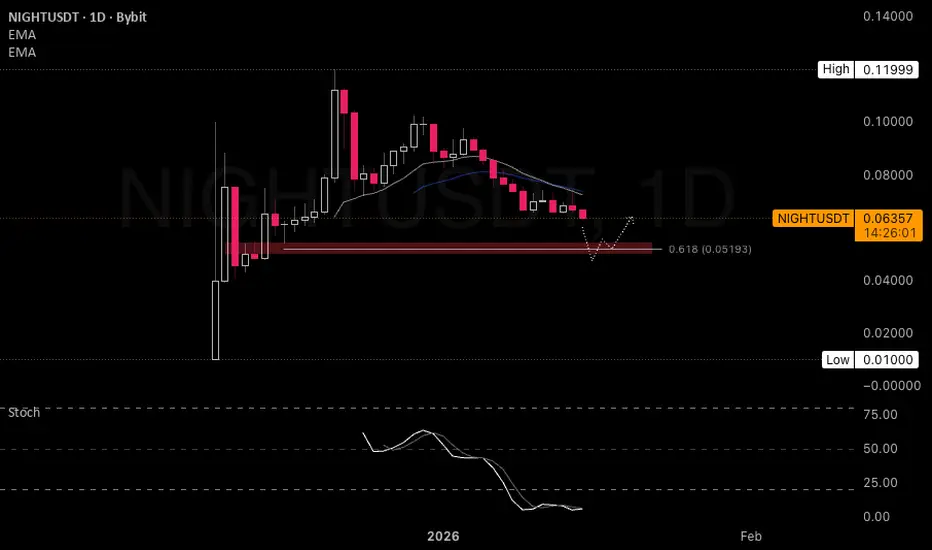
$NIGHT Next AreaCurrently, NIGHTUSDT is in a correction (retrace) phase after experiencing a significant increase to reach the High area in the range of $0.11999.
Price Structure: The price is forming lower highs, indicating that selling pressure is still quite dominant in the short term.
EMA (Moving Average): The price is currently below the EMA lines (likely EMA 20 and 50). As long as the price fails to break back above these lines, the trend is likely to remain bearish or consolidate downward.
Key Levels & Fibonacci Retracement
You have marked the crucial red box area:
Demand Area (Red Box): Located in the range of $0.05000 - $0.05500.
Fibonacci 0.618: The golden ratio level is at $0.05193. Historically, this level often acts as a reversal point where buyers start to re-enter the market.
Psychological Support: There is a low level at $0.01000, but it is still very far below.
Translated with DeepL.com (free version)
There is not much to say really everything is checking out There is not much to say really everything is checking out and we seem to be on a pretty bullish trend break here is a good volume over time distribution on liquidity of holders.
For me its a long, if breask .12 becomes a lot more bullish than right now at time of post. Will update.
NIGHTUSDTI've been eyeing this since yesterday. it's doing a CRT buy model if I am right. If checked on the the Daily TF, the previous candle was swept and it was on the POI which was the FVG, which adds up to the confluence as IPDA. I need to see it break to the swing high that swept the previous candle to confirm and look for entry.
NIGHTUSDT – Buying the Dip in a Fresh Listing?Market Context
NIGHT is the token of Midnight Network — a privacy-focused L1 connected to the Cardano ecosystem.
Translation: serious tech… but still early and volatile.
The coin was recently listed on Bybit (spot + Convert + Savings), which brought fresh liquidity and the classic price discovery pump. New listing energy is still in play.
On the 4H chart, NIGHT is showing a clean uptrend. We just had a strong impulse move from ~0.085 to ~0.12, and now the plan is simple:
👉 wait for the first real pullback instead of chasing green candles.
⸻
Key Levels (4H + 1H)
• Demand zone: 0.085 – 0.09
→ Last solid base before the latest leg up
• High / TP zone: 0.115 – 0.12
→ Current swing high after the listing pump
• Limit entry: 0.088
→ Right in the middle of the “discount area”
• Stop-loss: 0.075
→ Where the trend thesis officially breaks
⸻
Trade Plan (aka “Don’t Chase, Let It Come to You”)
• Direction: Long
• Entry: 0.088 (limit)
• Stop-loss: 0.075
• Take-profit: 0.115 – 0.12
• Estimated R:R: ~1 : 2
• Time horizon: 1–3 days
• Risk: Max 0.25R (new listing ≠ guaranteed moon)
⸻
Why This Setup Makes Sense
• Trend is your friend:
Clear 4H uptrend. This is a pullback entry, not a hope trade.
• Fresh listing dynamics:
Newly listed coins often do pump → pullback → continuation. This setup targets exactly that second phase.
• Clean demand zone:
The 0.085–0.09 area was a strong base before the last push — a logical place for buyers to step in again.
• Risk kept small:
Early listings can be wild. Small size keeps emotions under control.
⸻
When to CANCEL the NIGHT Limit Order (Very Important 🌙)
• Structure invalidation (too strong):
If NIGHT makes a new high well above 0.12 and starts trading in a higher range (e.g. 0.13–0.18) before your limit fills → 0.088 is no longer a discount. Cancel and wait for a new pullback.
• Structure invalidation (too weak):
If 4H candles start closing below 0.08, the base is broken and the trend thesis is invalid → cancel the limit.
• Time invalidation:
If 2–3 weeks pass and price builds a completely new structure (new bases, new highs), the old limit becomes irrelevant → cancel and re-evaluate.
• BTC / macro ruins the vibe:
If BTC flips into a clear downtrend after a macro shock (risk-off), you don’t want to be long a fresh listing hype coin → all NIGHT limits off.
• Project-specific risk:
Any serious negative news (regulatory issues, exploit, major bug, CEX warning) → cancel immediately, no questions asked.
⸻
Final Thought
This is a pro-trend pullback, not a FOMO entry.
Let price come to you, size it small, and respect the stop.
Fresh listings are fun — just don’t marry them 😄