In-depth trading ideas
$NMR: THE $26.70 BREAKOUT COULD TRIGGER A MASSIVE RALLYNYSE:NMR : THE $26.70 BREAKOUT COULD TRIGGER A MASSIVE RALLY
NYSE:NMR is showing a major long-term bullish setup on the 2W timeframe.
TECHNICAL STRUCTURE
🔹 NYSE:NMR has bounced from a strong multi-year rising support trendline
🔹 Price remains above this trendline → bullish structure stays intact
🔹 Accumulation Zone: $9.50–$7.50
🔹 Major Breakout Resistance: $26.70
THE KEY LEVEL TO WATCH: $26.70 is the major resistance that could determine the next expansion.
A confirmed 2W breakout and clo
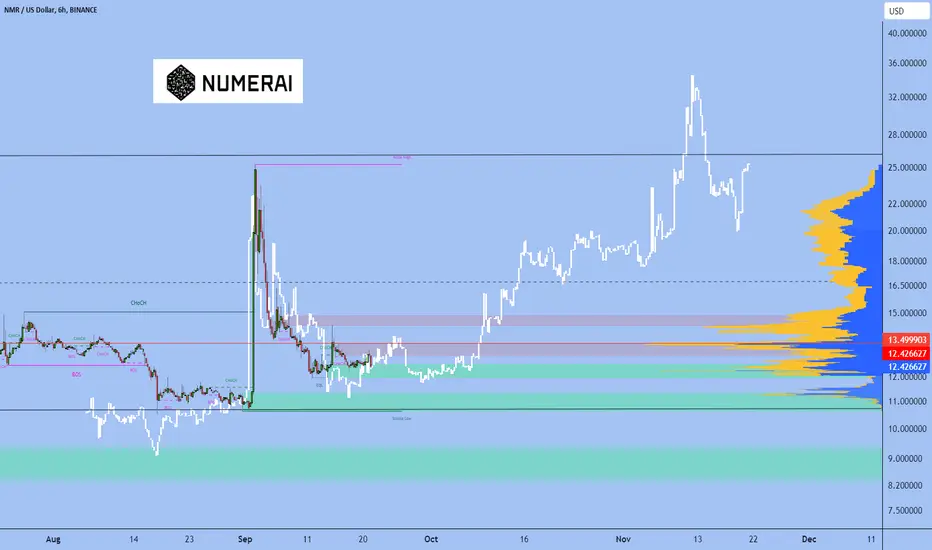
$NMR looks ready for a breakout. Price has been consolidating NYSE:NMR looks ready for a breakout.
Price has been consolidating above key support around $11.5–$13, forming a potential reversal base. A break above the descending trendline could trigger a bullish move toward $17.5, $20, and possibly $23+ in the coming weeks.
As long as price holds above the green zone, the bias remains bullish.
#btc #nmr
NLong
“NMR/USDT Long Breakout Trade – Targeting $19.13”✅ Entry Point (Long):
Entry: Around $16.50–16.70 (break and hold above yellow resistance zone).
Reason: Clean breakout with strong bullish volume + trendline support.
🛡 Stop-Loss:
Stop: $15.42 (below support & trendline).
Reason: If price falls back here, breakout fails = exit fast.
🎯 Target Zones:
TP1: $17.70 (first resistance, partial profit).
TP2: $19.13 (major target zone shown on chart).
Risk/Reward: ~1:2 (good setup).
📝 Summary:
NMR is in strong momentum (+30% daily). Entry abov
NMR - PRICE $24 - $53Price Target Summary
Chart High: Approximately $28 (Nov–Dec 2024)
Recent Low: Around $6 (June 2025)
Key Breakout Zone: $8.50–$9.00
NMR is approaching a critical breakout level and showing signs of bullish momentum.
Short-Term Trend: Mild uptrend forming since mid-June 2025
Volume: Moderate, with some spikes suggesting accumulation
Previous Resistance: Around $9.50 - $10.00
Major Support: Around $6.00 - $6.50
HH on Chart: ~$28 (in late 2024)
2025 - Price Target $24 - $53
Weirdo ancient AI coin NMR may revisit its ATH after allTwo possible scenarios from here: either it reaches its long term trendline from many years ago and rejects from it again to reaccumulate or breakout or it flips it and carries onwards towards its ATH.
Lesson learned? Don't launch a coin if your last name is literally Crab. Your coin will keep crabbing....
Happy trading
Analyzing NMR Bullish Symmetrical Pattern: Breakout ForecastThe NMRUSD pair holds strong support at $11.80, presenting significant potential for a bullish move. If this support level holds, we can expect a notable gain. However, if this support breaks, the next strong support is at $10.66, where a bounce is anticipated due to the proximity of a bull run and the nearing approval of the ETH ETF. We can expect market bullishness in Q4 2024, accompanied by high volatility and substantial rises typical of bull runs.
Anticipated Bull Run Targets:
Based on hi
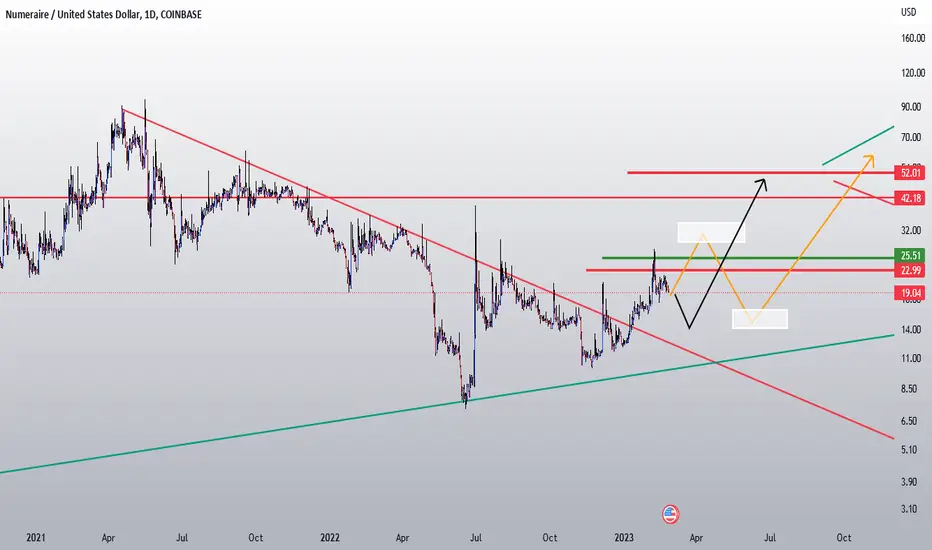
Numeraire is still impressiveThe downtrending line in the graph ends exactly with the value of numerai today, 20,04. While I was making the chart and writing about it, it crossed the fibonacci line and raised higher. We can see a clear upline trend in the last months. That one ends at 27.00 That is around 30% higher and would be a great gain. Followng the uptrend, this can happen in a couple of weeks or 2-3 months. From there there are more directions possible. One of them is a huge gain till its ATH of 168 usd.
Since it
Numerai NMR Potential Nvidia in CryptoNumerai is an innovative hedge fund aggregator that provides a great way for financial advisors and data scientists to earn extra profits based on their prediction models uploaded to the system. Since the launch of Numerai’s hedge fund in 2019, it has provided investors with a +29% return, outperforming every index and benchmark. With Tournament and Signals, anyone can trade equities in real-life markets via Numerai’s software. Numerai creates a global hedge fund driven by the NMR cryptocurrency
NLong
Numeraire: What Goes Up...NMR just had an insider demand pump. 1.618% retracement is expected, since this seems to be the pattern with this particular asset. I don't buy pumps; but I would definitely sell the dump in this case. In terms of shorts, it's easy money -- about 30%. Keep it on the forensic TF (15-30 min) just in case.
Be sure to LIKE and SUBSCRIBE if charts like these are beneficial to you.
Stop getting smashed and start winning in crypto. My charts will teach you how! If you like big wins and big money, be
Numeraire (NMR) - Bullish divergenceOn the above 1-day chart price action has corrected almost 90% from $90 since May 2021. A number of reasons now exist to be long, including:
1) The ‘incredible buy’ signal has printed.
2) RSI resistance breakout.
3) Points 1 and 2 are also true for the BTC pair (below).
4) On the 3-day line chart (below) price action is now testing a significant support and resistance level. A strong move from this level should be expected, look left.
Is it possible price action falls further? For sure.
Is
NMRUSD a crypto sleeping giant?What is NMR?
First of all, what is Numeraire is an Ethereum token that powers Numerai, a San Francisco-based hedge fund that crowdsources artificial intelligence to make investments in major stock markets around the world. Numeraire (NMR) holders can stake their NMR tokens every week on specific predictions. Essentially a hedge fund run by AI. I work in the machine learning industry and can tell you this is game changing technology when applied to charts. Don't worry, I am a hand trader and
NMR BUYMay my new venture be fruitful.
All the best to you, no matter what you do.
A must is to have patience.
My trade needs my care. Some seeds don't grow as big as expected; some died and some grew big and fruitful.
I just keep planting.
Don't be despair on one seed.
NB: Your methodology can be different than mine. Your view can be in minutes to yearly. I respect you in total.
NMRUSD - Looking for Longs!
Analysis suggests possibility for new Bullish leg to start within a few days, so will start looking for Longs in the shaded area - invariably this area will also be the beginning of the Buy Grid should a deeper retrace come in play with Stop-loss below the bottom of the Grid as on Chart.
Always do your own DD!