In-depth trading ideas
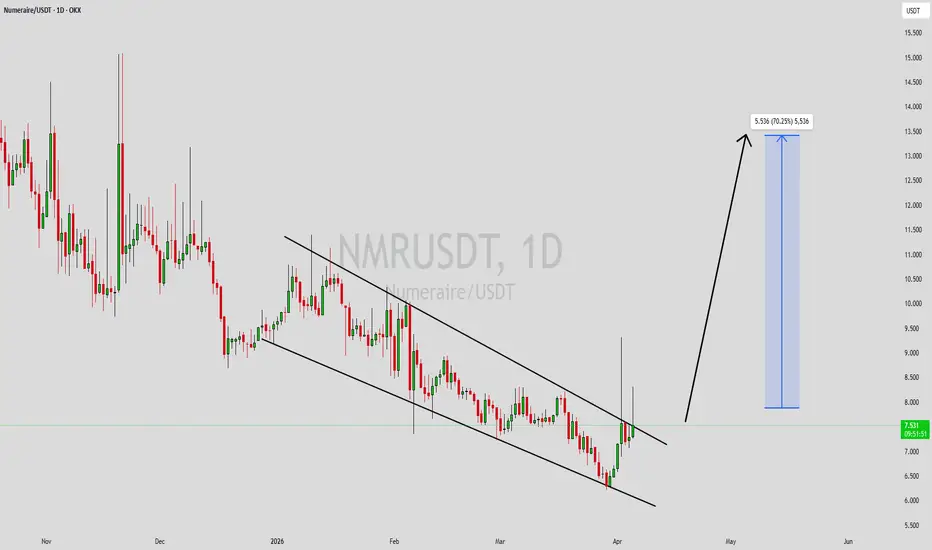
NMRUSDT Forming Bullish MomentumNMRUSDT is forming a clear bullish momentum pattern, a classic bullish continuation signal that often indicates a potential breakout could be approaching soon. The price has been consolidating within a tightening range, suggesting that selling pressure is gradually weakening while buyers continue to regain control around important support levels. This type of setup is commonly associated with accumulation phases before a stronger bullish expansion begins.
The projected breakout from this bullish momentum structure could lead to an impressive gain of around 40% to 50% if the price confirms above the resistance zone with strong volume support. This pattern is frequently observed after corrective phases and may signal a transition from bearish sentiment into a fresh bullish trend.
Traders closely watching NMRUSDT are noticing strengthening momentum as the price approaches a key breakout area. The stable trading volume adds confidence to the setup, showing that buyers may already be accumulating positions in anticipation of a bullish continuation move.
Growing investor interest in NMRUSDT reflects increasing confidence in both its technical structure and long-term upside potential. If the breakout confirms with sustained buying pressure and strong follow-through momentum, this could mark the beginning of a fresh bullish wave.
✅ Show your support by hitting the like button and
✅ Leaving a comment below! (What is your opinion about this coin?)
Your feedback and engagement keep me inspired to share more insightful market analysis with you!
Numeraire (NMR) Keeps Moving Higher: Long-term Growth ActiveApril 2025 and March 2026. The low in April 2025 started a bullish move that lasted almost five months, 142 days. NMRUSDT did some 320% in those days.
March 2026 is the start of another such move. It can last 90 days, 120 days, 150, 180 and so on. It can go for longer.
This bullish move is already in process with NMR hitting today the highest price in five months, since mid-January. Today we have a full green candle revealing a bullish continuation.
The wave last year was gradual in shape. The wave this year can end up being parabolic at the end. It starts slow and then speeds up to end in a massive bull-run. There is huge potential for growth on this chart and trading pair.
The correction and consolidation process lasted a long while, since August 2025. This in turn can support so much green in the coming months and weeks.
Namaste.
NMRUSDT 1D#NMR has broken above the daily SMA200 and the descending broadening wedge resistance with strong volume. However, the daily candle has not closed yet. You can consider building a small position here and adding on the wedge retest. In case of a successful bounce, the potential upside targets are:
🎯 $10.53
🎯 $11.84
🎯 $13.15
🎯 $15.01
🎯 $17.39
⚠️ Always use a tight stop-loss and maintain proper risk management.
#NMR #NMR has successfully broken out of a falling wedge pattern 📈 and is currently retesting the upper boundary as new support around 9.267. A successful hold here could propel the price towards the chart's indicated target of 10.700 🎯, with immediate support at the breakout level. Patience in waiting for pattern confirmation and retests can provide
NMRUSDT UPDATENYSE:NMR Technical Setup Pattern: Descending Trendline Breakout Current Price: $3.45 Target Price: $5.00, $6.29 Target % Gain: 82%+
Technical Analysis: NMRUSDT on the 1D timeframe is breaking out from a descending trendline with strong bullish projection shown on the chart, indicating momentum shift; price structure suggests continuation towards higher resistance with breakout confirmation likely on sustained closes above trendline.
Time Frame: 1D
NMRUSDT Forming Falling WedgeNMRUSDT is forming a clear falling wedge pattern, a classic bullish reversal signal that often indicates an upcoming breakout. The price has been consolidating within a narrowing range, suggesting that selling pressure is weakening while buyers are beginning to regain control. With consistent volume confirming accumulation at lower levels, the setup hints at a potential bullish breakout soon. The projected move could lead to an impressive gain of around 60% to 70% once the price breaks above the wedge resistance.
This falling wedge pattern is typically seen at the end of downtrends or corrective phases, and it represents a potential shift in market sentiment from bearish to bullish. Traders closely watching NMRUSDT are noting the strengthening momentum as it nears a breakout zone. The good trading volume adds confidence to this pattern, showing that market participants are positioning early in anticipation of a reversal.
Investors’ growing interest in NMRUSDT reflects rising confidence in the project’s long-term fundamentals and current technical strength. If the breakout confirms with sustained volume, this could mark the start of a fresh bullish leg. Traders might find this a valuable setup for medium-term gains, especially as the wedge pattern completes and buying momentum accelerates.
✅ Show your support by hitting the like button and
✅ Leaving a comment below! (What is your opinion about this Coin?)
Your feedback and engagement keep me inspired to share more insightful market analysis with you!
NMRUSDT — Beginning of a Reversal or a Fake Break?The chart shows a strong downtrend with the following characteristics:
Consistent Lower Highs & Lower Lows
Price moving along a descending trendline (yellow line) acting as dynamic resistance
Selling pressure has been dominant throughout the trend
However, currently:
Price is approaching and attempting to break above the trendline
There is a rejection and potential retest in the breakout area
Early signs of momentum shift are starting to appear
---
🧩 Pattern Analysis
📌 1. Descending Trendline (Dynamic Resistance)
The trendline has been tested multiple times → making it a strong resistance
A breakout from this trendline could signal an early reversal
📌 2. Base Formation / Accumulation
The 7.20 – 7.60 zone appears to be an accumulation area
Price is starting to form a small higher low → indicating buyers are stepping in
---
🔍 Key Levels
🔴 Resistance:
7.60 (key breakout confirmation)
8.09
8.90
10.00 – 10.50 (major resistance / main target)
🟢 Support:
7.20 – 7.50 (base area)
Breakdown below this → continuation of bearish trend
---
🟢 Bullish Scenario (Reversal / Breakout)
📈 Confirmation:
Price successfully breaks and closes above the trendline + 7.60
A successful retest confirms new support
🎯 Targets:
8.09
8.90
10.00 – 10.50
💡 Potential:
Around +20% – 40% upside from the breakout area
Momentum could accelerate due to trapped short positions
---
🔴 Bearish Scenario (Fakeout / Continuation)
📉 Confirmation:
Failure to hold above 7.60
Price falls back below the trendline
Breakdown below 7.20
🎯 Targets:
6.50 – 6.00 (new lower lows)
Continuation of the downtrend
💡 Insight:
Fake breakouts are common in early reversal phases → strong confirmation is required
---
⚖️ Conclusion
Main trend: Still Bearish
Current condition: Critical breakout zone
This area is a key decision point
👉 Valid breakout = early reversal
👉 Failed breakout = continuation lower
#NMR #CryptoAnalysis #TechnicalAnalysis #Altcoins
#Downtrend #TrendlineBreak #BreakoutSetup #CryptoTrading #SupportResistance
#PriceAction #AltcoinTrading #ChartAnalysis #BullishReversal #BearishContinuation
$NMR is ready to flyNMR technicals bullish
NMR’s chart reflects a mix of institutional validation (JPMorgan), proactive tokenomics (buybacks/staking), and technical momentum. While broader crypto sentiment remains fearful, NMR’s unique AI hedge fund model and scarcity drivers position it for volatility with upside potential.
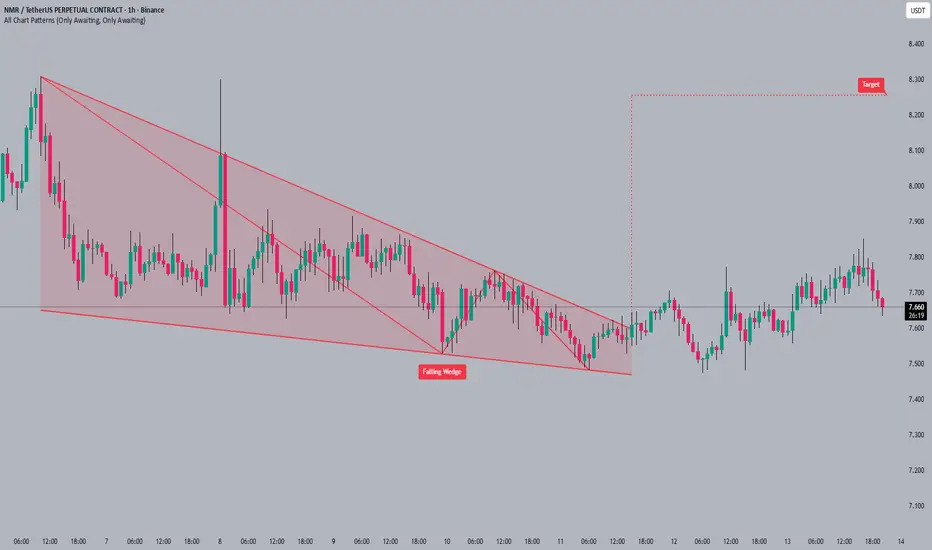
#NMR has broken out of a falling wedge pattern #NMR has broken out of a falling wedge pattern and is currently trading around 7.663. The falling wedge is a bullish pattern that suggests a potential reversal of the downtrend . The next target for #NMR is around 8.300, which is the projected price after breaking out of the wedge.
Always wait for confirmation and increased volume before entering a trade!
#NMR #crypto #trading #altcoin
Numeraire points to a bullish breakout nextAs we already looked at some of the biggest projects we finally get to the "altcoins," the smaller altcoins that is. The side of the market that we care for and love so much.
I am showing you Numeraire, NMRUSDT, on the daily timeframe. Immediately we can appreciate a rising trend. A very strong chart pattern with higher highs and higher lows.
It gets even better, this chart structure clearly shows in favor of the continuation of the bullish trend, for a strong bullish move next. The market is one; what one does, the others do the same.
This statement can be easily proved by looking at just two points on this chart. The date is 7-April 2025, the entire market on this date produced a major low. The date is October 2025, on this date, the entire market went through a flush.
In the same way, but with variations, the market was rising in Q2 and Q3, and this happened for hundreds and hundreds of pairs.
Now, the market has been bearish and consolidating at bottom prices... As project after project starts to break bullish, we know they are all set to do the same.
Numeraire is bullish now, it has been bullish for months. I see a continuation happening next, a strong bullish breakout, what do you see?
Thank you for reading.
Namaste.
NMR Forming Falling Wedge at Macro Demand ZoneNMR is trading inside a falling wedge structure, with price compressing between descending resistance and rising demand. This is a classic bullish reversal pattern forming after an extended downtrend.
Price is currently holding the 8.66–9.18 demand zone while pressing toward wedge resistance around 10.7–10.8. A confirmed breakout and acceptance above the wedge resistance would indicate a momentum shift, targeting 13.20 initially, with a larger upside extension toward the macro resistance near 24.50.
Failure to hold above 8.66 would invalidate the wedge and keep the bearish structure intact.
NMR/USDT 1D Chart Long Review🔎 Market Structure
Main Trend: Down
→ Series of lower highs and lows
→ Breakout below the downtrend line (which has already happened)
Currently, the price is consolidating low, with no trend reversal signal.
📉 Price Action
After a strong upward impulse (pump), the market:
failed to maintain the structure
gave back most of the gains
Current price ~9.3 USDT
No clear demand – small candles, weak momentum
🧱 Key Levels (very important)
🔴 Support
9.00–9.30 → local, weak
~8.00 → demand zone / lower consolidation range
5.94 → HARD SUPPORT
Loss = possible further decline / capitulation
🟢 Resistance
12.36 → nearest Sensible resistance (flip level)
14.98 → strong structural resistance
19.59 – 22.77 → distribution zone (very difficult to break)
26.74 – 27.58 → local ATH/supply zone
📊 Stoch RSI indicator
Currently emerging from oversold territory
This is not a long signal per se
It only gives:
short-term bounce if volume appears
🧠 Scenarios
🟡 Baseline scenario (most likely)
Consolidation 8–10 USDT
Lack of strength for a breakout
The market is waiting for:
BTC move
or news/volume
🔴 Bearish scenario
Loss of ~8 USDT
Test of 5.94
If 5.94 falls → new Lows
🟢 Bullish scenario (conditional!)
D1 close above 12.36
Retest as support
Targets:
14.98
19.59
Without this → no medium-term longs
$NMR is sitting right on its demand zone and the chart looks NYSE:NMR is sitting right on its demand zone and the chart looks primed for a breakout. Price has held this accumulation range for months, and the downtrend line has been losing strength with every retest. If buyers protect this zone and we get a push through the trend line, a break and hold above 12.5 becomes the real trigger. Clear that level and the move toward 22 to 25 can unfold quickly. This setup only needs one strong impulse to flip the entire narrative.
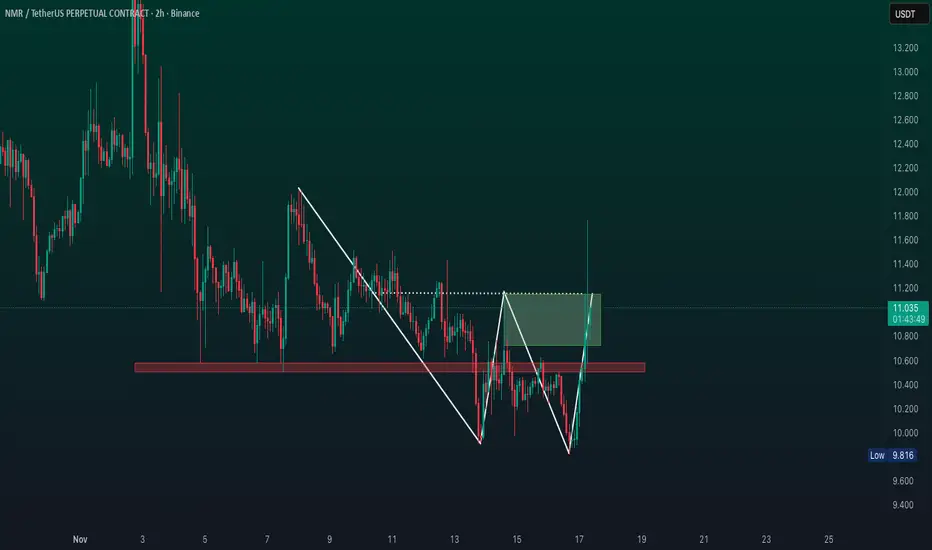
NMR/USDT | Institutional Order Flow Analysis (ICT Perspective)Price recently delivered a sharp move down from the upper bearish Order Block (OB) around the 14.0 region, filling previous imbalances (-iFVG) and confirming a short-term Market Structure Shift (MSS) to the downside.
Currently, NMR is reacting within a bullish Fair Value Gap (+iFVG) zone, but liquidity beneath the recent low remains uncollected. This indicates the probability of another liquidity sweep toward the lower OB (~11.0-11.2 zone), where multiple confluences align
Old demand zone + OB
+FVG (Fair Value Gap)
Institutional Discount Zone
Potential Inducement setup (SMT and IDM levels marked)
After liquidity is taken and we see displacement with bullish intent, price could retrace back toward the 13.8-14.0 OB, which aligns with premium re-pricing.
Execution Plan:
Watch Zone: 11.0–11.3 → Look for bullish confirmation (MSS + displacement).
Target Zone: 13.6–14.0 OB.
Invalidation: Clean break below 10.8 with no bullish displacement.
Note: Stay patient & DYOR — let liquidity form first. Reaction at the 11.0 handle will define the next leg.
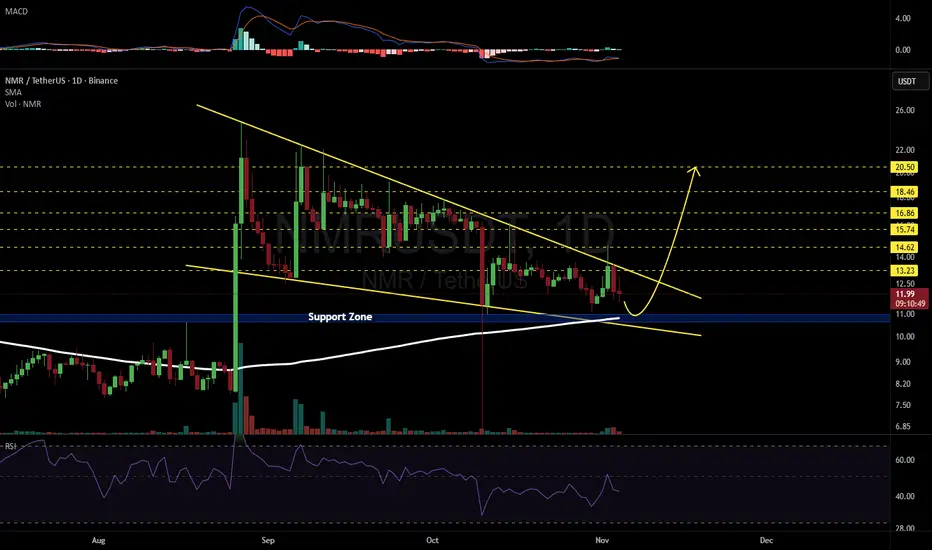
NMRUSDT 1D#NMR is currently trading within a falling wedge pattern on the daily chart. Consider accumulating a small position near the support zone, which aligns with the daily SMA200. In case of a breakout above the wedge resistance, the potential upside targets are:
🎯 $13.23
🎯 $14.62
🎯 $15.74
🎯 $16.86
🎯 $18.46
🎯 $20.50
⚠️ Always remember to use a tight stop-loss and maintain proper risk management.