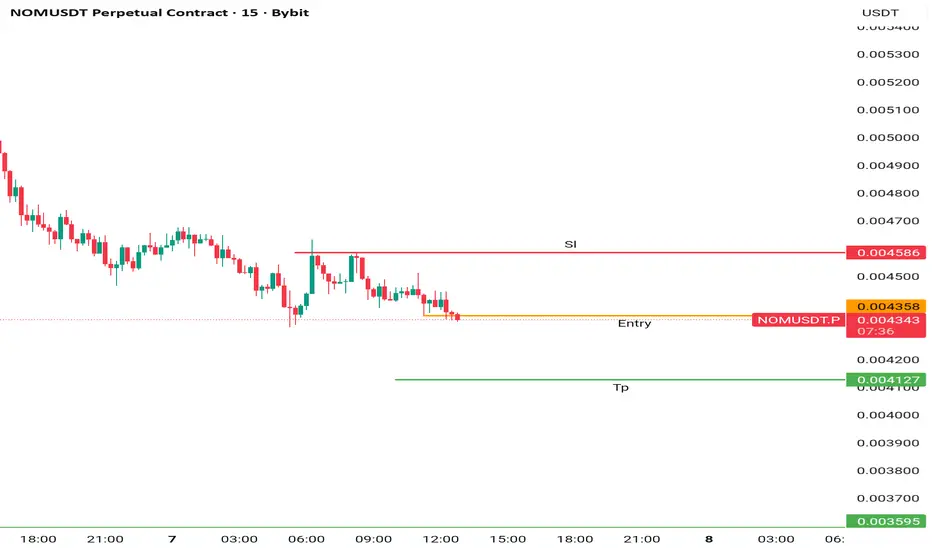
NOM / TetherUS PERPETUAL CONTRACT
No trades
No trades
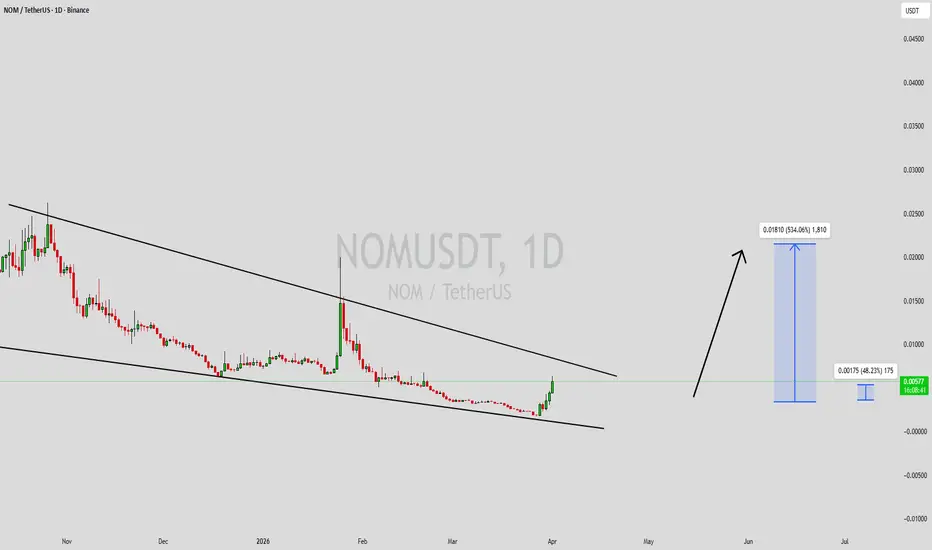
NOMUSDT Forming Falling WedgeNOMUSDT is currently forming a clear falling wedge pattern, a classic bullish structure that often signals an upcoming breakout. The price has been consolidating within a narrowing range, indicating that selling pressure is gradually weakening while buyers are beginning to regain control. With consi
NOM just cooling off before the next leg upAlright, let’s break down NOM / USDT (1H) like a proper crypto degen 👇
What just happened:
Price went absolutely vertical — clean impulsive move up, smashing through resistance and printing higher highs like it’s nothing. That’s strong momentum.
Now? We’re getting a pullback. Totally normal after
NOMUSDT — 233% Bounce, 27.2x Para, Full Send With 0 Supply ZonesSpot volume hit 3.92B against 49.25B on the futures side, pushing the futures-to-spot dollar ratio to 22.64M versus 284.37M — a futures-heavy setup at 12.58x High leverage. This is not a clean spot-led breakout. The F/S ratio at this level means speculative positioning is running well ahead of real
NOMUSDT Forming Falling WedgeNOMUSDT is forming a clear falling wedge pattern, a classic bullish reversal signal that often indicates an upcoming breakout. The price has been consolidating within a narrowing range, suggesting that selling pressure is weakening while buyers are beginning to regain control. With consistent volume
See all ideas
Summarizing what the indicators are suggesting.
Oscillators
Neutral
SellBuy
Strong sellStrong buy
Strong sellSellNeutralBuyStrong buy
Oscillators
Neutral
SellBuy
Strong sellStrong buy
Strong sellSellNeutralBuyStrong buy
Summary
Neutral
SellBuy
Strong sellStrong buy
Strong sellSellNeutralBuyStrong buy
Summary
Neutral
SellBuy
Strong sellStrong buy
Strong sellSellNeutralBuyStrong buy
Summary
Neutral
SellBuy
Strong sellStrong buy
Strong sellSellNeutralBuyStrong buy
Moving Averages
Neutral
SellBuy
Strong sellStrong buy
Strong sellSellNeutralBuyStrong buy
Moving Averages
Neutral
SellBuy
Strong sellStrong buy
Strong sellSellNeutralBuyStrong buy
Displays a symbol's price movements over previous years to identify recurring trends.