NOTUSDT 3DAccumulate a small bag of #NOT here and near the support zone for the mid-term. In case of a breakout above the descending resistance on the 3-day chart, the potential upside targets are:
🎯 $0.000633
🎯 $0.000822
🎯 $0.000976
🎯 $0.001129
🎯 $0.001346
🎯 $0.001624
⚠️ Always remember to use a tight stop-loss and maintain proper risk management.
In-depth trading ideas
Notcoin update: 385%, 1000% & 1700% Profits PotentialNotcoin's (NOTUSDT) higher low and bottom recovery process has been ongoing for a full 350 days, if we go back all the way to the October 2025 flush low as the start, but this would be a bit misleading.
After the October 2025 flush, NOTUSDT continued to move within a downtrend. Lower lows based on candle closure and sustained bearish action. Only after February 2026 do we see the cessation of the downtrend, the first bullish move and a prolonged bottom accumulation phase.
We can count starting
NOT / NOTUSDT Long Setup | Breaker Block ReclaimMARKET ANALYSIS
NOT is currently reacting from a key technical area highlighted on the chart.
As long as the protected support zone remains intact, the bullish market structure remains valid and higher liquidity targets may continue to attract price action.
A breakdown below the invalidation level would weaken the current bullish scenario and require a reassessment of market conditions.
📍 Entry, Stop Loss and Take Profit levels are marked directly on the chart.
━━━━━━━━━━━━━━
⚠️ DISCLA
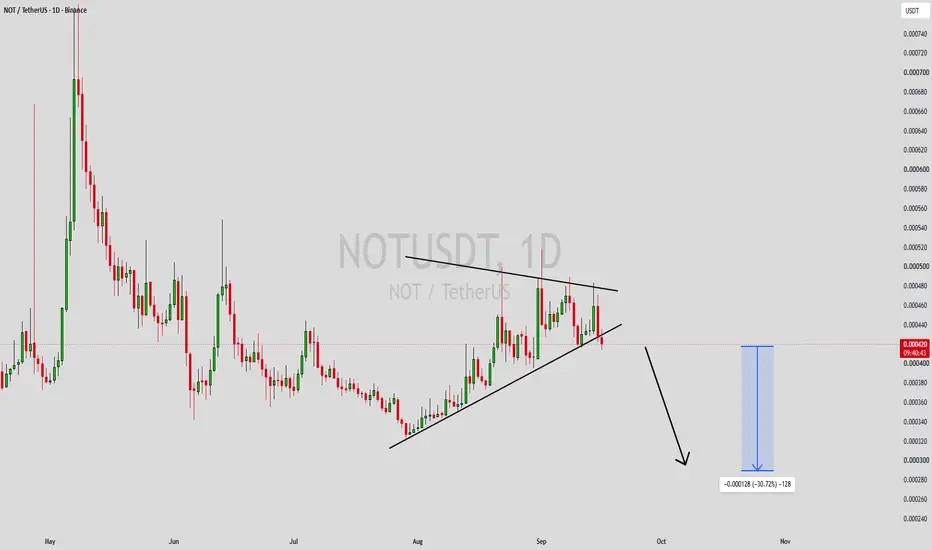
NOTUSDT Forming Falling WedgeNOTUSDT is forming a clear falling wedge pattern, a classic bullish reversal signal that often indicates a gradual drop. The price has been consolidating within a narrowing range, suggesting that selling pressure is weakening while buyers are beginning to regain control. With consistent volume confirming accumulation at lower levels, the setup hints at a potential bullish breakout soon. The projected move could lead to an impressive gain of around 20% to 30% once the price breaks above the wedge
Notcoin: 1,000% Profits potential, bullish chart setupNOTUSDT (Notcoin) has the same chart structure from months ago, the action is happening within the same range from the February low with a bullish bias. A breakout is happening now. This is a very strong chart setup and hard to match.
There is still a huge 380% profits potential before the first target is hit. This would be a price tag entering the late 2025 top range, somewhere around August (0.00235).
Just a tiny bit higher today and NOTUSDT will be looking at the highest price in months, s
NOTUSDT Forming Bullish MomentumNOTUSDT is forming a clear bullish momentum pattern, a classic bullish reversal signal that often indicates an upcoming breakout. The price has been consolidating within a narrowing range, suggesting that selling pressure is weakening while buyers are beginning to regain control. With consistent volume confirming accumulation at lower levels, the setup hints at a potential bullish breakout soon. The projected move could lead to an impressive gain of around 60% to 70% once the price breaks above
#NOTUSDT — Holding the Last Fortres, Recovery or Final Break#NOT
The price is moving within a descending channel on the 1-hour timeframe and has reached the lower boundary. It is now poised for a bounce and is expected to retest this boundary.
The Relative Strength Index (RSI) indicates a downward trend, which is likely to continue given the overbought conditions.
There is a key support zone (in green) at 0.000348. The price has bounced off this zone several times, making it a strong support level.
The price is trending towards the 100-period moving
NOT/USDT H2: Technical overbought condition near key🎯 TP1: $0.00040985 (+1.31%) │ TP2: $0.00040440 (+2.62%)
🛑 SL: $0.00042521 (-2.39%) │ R/R: 1 : 1.1
⚠️ SL is placed beyond the nearest candle tails to reduce the risk of accidental stop-outs.
FUNDAMENTAL BACKGROUND
NOT/USDT is moving without its own catalysts, following the broader market. The recovery of BTC and ETH over the past day has supported altcoins, but local overheating on the pair is evident. Macro factors remain neutral—the next Federal Reserve (FED) meeting on 16.09.2026 is still 27
NOTCOIN ($NOT): The Sleeping Giant is Waking Up! Prime Buy SetupAre you paying attention to the TON ecosystem? Because if you aren’t, you might be missing out on the next massive wave. 🌊
After a period of healthy consolidation, Notcoin (NOT/USDT) is flashing some serious bullish signals on the chart. What started as a viral Telegram game has cemented itself as a powerhouse in the Web3 space, bringing millions of new users into crypto. Now, the technicals are starting to align perfectly with the strong fundamentals.
Here is why XETR:NOT is currently at th
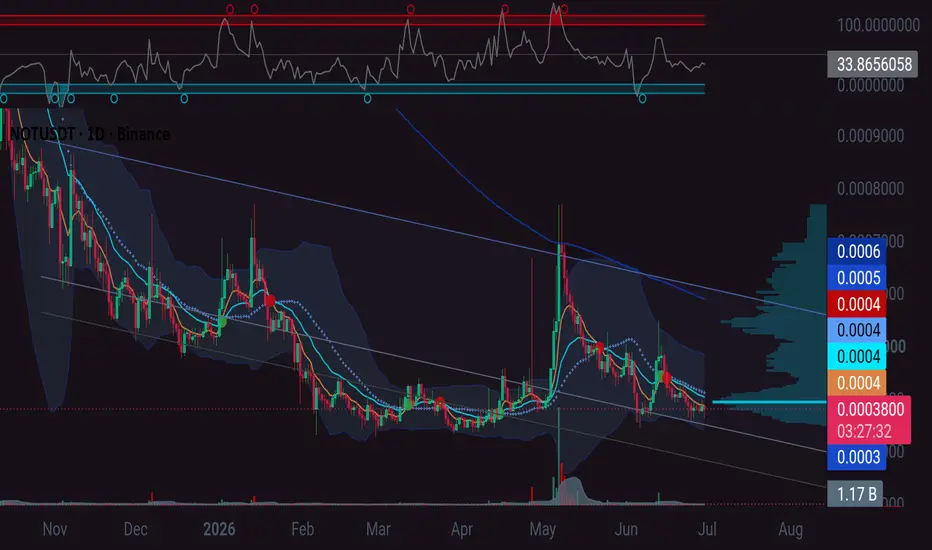
NOTUSDT - Descending Triangle Breakout or Breakdown?📊 Technical Analysis | $NOT/USDT
⏳ Time Frame: 4D
🏦 Exchange: MEXC
📐 Pattern: Descending TrendLine + Descending Triangle
🟨 Key Support Zone: $0.000385 – $0.000320
━━━━━━━━━━━━━━━━━━
🔎 📊 CHART ANALYSIS
🔻 1. 📉 Descending TrendLine
📌 XETR:NOT is still trading below the Descending TrendLine, which has been putting pressure on price over the long term. Previous rallies have generally faced rejection ❌ when approaching the trendline.
━━━━━━━━━━━━━━━━━━
🟨 2. 🛡️ Yellow Support Block
💪 The $0.0003
NOT / NOTUSDT Bullish Setup | Futures Trade Idea
SOMI / SOMIUSDT Long Setup | Breaker Block Reclaim
MARKET ANALYSIS
NOT is currently reacting from a key technical area highlighted on the chart.
As long as the protected support zone remains intact, the bullish market structure remains valid and higher liquidity targets may continue to attract price action.
A breakdown below the invalidation level would weaken the current bullish scenario and require a reassessment of market conditions.
📍 Entry, Stop Loss and Take Profit levels are mar
#NOTUSDT — Holding the Last Fortres, Recovery or Final Break#NOT
The price is moving within a descending channel on the 1-hour timeframe and has reached the lower boundary. It is now poised for a bounce and is expected to retest this boundary.
The Relative Strength Index (RSI) indicates a downward trend, which is likely to continue given the overbought conditions.
A key support zone has been identified in green at 0.000345. The price has bounced off this zone several times, making it a strong support level.
The price is trending towards the 100-perio
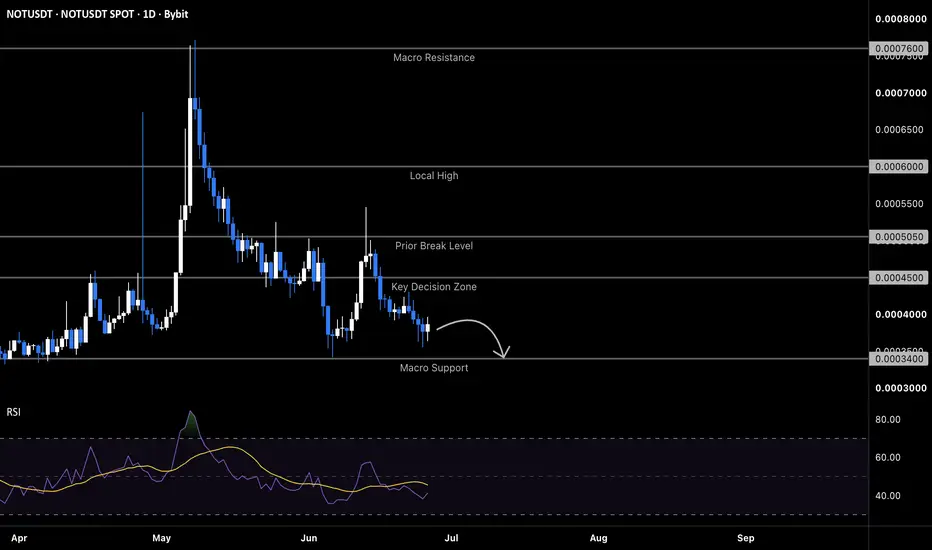
NOTUSDT: local squeeze with $0.000300 destinationThe Macro Picture 🗺️
Since the May peak, NOT has wound itself into a textbook Local Squeeze — a descending series of lower highs ($0.000600 → $0.000505 → $0.000490) pressing down on a perfectly flat $0.000340 floor. That structure is a coil, and coils store energy for one decisive release: each bounce dies earlier than the last while the floor refuses to move, concentrating sell-side pressure against a single line. Price now sits in the lower third of the range near $0.000385 with RSI flat in
NOTUSDT at macro floor: breakdown toward $0.000300The Macro Picture 🗺️
The June bounce off $0.000340 promised a reclaim but never delivered — price stalled at a lower high near $0.000505, got sold inside the supply band, and has spent the back half of the month grinding straight back down to the macro floor. That is the signature of a failed structural reset: each rally attracts less buying, and the $0.000340 floor that has held since February now desperately needs to be tested again — this time with momentum against it. RSI has faded from 62
NOTUSDT — Active Bearish Sequence With Liquidity ClearedOKX:NOTUSDT is showing a clean bearish continuation structure on the 30M.
The sequence is still active. B has not been invalidated, and the C target remains unreached. That matters because as long as B holds, the downside objective is still alive.
What makes this setup interesting is not just the bearish sequence itself. It is the liquidity behavior around the trendline.
Price pushed into the BC area, violated the trendline, and created a trap on both sides.
Early sellers were liquidated on
Notcoin bottom consolidation continues, bullish bias strengthensWith each day that passes with Notcoin trading above support, the bullish bias becomes stronger. With each day that passes with a lack of bearish action, the bulls become stronger.
Good afternoon my fellow Cryptocurrency trader, I hope you've been having a wonderful day.
NOTUSDT is looking good and this chart setup allows for a new entry if you missed the previous one. That is, there is a new opportunity to enter a LONG with 2-4X in anticipation of a new wave of growth. You know how it goes, t
NOT Local trend. Sideways -98%. Reversal zones 27 01 26Logarithm. 3-day time frame.
The price in the main trend is still in a downward channel with a given volatility range.
Medium-term - locally , another sideways trend has formed (the third in a downward channel), but the decline is already -98% (not counting the futures long, which was previously down by -99%). Typically, such low-liquidity hype scams decline by -94-98% (with rare exceptions of -99% or a complete scam project, based on some fiction).
It's important to understand that the c
NOT Main Trend. Descending Channel -98% 01/27/2026Logarithm. Time frame: 1 week.
The price is in the main trend and remains in a downward channel with a given volatility range.
It's important to understand that the creators of this cryptocurrency always sell at any price (they're created for profit, fueled by hype). However, at low prices (-94-99%), a dilemma arises:
1️⃣ invent a reason for a scam and abandon the project;
2️⃣ or reverse the trend and temporarily restore faith in this scam cryptocurrency. In order to continue sal
NOTUSDT: bullish spike toward $0.000600The Macro Picture 🗺️
Zoomed out to the full descent from the $0.0020 launch, NOT has spent eight months grinding into a macro base, with the floor at $0.000340 holding every test since February — a structural reset that demands the kind of deep, patient accumulation that precedes a real reversal. The early-June flush tagged that macro support once more, found no sellers beneath it, and reversed hard. Price now sits mid-impulse, pressing back up through the range with the $0.000340 floor freshl
Notcoin (NOT) Full Reset: Back Within Opportunity Buy-ZoneNotcoin went through a full reset. The trading moved back within the bottom accumulation range. The lowest prices as part of the extended higher low after the October 2025 flush. A slightly higher low is present on the current drop but virtually all the same.
While NOTUSDT is back within the opportunity buy-zone, it isn't likely to remain in this zone for too long. The first time consolidation happens at bottom prices it can last months, the second time though it is a more brief process, a rete
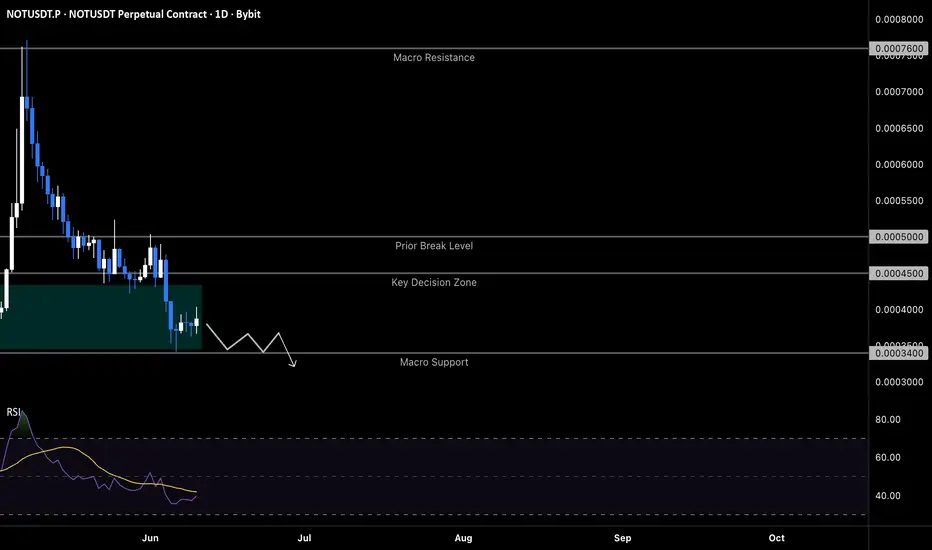
NOT at macro floor: breakdown toward $0.000300The Macro Picture 🗺️
The May vertical rally into $0.000760 has been fully unwound — a textbook structural reset. That spike was a liquidity hunt above the range highs, not a trend change: price tagged the macro ceiling, cleared out breakout buyers, and returned the entire move within five weeks. NOT is now back at the lower boundary of the multi-month accumulation box between $0.000340 and $0.000435, and the macro floor at $0.000340 desperately needs to be tested again. Each revisit — late Mar
#NOTUSDT — Holding the Last Fortres, Recovery or Final Break#NOT
The price is moving within a descending channel on the hourly timeframe. It has reached the lower boundary and is trending towards a bounce. A retest of this boundary is expected.
The Relative Strength Index (RSI) indicates a downward trend, and this trend is likely to continue due to the overbought condition.
A key support zone has been identified in green at 0.000490. The price has bounced off this zone several times, making it a strong support level.
The price is trending towards the