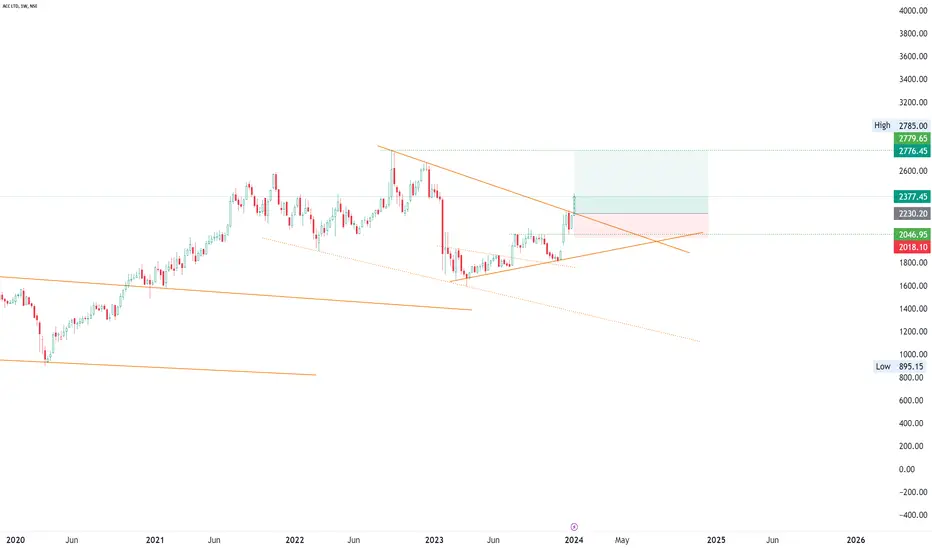
Long
Long
ACC Limited
No trades
No trades
In-depth trading ideas
Long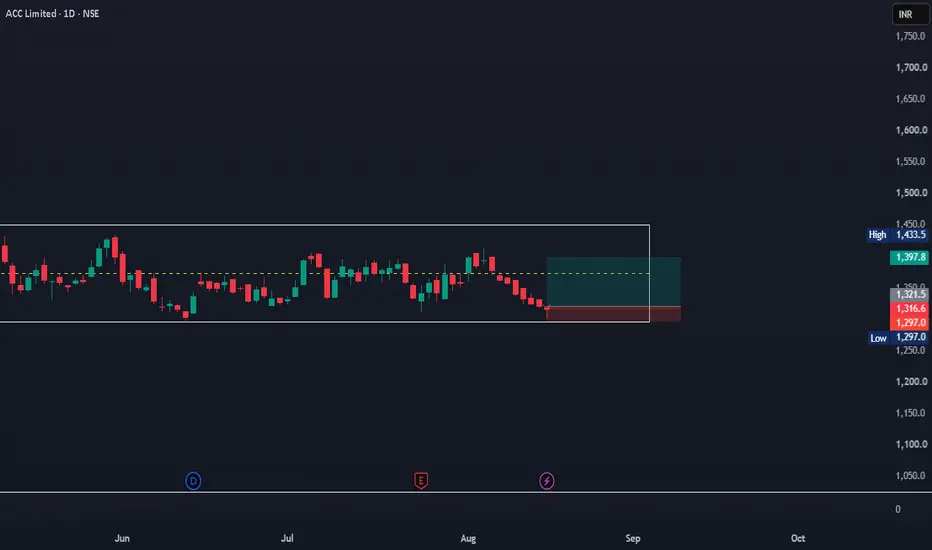
Acc long Most Volume area this stock have reached on most volume area now and now this time it is retesting it again and even Rsi Divergenge in present as well
Long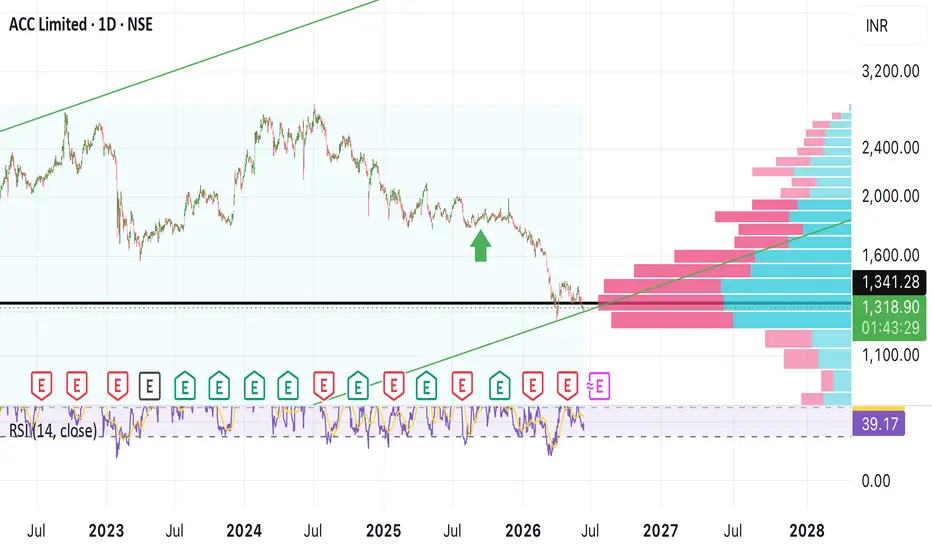
Support ACC repeatedly taking support on the monthly chart for the 4th time shows a very strong demand zone. Buyers are defending this level again and again, indicating possible accumulation by strong hands. As long as the support holds, bullish reversal chances remain active. A strong breakout from here can lead to a sharp upside move, while a monthly close below support may trigger weakness. Technical structure currently suggests a high-attention zone for positional traders.
Long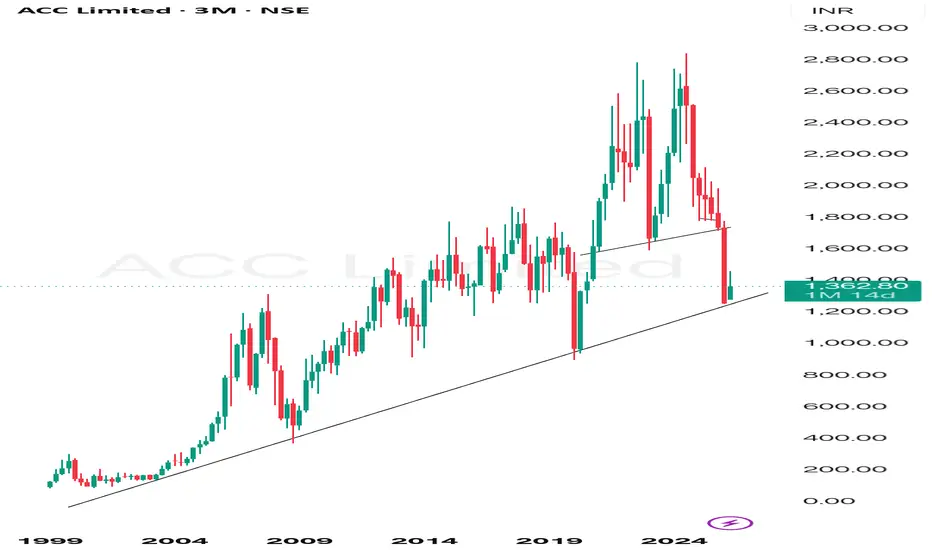
Support ACC repeatedly taking support on the monthly chart for the 4th time shows a very strong demand zone. Buyers are defending this level again and again, indicating possible accumulation by strong hands. As long as the support holds, bullish reversal chances remain active. A strong breakout from here can lead to a sharp upside move, while a monthly close below support may trigger weakness. Technical structure currently suggests a high-attention zone for positional traders.
Long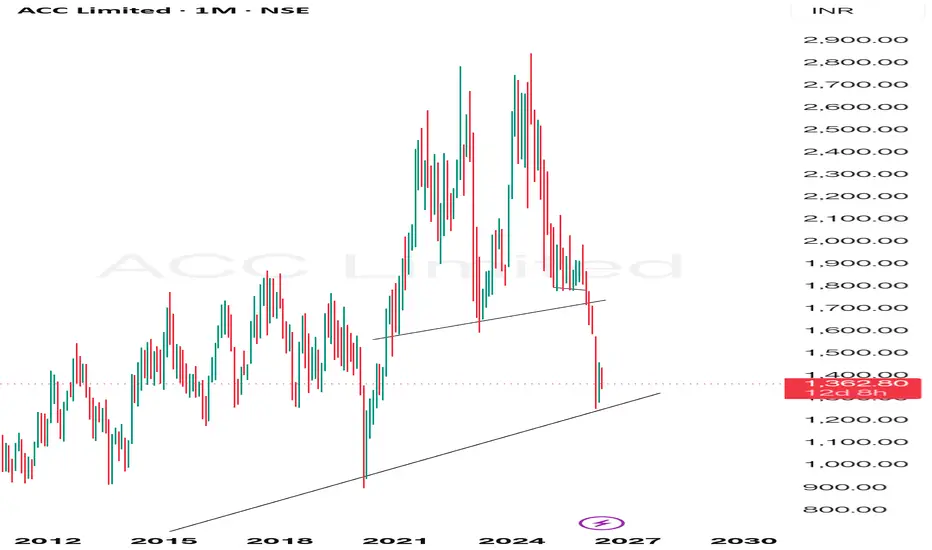
acc a falling knife acc on bearish note looks to enter in buying zone between 1600-1670 a good bet , however one good jerk is required.
Long
AccHi,
Price making triangle 📐 Pattern near support area so possiblity that it will be moves upper side.
Let's see what happens
This idea is for Educational purpose and paper trading only. Please consult your financial advisor before investing or making any position. Facts or Data given above may be slightly incorrect. We are not SEBI registered
Long
ACCHi,
Price traded at near support area,
So possible that price will be moves upper side, Let see what happens.
This idea is for Educational purpose and paper trading only. Please consult your financial advisor before investing or making any position. Facts or Data given above may be slightly incorrect. We are not SEBI registered
Long
ACC / 05.10.2025 / LONGThis share may give 4% Profit, if Entry order triggered after I posted.
Take position as per your risk reward ratio and that is not recommended, only for educational purposes.
Long
ACC - RISING WEDGE [BEAR ] - Upcoming Breakout detected using AII am not a SEBI-registered investment advisor. The information provided here is for educational and informational purposes only and should not be construed as financial or investment advice. Please do your own research or consult with a SEBI-registered financial advisor before making any investment decisions. Investments in the securities market are subject to market risks. Read all the related documents carefully before investing.
All the Data available in the chart itself.
Short
ACC , 1W Breakout In this stock we clearly see the Channel or Wedge pattern is formed and Ready for Breakout , Wait for candle Close in 1D with good volume , then we can see very good move up to 45% nearly .
As now nifty is given Breakout from 1D Channel pattern and in Market Breadth 1D has given breakout and in weekly market Breadth it is near the Resistance , if we see good volume close in this week we can expect Market will be Bullish for next 2-3 Months .
Follow for more Swing Ideas Like This .
Long
ACC BuyACC shares seem to take support after breaking the channel resistance line. Buy @CMP (1850) with a SL of 1775 and target of 1950 & 2100.
Long
ACC - Long - Positional ACC on day timeframe shows consolidation at bottom. It has now strong base and support at 1800. All 20, 50, 100, 200 EMAs are coming together to squeeze and then breakout. Also it shows Cup formation pattern where price will follow right side of cup on uptrend. Bullish signal positional for target of 2600+
Long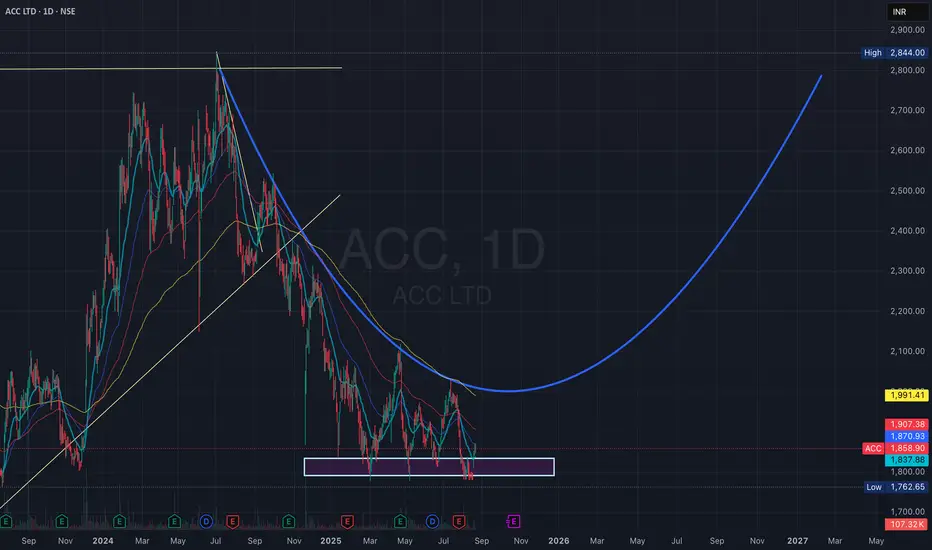
ACC Ltd. – Triple Bottom Pattern | Swing Trade Setup
ACC Ltd. is currently showing a Triple Bottom formation on the weekly chart, indicating strong support around the ₹1810 - ₹1793 level . This pattern suggests that bearish pressure is weakening and a potential reversal is on the cards.
🔍 Key Technical Highlights:
Triple Bottom: The stock has tested the same support zone three times without breaking down, which is a classic bullish reversal signal.
Price Action: Current price is near the support base, offering a favorable risk-reward entry zon


ACC - ACC Ltd (Daily chart, NSE) - Long PositionACC - ACC Ltd (Daily chart, NSE) - Long Position
Risk assessment: Medium {support structure integrity risk}
Risk/Reward ratio ~ 2.75
Current Market Price (CMP) ~ 1848
Entry limit ~ 1845 to 1835 (Avg. - 1840) on July 28, 2025
Target limit ~1950 (+5.98%; +110 points)
Stop order limit ~ 1800 (-2.17%; -40 points)
Disclaimer: Investments in securities markets are subject to market risks. All information presented in this group is strictly for reference and personal study purposes only and is no
Long
ACC Trade Setup for the Week(14–18 July 2025) – Uptrend ChannelACC Ltd. (NSE: ACC) has been trading inside a clean uptrend channel for the past few weeks, bouncing consistently between rising support and resistance. Now, it approaches a critical inflection point — the lower support of the channel.
While no breakdown has occurred yet, the structure is weakening, and a bearish opportunity may soon present itself. Let’s explore how to trade this if the setup confirms.
1. What’s Happening on the Chart?
ACC is trading close to the channel support zone (~₹
Short
ACC BULL waves started BIG Giant Ready to Roll !!!ACC daily counts suggested DUAL match for Eillot waves + Harmonics bullish Wave structure
both looks bullish implus started for this stock
LONG TERM investors get ready for good returns in future for 2 to 5 yrs
all charts shown to understand elliot waves theory + harmonics waves + gann theory + time theory
all charts are education purpose!!!!!
we don't any responsibilities for profit /loss
Long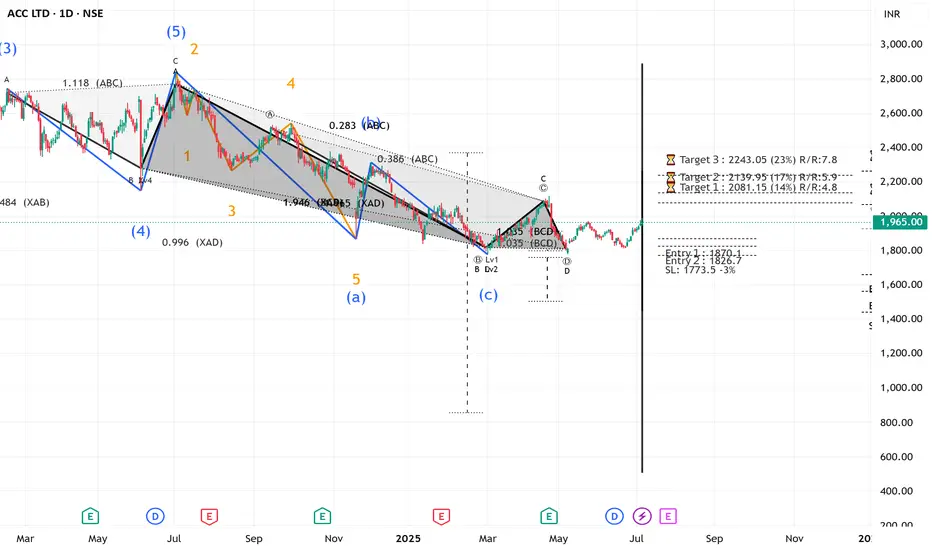
ACC - FOR SWING TRADE Currently price is making a Double Bottom pattern in weekly time frame.
After a trendline breakout price hunt all the buyers stoploss downside.
Now price is again showing us a bullish move with the good bullish engulfing candle in weekly time frame.
Long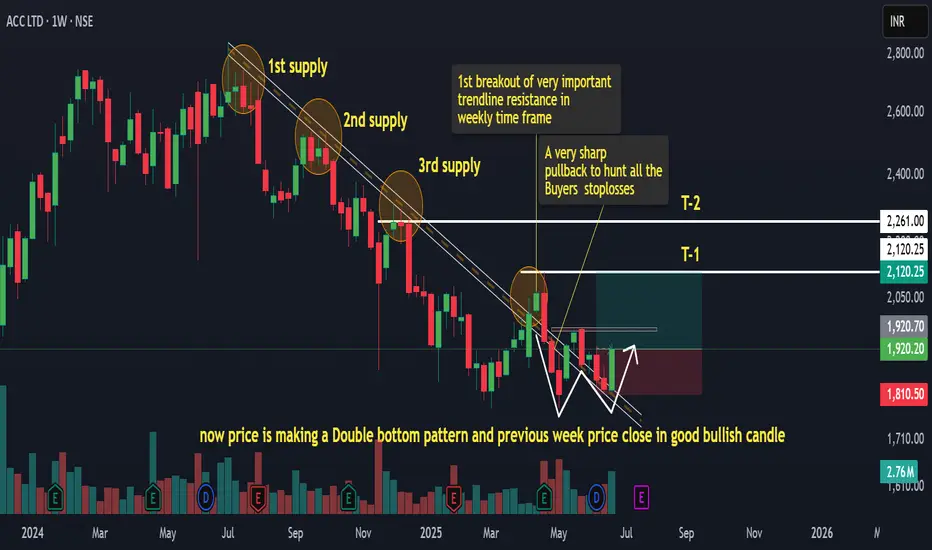 Long
Long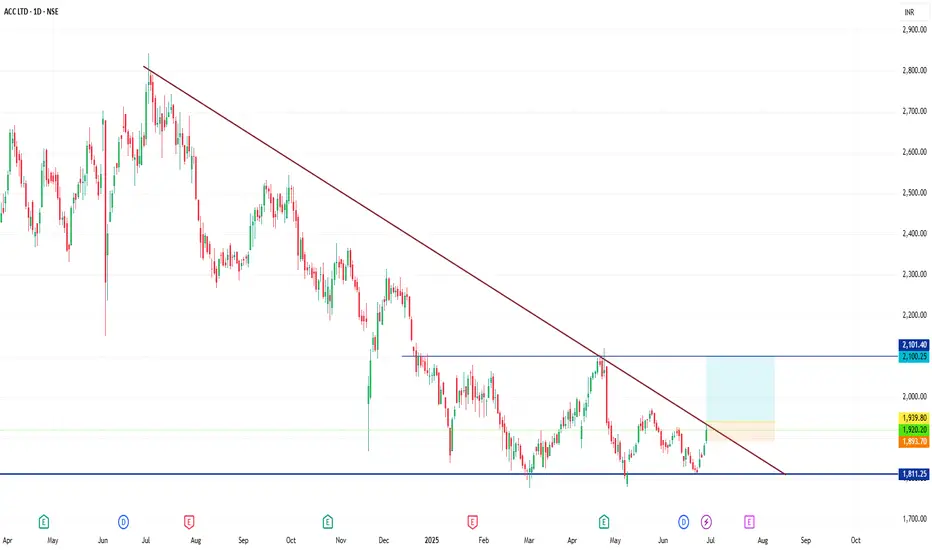
ACC given breakout . Target 2100ACC 1959 has given a good breakout. Expected to test 2100.
It is undervalued and is capable of moving to target 2,848

ACC Short play idea for May 2025ACC, daily charts, spot prices. Price is already in downtrend. It has broken below a channel. Price objective is 190 points below breakout from the lower trendline. An alert has been set for tgt price at 1735

ACC- weekly at trendline supportCement stocks have seen earnings positivity from analysts after along time
ACC is at major weekly support here (ignoring the covid slam dunk)
Longs can be taken for portfolio buy
Long
ACCNSE:ACC
One Can Enter Now !
Or Wait for Retest of the Trendline (BO) !
Or wait For better R:R ratio !
Note :
1.One Can Go long with a Strict SL below the Trendline or Swing Low.
2. R:R ratio should be 1 :2 minimum
3. Plan as per your RISK appetite and Money Management.
Disclaimer : You are responsible for your Profits and loss, Shared for Educational purpose