ADANIGREEN to replicate BHEL's June Ending Diagonal Price action
TF: 75 minutes
CMP: 1520
The observation is that, price is forming and ED (Ending Diagonal) and we could expect a pullback on this counter.
Similar move and price action happened in BHEL in the previous month and I believe that both the chart set ups are identical to a great extent.
Here is the chart of BHEL with impulse move, and prolonged Ending Diagonal Formation, before it fell down in June (first leg of the correction)
Let's see how July unfolds for Adanigreen.
As you can see, the RR is not good for buying on this counter at 1500 levels and it is better to wait for a pullback.
Disclaimer: I am not a SEBI registered Analyst and this is not a trading advise. Views are personal and for educational purpose only. Please consult your Financial Advisor for any investment decisions. Please consider my views only to get a different perspective (FOR or AGAINST your views). Please don't trade FNO based on my views. If you like my analysis and learnt something from it, please give a BOOST. Feel free to express your thoughts and questions in the comments section.
In-depth trading ideas
Adani Green Energy LimitedShare price declines in Adani Group names following regulatory/legal developments involving the U.S. SEC that spooked investors, leading to sharp sell-offs
From early January levels near ₹1,030+ to ₹1,040+ to ~₹770–₹780 by 23 Jan 2026, the stock declined roughly 20-25% over the month.
The stock showed a relatively moderate downtrend, with daily small declines reflecting weakening momentum.
21–23 January: There was heightened volatility and large drop, with a short-term bounce attempt on 22 Jan, then a steep decline on 23 Jan.
By 23 Jan, price was trading near its 52-week low region (~₹758) versus the high near ₹1,177 in the past year, indicating significant relative weakness.
Have marked some important levels for Adani Green
647 - 531 seems good zone to accumulate on SIP mode...
Like and Share
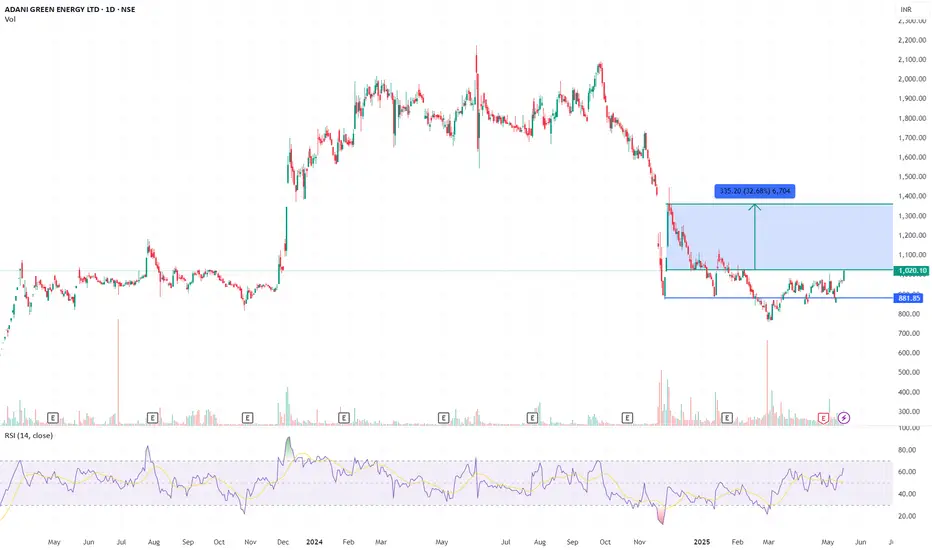
Adani Green – High-Risk Momentum Play with 30% Upside PotentialSummary
Adani Green has broken out above the critical ₹1,020 resistance level with convincing volume and positive price action. The structure suggests a short-term reversal from the prolonged downtrend. Historically, once breakouts are confirmed, the stock has shown rapid upward moves — for instance, a 48.7 percent surge in November 2024 following a similar setup.
The current breakout targets the ₹1,360 zone, which represents a 32 percent move from the breakout level and corresponds to a prior key supply zone.
Target and Time Frame
Target Price: ₹1,360
Estimated Time Frame: 4 to 8 weeks
(based on previous breakout velocity, momentum strength, and short squeeze potential)
Risks
Valuation remains extremely stretched with a P/E near 100. The market is pricing in multi-year forward growth
High leverage is a structural concern. Debt-to-equity is 6.6x, and a missed execution milestone or policy change—especially the end of the ISTS waiver in June 2025—could lead to volatility
RSI nearing overbought zone. Minor pullbacks or consolidations may occur before continuation
Disclaimer
This analysis is for informational purposes only and does not constitute investment advice or a recommendation to buy or sell any securities. Please do your own research and consult a qualified financial advisor before making investment decisions.
Adani Green Energy LimitedAdani Green Energy Limited
15% down today.
But the reversal started when it made a double top near 1177 levels
Recent top was at 2200
shaved off 1500 points from the recent high of 2200
well price always tends to fill the gap it has created..
Adani green is filling it up fast.
Marked levels for your perusal..
seems to be a good opportunity...
Like & Share
#ADANIGREEN 946.Stock has made a high at 3050 and #ADANIGREEN 946.Stock has made a high at 3050 and a low of . Looks to be correcting with a 5 wave Diagonal. In sub -4 of Diagonal now. If mkt behaves ,tgt 1650. Diagonal is making neat 61.8 to 81% retracement of subsequent sub waves. Hence our tgt 2650 of sub wave-4. Looks good. Keep in WL. Lets C
Adanigreen I'm not a SEBI REGISTERED ANYLISIS
just for learning purpose
above the blue line close in D chart candle i will buy and put strictly SL to below red line...once candle close below Red line in D chart...i will close the Trade...
Note: 1
Breakout candle should close time 6 or below 6 points I will buy same day or I will wait for the blue line price to re-trace)
Note:2
If previous volume is buyers(for ex- 10k) Breakout candle volume should be low in present day with buyers volume(below 10k for ex- 9k like this)
target check the chart
WAIT FOR ENTRY......then after
WAIT FOR TARGET...... or
WAIT FOR STOPLOSS
educational purpose only
oits simple ORB WITH VOLUME BREAKOUT STRATEGY...with small condition apply for selecting the stocks
owt not response for your profit and loss
ADANI GREEN ENERGY Ready to FIRE ( LONG TERM IDEA ) !!!Weekly counts for ADANI Green Energy are recommended, with a bullish wave structure.
Both appear to be optimistic, and this stock's invalidation number is 758.
Investing in declines is a smart move for long-term players.
Long-term investors prepare for strong returns over the next two to five years.
The energy sector has a promising future.
Every graphic / chart used to comprehend the theory of elliot waves, harmonic waves, gann theory, and time theory
Every chart is for educational purposes.
We have no accountability for profit or loss.
ADANI GREEN LONG TRADE SETUP📊 Price Action & Trend Analysis
Analyzing market trends using price action, key support/resistance levels, and candlestick patterns to identify high-probability trade setups.
Always follow the trend and manage risk wisely!
Price Action Analysis Interprets Market Movements Using Patterns And Trends On Price Charts.
👉👉👉Follow us for Live Market Views/Trades/Analysis/News Updates.
ADANIGREEN
Adani Green Energy Ltd. is showing signs of a potential breakout above ₹980, with short-term targets of ₹1000, ₹1050, and ₹1100. Investors may consider accumulating if the stock dips below ₹856, presenting a strategic entry point.
Fundamental Insights (Q4 FY25)
- Revenue from Power Supply: ₹2,666 crore, up 37% YoY.
- EBITDA from Power Supply: ₹2,453 crore, reflecting 35% growth YoY.
- EBITDA Margin: 91.3%, maintaining industry-leading efficiency.
- Net Profit: ₹230 crore, a 53% YoY increase.
- Total Income: ₹3,278 crore, up 15% YoY.
- Cash Profit: ₹1,231 crore, marking an 18% YoY rise.
- Operational Capacity: Expanded 30% YoY to 14.2 GW, reinforcing its leadership in India's renewable energy sector.
- Energy Sales: 27,969 million units, a 28% YoY increase, equivalent to half of Singapore’s annual power consumption.
- Greenfield Capacity Additions: 3.3 GW, the highest ever by any Indian renewable energy company.
- Solar Capacity Utilization Factor (CUF): 32.4%, showcasing strong operational efficiency.
- Debt Refinancing: Successfully refinanced USD 1.06 billion with long-term debt aligned to cash flow lifecycle.
Happy Investing :)
Stockerrr
BREAKOUT TRADING JOURNAL CASE-1ADANI GREEN ENERGY
IN A-B-C CORRECTION
BUY should be above point B breakout. (In this case we have got no clear breakout)
Point to be note is we have got good green volume days than red days.
Stock price should be above 30 Weeks M-A.
BUY ON CLEAR BRAKOUT BULLISH CANDLE.
S-L- BELOW, previous candle low.
RSI must be above 50.
Once breakout confirmed-
Focus on candle stick patterns for valid entry points on daily time frame. (whenever you get engulfing entry triggered.)
ADANI GREEN The stock can't be predicted clearly as there are abnormal moves due to various news.
However, it's likely forming an ascending triangle (not clearly).
look for bearishness if it closes below 870 on a weekly TF, and the target would be 600 again. Bullishness is only visible above 2300 or the breakout of the trendline.
For a successful breakout/breakdown, we should ideally see a strong respective timeframe candle on our chart to close —it’s crucial to use that timeframe.
Following the breakout/breakdown, the ideal entry point would be after a consecutive candle that breaks above/below the breakout/breakdown candle
As always, remember to do your own research before making any investment decisions!
ADANI GREEN SUPER SUPER UPSIDEThe intrinsic value of one ADANIGREEN stock under the base case scenario is 1 560.4 INR. Compared to the current market price of 1 034.15 INR, Adani Green Energy Ltd is undervalued by 34%.
Adani Green Energy Ltd holds several competitive advantages that differentiate it from its rivals in the renewable energy sector:
Scale and Capacity: As one of the largest renewable energy companies in India, Adani Green has a substantial capacity for solar and wind energy production. This scale allows it to benefit from economies of scale, reducing costs per unit of energy produced.
Integrated Operations: The company is part of the larger Adani Group, which has a diverse portfolio in energy, logistics, and infrastructure. This integration allows for synergies in project development, execution, and operational efficiency, providing an edge over standalone renewable energy operators.
Strong Financial Backing: Being part of the Adani Group provides strong financial support, enabling Adani Green to pursue large-scale projects and provide assurances to stakeholders and potential investors about the viability and continuity of its operations.
Access to Diverse Funding: Adani Green has demonstrated the ability to attract investment from both domestic and international sources, providing a solid foundation for expansion and new project development.
Strategic Partnerships and Alliances: The company forms strategic partnerships with technology providers and financial investors, which help in deploying cutting-edge technologies and securing long-term capital.
Robust Project Pipeline: It has a significant pipeline of projects that are in the development phase, which ensures future growth and the capability to continuously scale its operations.
Government Support and Policies: Operating in India, Adani Green benefits from favorable government policies aimed at increasing renewable energy’s share in the energy mix, aligning with national goals for sustainable development.
These advantages position Adani Green Energy Ltd to not only sustain its market position but also to potentially expand its influence in the renewable energy sector both domestically and internationally.
ADANI GREEN ENGERGY LTD S/RSupport and Resistance Levels:
Support Levels: These are price points (green line/shade) where a downward trend may be halted due to a concentration of buying interest. Imagine them as a safety net where buyers step in, preventing further decline.
Resistance Levels: Conversely, resistance levels (red line/shade) are where upward trends might stall due to increased selling interest. They act like a ceiling where sellers come in to push prices down.
Breakouts:
Bullish Breakout: When the price moves above resistance, it often indicates strong buying interest and the potential for a continued uptrend. Traders may view this as a signal to buy or hold.
Bearish Breakout: When the price falls below support, it can signal strong selling interest and the potential for a continued downtrend. Traders might see this as a cue to sell or avoid buying.
MA Ribbon (EMA 20, EMA 50, EMA 100, EMA 200) :
Above EMA: If the stock price is above the EMA, it suggests a potential uptrend or bullish momentum.
Below EMA: If the stock price is below the EMA, it indicates a potential downtrend or bearish momentum.
Trendline: A trendline is a straight line drawn on a chart to represent the general direction of a data point set.
Uptrend Line: Drawn by connecting the lows in an upward trend. Indicates that the price is moving higher over time. Acts as a support level, where prices tend to bounce upward.
Downtrend Line: Drawn by connecting the highs in a downward trend. Indicates that the price is moving lower over time. It acts as a resistance level, where prices tend to drop.
Disclaimer:
I am not a SEBI registered. The information provided here is for learning purposes only and should not be interpreted as financial advice. Consider the broader market context and consult with a qualified financial advisor before making investment decisions.