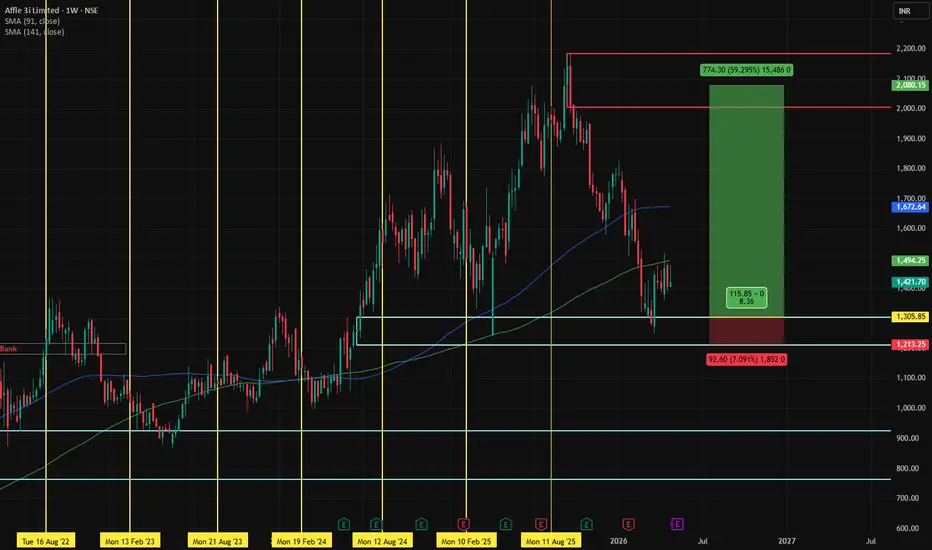
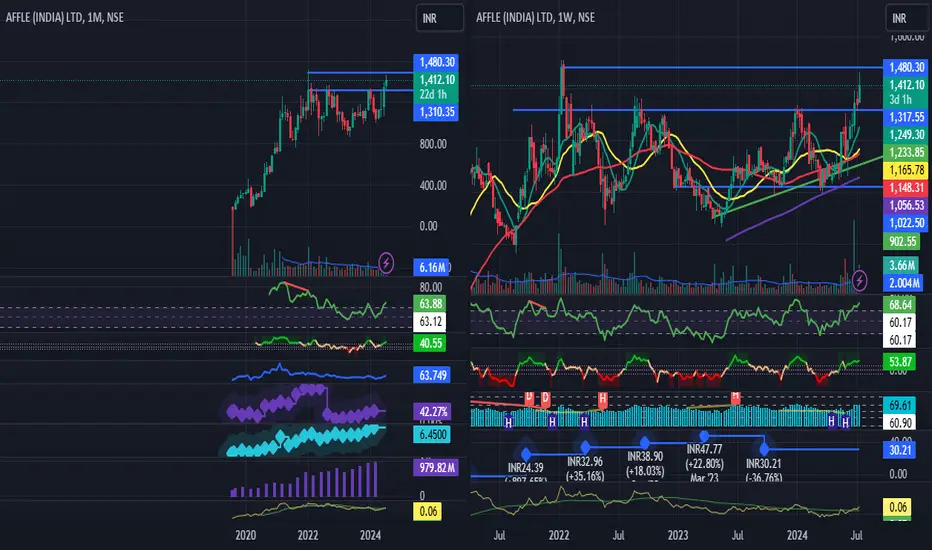
Longterm or Positional Opportunity in AffleGo Long @ 1460.1 for Targets of 1600.2, 1830 and 2020.5 with SL 1320
Reasons to go Long :
1. On Weekly timeframe there is a strong demand zone (marked with a purple color) from which the stock is taking support.
2. The stock formed a Bullish Engulfing Pattern (marked with a orange color).
3. Also there is a strong Trendline (marked with green color) which supports the stock.
Affle 3i Limited
No trades
No trades
In-depth trading ideas
AFFLE LONG✅ Setup
Trend: UP (all timeframes aligned)
Zone: 1390–1360 demand
🎯 Entry
Buy 50% at 1394
Buy 50% at 1370–1380 (if dip comes)
🛑 Stop Loss
1312 (hard SL)
Early exit if 1360 breaks with momentum
💰 Targets
T1: 1617 → book 30%
T2: 1800 → book 30%
T3: 2035 → hold 40%
📊 Position
Safer qty: 600–800 (instead of 1000)
⚡ Key Rule
After 1617 breakout → trail SL to cost
🧠 Verdict
✔ Trade is valid & high probability
✔ Focus on execution, not prediction
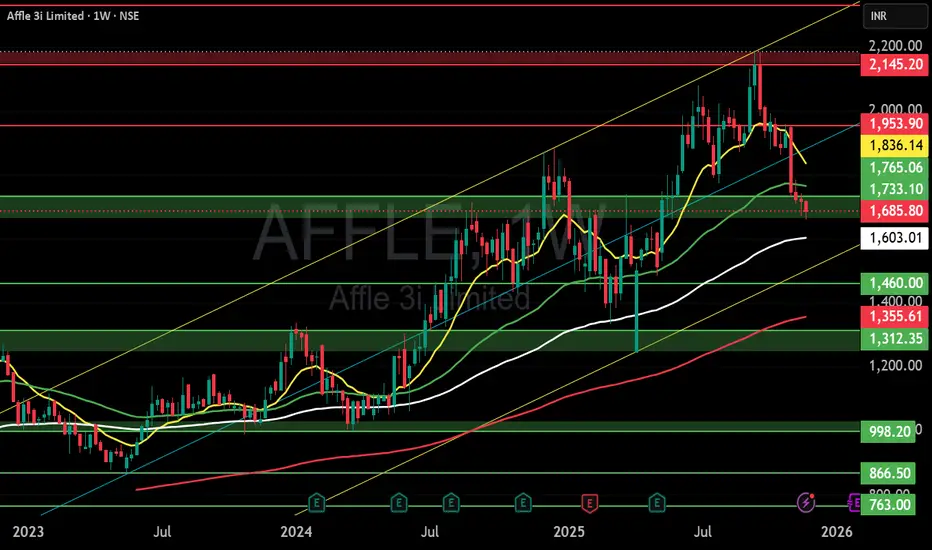
AFFLE 3I LTD S/Rsanthosh
Support and Resistance Levels:
Support Levels: These are price points (green line/shade) where a downward trend may be halted due to a concentration of buying interest. Imagine them as a safety net where buyers step in, preventing further decline.
Resistance Levels: Conversely, resistance levels (red line/shade) are where upward trends might stall due to increased selling interest. They act like a ceiling where sellers come in to push prices down.
Breakouts:
Bullish Breakout: When the p
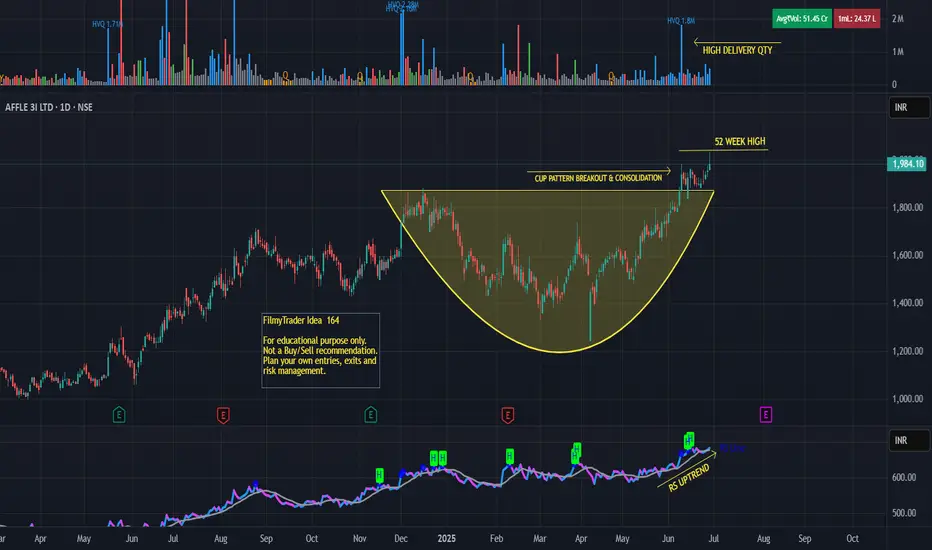
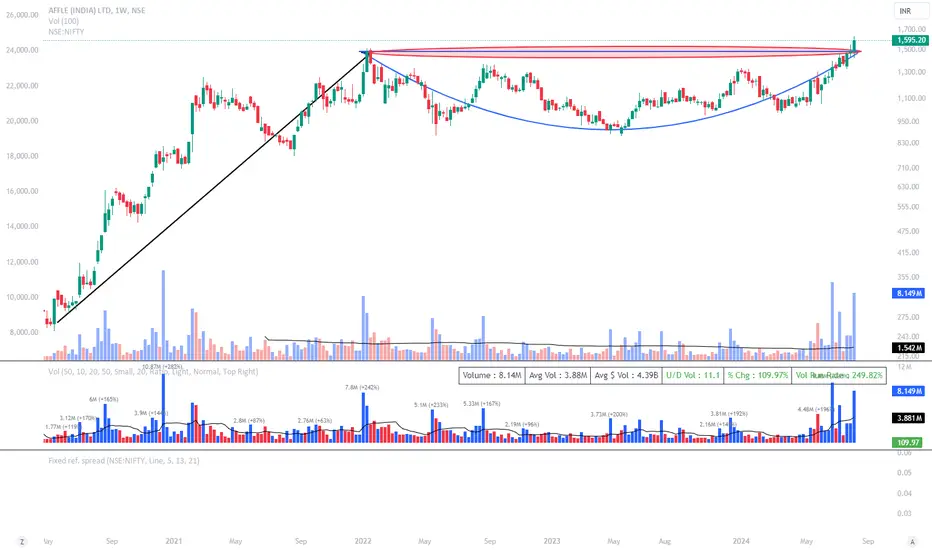
Affle - Cup Pattern BreakoutAffle 3i Ltd.
Cup pattern breakout and consolidating in daily time frame.
High delivery quantity this month.
Close within 52 week zone.
Stocks crossed its previous week high.
Stocks RSI crossed above 70.
Disclaimer:
For educational purpose only.
Please do your own research before taking any trades.
Happy Trading!
AFFLE | SWING | POSITIONAL | LONGOne of the few Nifty 500 stocks which is showing Bullish price action is AFFLE. The stock is consistently forming Higher Lows and is now perfectly poised to breach new levels.
Notice how the price is trading comfortably above the Monthly Pivot which indicates Bulls are in control.
I've taken a long position in the stock for a Target to 2100 price level.
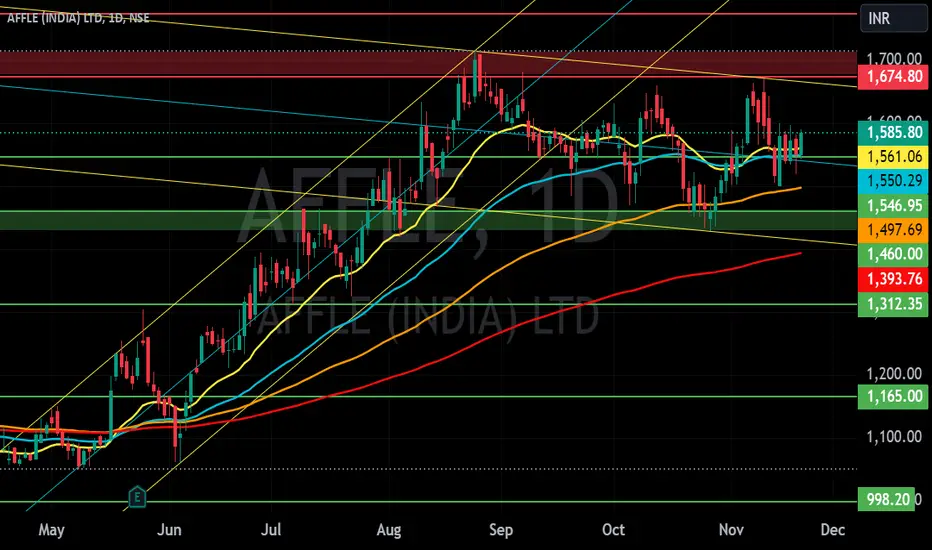
AFFLE (INDIA) LTD S/R Support and Resistance Levels:
Support Levels: These are price points (green line/shade) where a downward trend may be halted due to a concentration of buying interest. Imagine them as a safety net where buyers step in, preventing further decline.
Resistance Levels: Conversely, resistance levels (red line/shade) are where upward trends might stall due to increased selling interest. They act like a ceiling where sellers come in to push prices down.
Breakouts:
Bullish Breakout: When the price move
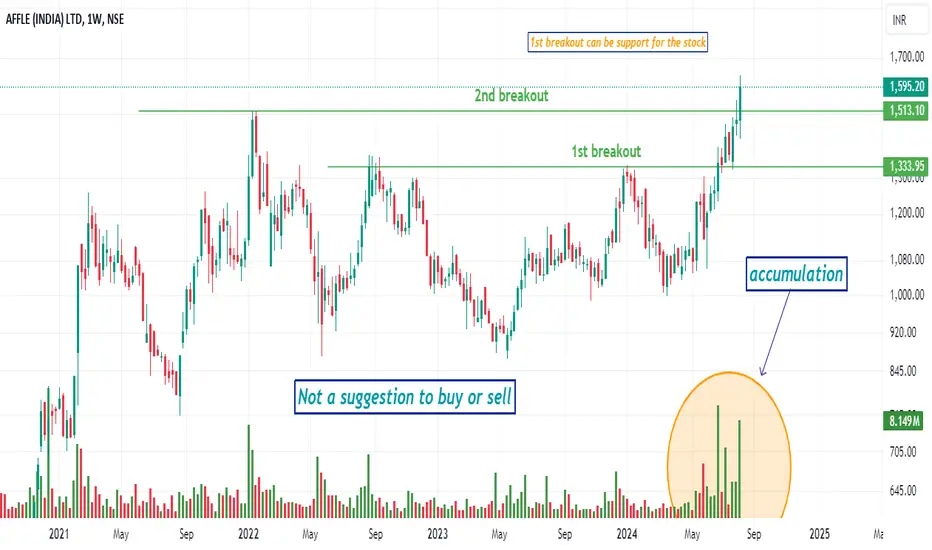
Long term continuation biasing patternGood volume buildup in daily and weekly timeframe.
Highest volume buildup in daily timeframe.
Long-term continuation biasing pattern breakout with good volume.
Fundamentals are good.
FII and DII stake increased significantly.
NOTE: I do my analysis, do yours before trade.
AFFLE1. Anything can happen.
2. You don't need to know what is going to happen next in order to make money.
3. There is a random distribution between wins and losses for any given set of variables that define an edge. No other thoughts
4. An edge is nothing more than an indication of a higher probability of one thing happening over another.
5. Every moment in the market is unique.
SWING IDEA - AFFLE (INDIA) LTDAffle India , a global technology company specializing in mobile advertising, is showing technical patterns that suggest a potential swing trading opportunity.
Reasons are listed below :
Ascending Triangle Pattern : The stock is forming an ascending triangle pattern, a bullish continuation pattern that indicates increasing demand and the potential for an upward breakout.
Repeated Resistance Testing (1250-1300) : The 1250-1300 resistance zone has been tested multiple times. The stock is now
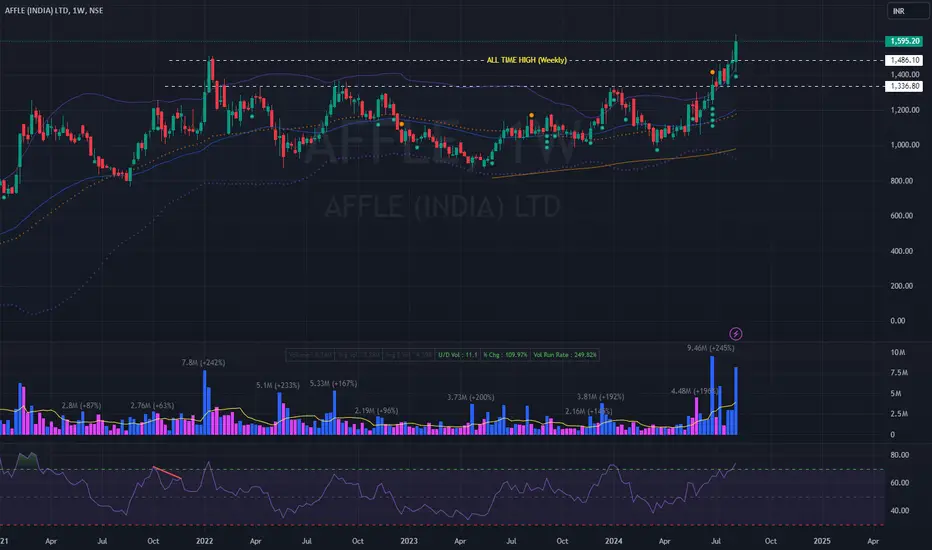
Break out from ressistance AffleBroke previous resistance with volume can go up to 1445, 1500 buy on dip with sl below 1200 on daily closing, duration of holding few weeks.
RSI now at 70, add more qty on dip.
Share Khan given target of 1535 on May 2024 , from entry of 1200 levels
Summary of Sharekhan Report
Affle’s (India) Q4FY24 revenue stood at Rs. 506.2 crore up, 1.5% q-o-q/42.3% y-o-y, beating our estimates of Rs.
499.8 crore, driven by steady growth in CPCU revenue.
EBITDA margin was flat at 19.4%, on q-o-q and y-
Affle India (Study Purpose)At support 200DMA, Volatility is lesser compare to other stocks.
Perfect reversal can happen from here.
Disclaimer : Above scenario just for educational purpose and study of graphical movements as per available technical parameters derived by professionals. Be careful before investing and consult your advisor before making such decisions. I am not responsible for any mishaps or losses or gains. Not a registered sebi member.
Personally I'm not invested yet.