In-depth trading ideas
BPCL: The Real Breakout Is Yet to Come!BPCL Breakout Alert
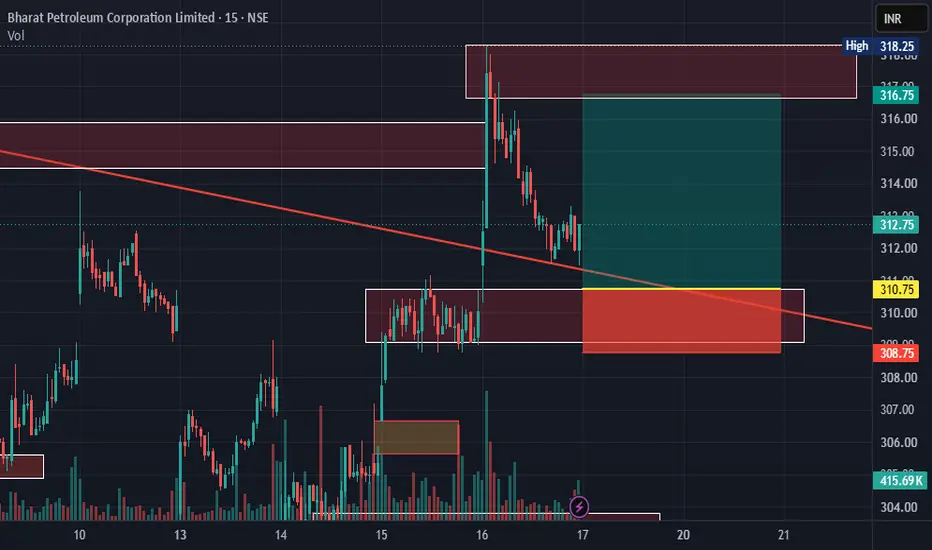
BPCL has given a pattern breakout above ₹320, but the major Law of Polarity resistance remains at ₹340.
Key Levels:
Pattern Breakout: ₹320
Major Breakout Confirmation: ₹340
A sustained breakout above ₹340 can unlock the next bullish momentum, with the pattern target placed near ₹387.
Strategy:
Hold existing positions.
Fresh buying is preferable only after a decisive breakout above ₹340.
Targets: ₹340 ➜ ₹365 ➜ ₹387
Educational purpose only. Trade with proper risk m
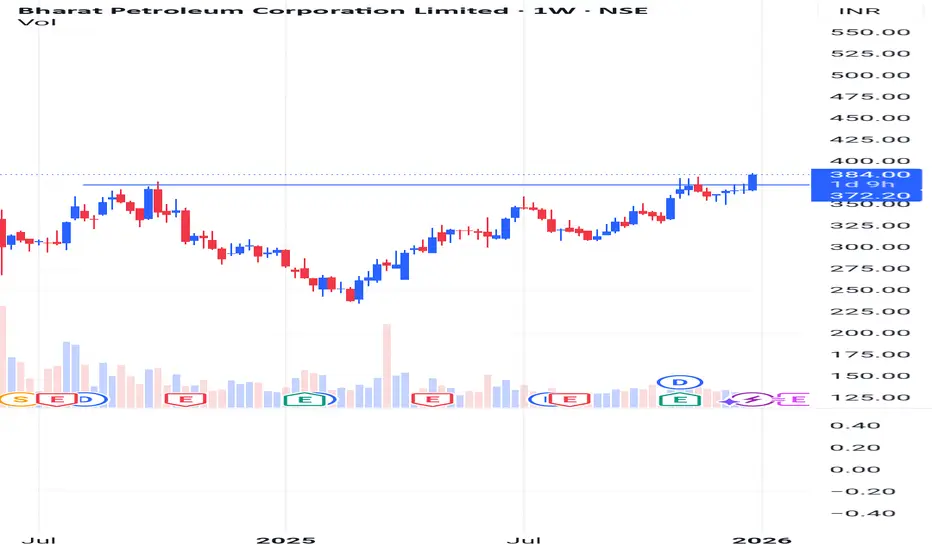
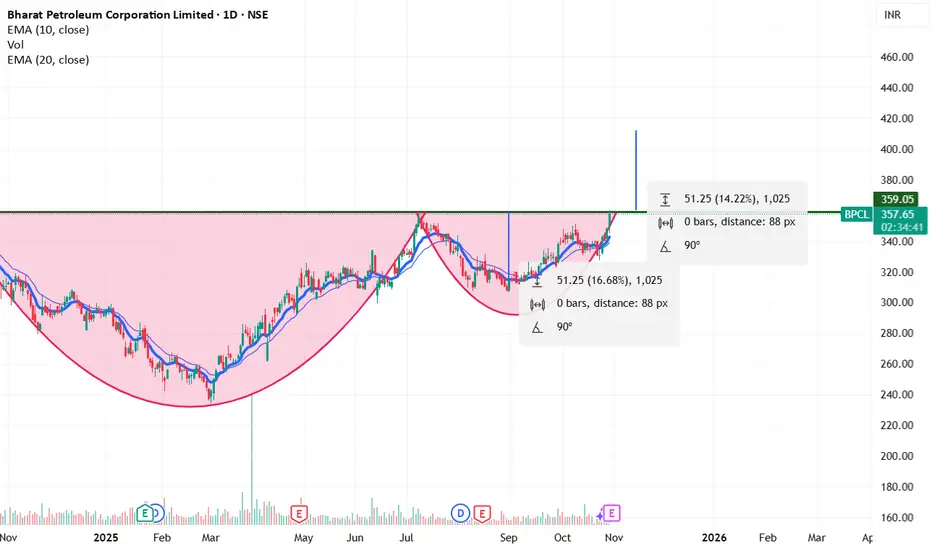
BPCL – Weekly Rounding Bottom BreakoutBharat Petroleum Corporation Limited
📲 BPCL – Weekly Rounding Bottom Breakout 🔄
📌 Trade / Positional Setup
• CMP: ₹384
• SL: ₹349
• Targets: ₹412 → ₹450 → ₹518
📍 Structure & Logic
• Weekly rounding bottom breakout in progress
• Pattern within pattern: a smaller rounding bottom formed after the larger base
• Indicates strength + continuation, not exhaustion
• Structure supports a longer-term move, not a quick trade
🧠 Approach:
This is a long-term setup — patience, discipline & controlled posi
Review and plan for 9th January 2026 Nifty future and banknifty future analysis and intraday plan.
Stocks analysed.
This video is for information/education purpose only. you are 100% responsible for any actions you take by reading/viewing this post.
please consult your financial advisor before taking any action.
----Vinaykumar hiremath, CMT
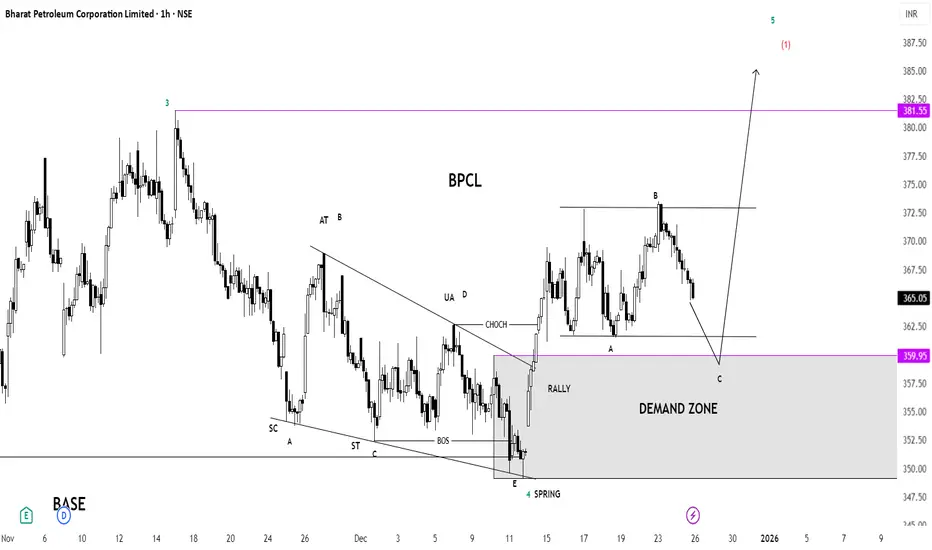
BPCL1. Big Picture (Market Context)
BPCL was earlier in a downtrend, making lower highs and lower lows.
The price formed a base after heavy selling — this usually signals selling exhaustion.
2. Wyckoff Accumulation Structure
Your chart clearly shows a Wyckoff Accumulation:
SC (Selling Climax): Strong selling pressure near the bottom.
ST (Secondary Test): Price retested the lows with less selling — bearish strength weakening.
Spring (Point E):
Price briefly broke below support.
This is a liq
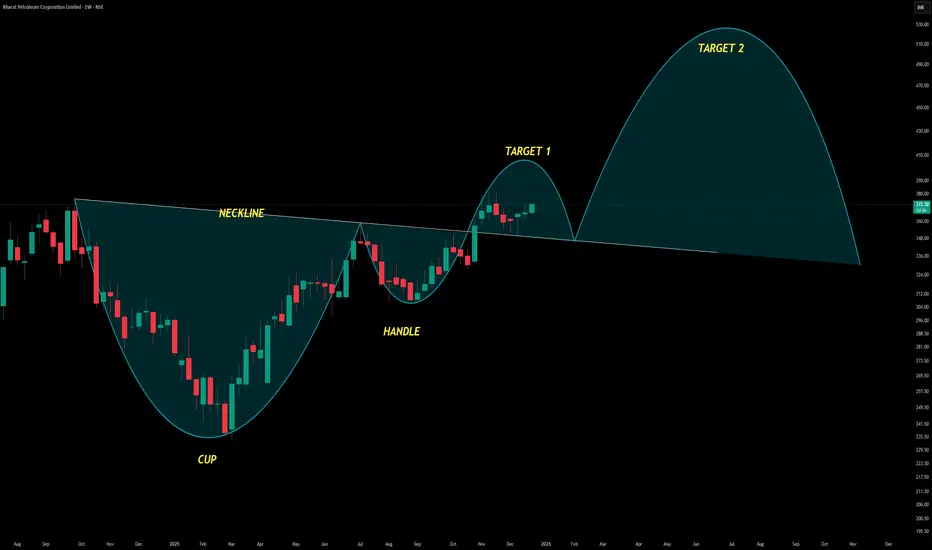
BPCL Weekly Chart — Classic Cup & Handle Breakout SetupThis study showcases a textbook Cup and Handle formation — a bullish continuation pattern that reflects long-term accumulation followed by a breakout-ready consolidation.
Pattern Anatomy:
Cup: A rounded base formed over several months, signaling gradual recovery and buyer buildup.
Handle: A shallow pullback in a downward-sloping channel, indicating controlled profit booking before breakout.
Neckline: Resistance zone connecting the highs before and after the cup, now acting as breakout trigger
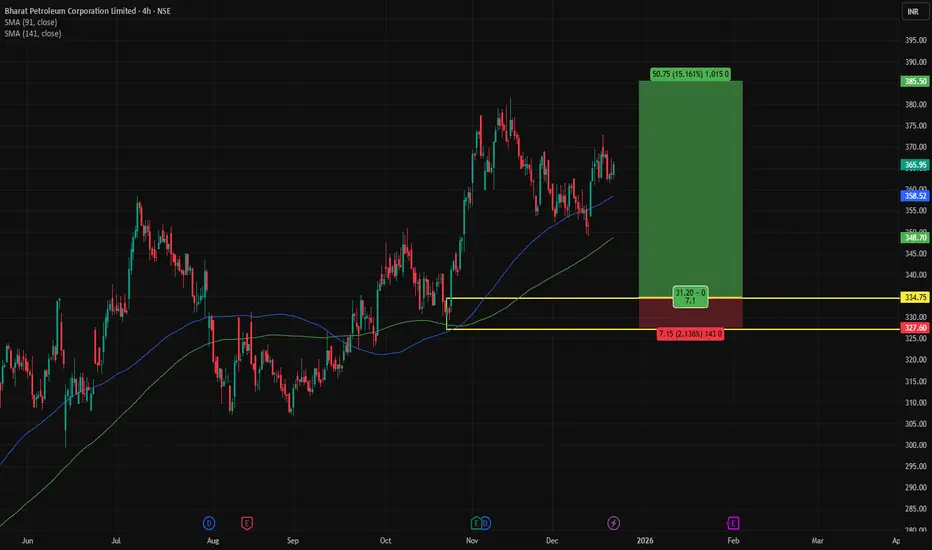
BPCLKey Levels That Matter
Primary Buy Zone: 333 – 331
Structural Demand / SL: 327
Last MTF High: 381
Supply Zone: 358
Measured Upside Potential: 433
Trade Plan (MTF – Positional)
Entry Strategy
Entry 1: 335
Entry 2: 331
Average Entry: 333
Risk Management
SL: 327
Defined Risk: 6 pts
🔥 Extremely tight risk vs structure
Targets
Target 1: 385 (70% booking)
Positional Target: 408 (30% booking)
Sustained move above 381 opens extension towards 430+
Risk–Reward
RR: 7.4
Net RR (post costs
BPCL | Volume Profile – Volume EdgePrice is trading below VAH with a LVN above, indicating weak participation.
Below current price lies a high-participation POC area, which may act as a fair-value reference.
HVN zones above and below remain key acceptance / rejection areas.
Bias depends on how price reacts around these volume levels.
📌 Educational insight based on auction behavior.
Disclaimer: For educational purposes only. Not a SEBI-registered advisor. Trading involves risk.
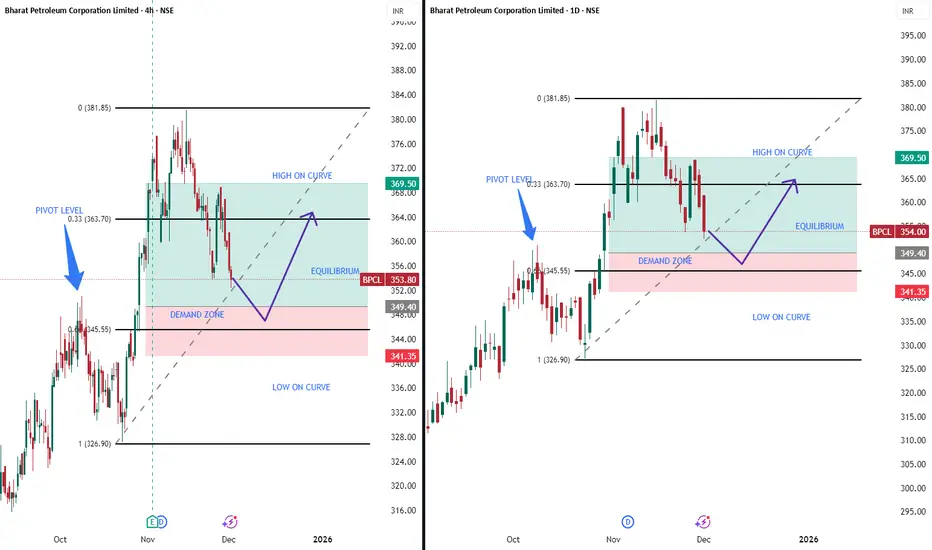
BPCL LONG TRADEIdea: Long trade BPCL for weekly income.
Logic: With BPCL in continuous uptrend, a demand zone formed on 349.4 levels is strong probability for bounce up, as it has broken prior pivot and is also near higher time frame demand zones.
The zone being formed on 50 EMA on weekly time frame adds another edge to the zone working in our favor.
Keeping R:R as 1: 2.5 a long trade with strict SL can be initiated.
Entry : 349.4
SL: 341.35
Target: 369.5.
#Safe trading
#Take proper position size and risk
Bharat Petroleum Corporation LTD Ltd for 3r Nov #BPCL Bharat Petroleum Corporation LTD Ltd for 3r Nov #BPCL
Resistance 360 Watching above 360 for upside momentum.
Support area 350 Below 345 gnoring upside momentum for intraday
Watching below 350 for downside movement...
Above 345 ignoring downside move for intraday
Charts for Educational purposes only.
Please follow strict stop loss and risk reward if you follow the level.
Thanks,
V Trade Point
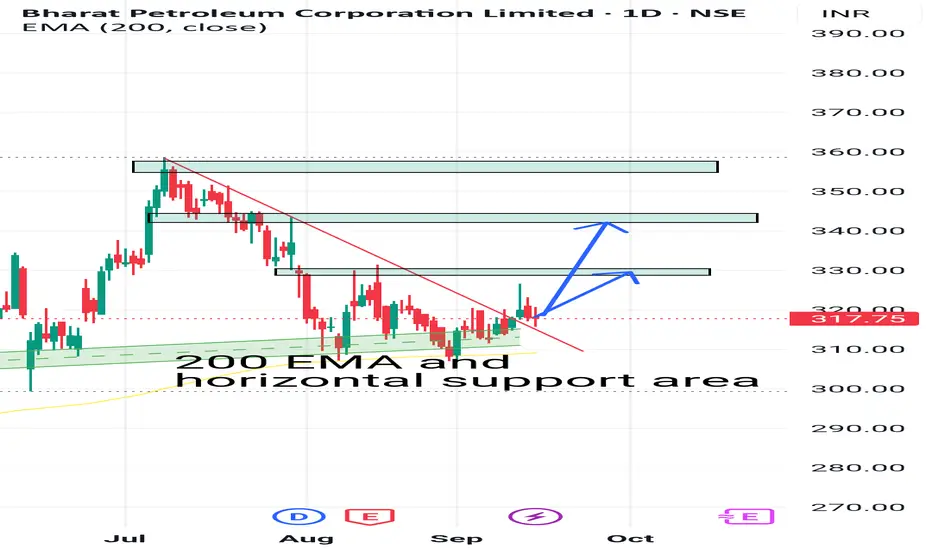
BPCLPrice at support area and near 200 EMA form this area possibility that it will move upper side.
This idea is for Educational purpose and paper trading only. Please consult your financial advisor before investing or making any position. Facts or Data given above may be slightly incorrect. We are not SEBI registered
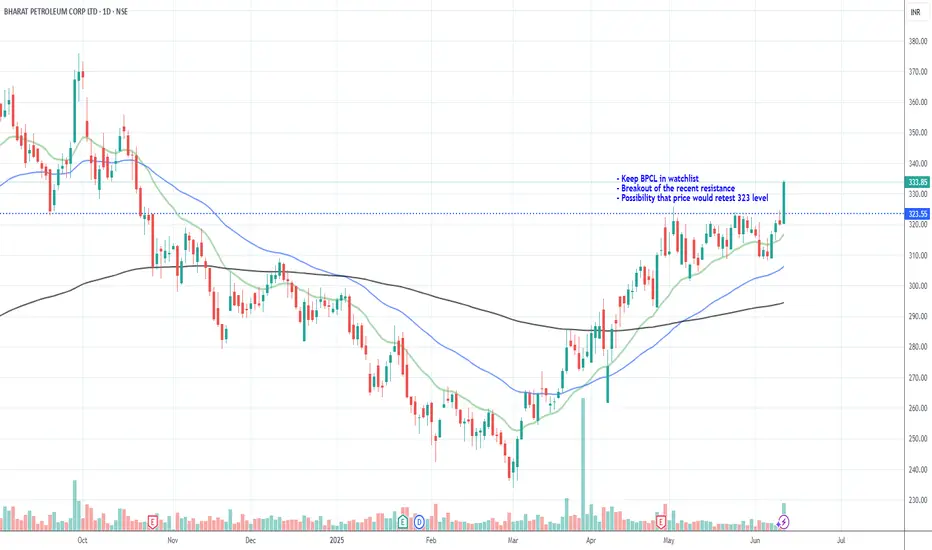
Review and plan for 12th June 2025Nifty future and banknifty future analysis and intraday plan.
Positional/short term stock ideas.
This video is for information/education purpose only. you are 100% responsible for any actions you take by reading/viewing this post.
please consult your financial advisor before taking any action.
----Vinaykumar hiremath, CMT