CG Power & Industrial Solutions Ltd
No trades
No trades
In-depth trading ideas
Keep An Eye - Gap Fill - CGPOWER📊 Script: CGPOWER
📊 Sector: Capital Goods
📊 Industry: Heavy Electrical Equipment
Key highlights: 💡⚡
📈 Keep an eye on stock it may fill gap, once the price is above 927.
BUY ONLY ABOVE 927
⏱️ C.M.P 📑💰- 918
🟢 Target 🎯🏆 - 950+
⚠️ Important: Always maintain your Risk & Reward Ratio.
✅Like and follow to never miss a new idea!✅
Disclaimer: I am not SEBI Registered Advisor. My posts are purely for training and educational purposes.
Eat🍜 Sleep😴 TradingView📈 Repeat 🔁
Happy learning with trading. Cheers!🥂
CG Power: Volatility Funnel Confirmed – The Path to 1100+The Setup:
CG Power has spent the better part of the last 18 months carving out a massive Hunt Volatility Funnel. We’ve tracked the tightening price action through a series of lower highs and higher lows, specifically watching the compression between the multi-month trendline and the structural support at ₹515.
The Trigger:
Price has finally cleared the "High 3 & Pattern Trigger" zone around ₹760–₹780. This move signals that the supply from the 2024/2025 highs has been absorbed. The recent retest and bounce off the former trendline resistance (now support) confirms that the bulls have regained control.
Key Technical Observations:
Failed Pattern Rejection: The "Low 3 & Pattern Fail" zone was aggressively defended, showing high buyer conviction at higher price levels.
Expansion Phase: We are now exiting the "Funnel" and entering a price expansion phase.
Targets:
With the pattern confirmed, I am looking for a measured move through the following technical milestones:
Target 1 (Immediate): ₹802 (Tested)
Target 2: ₹970
Target 3 (Structural): ₹1,052
LOG Target 3 (Extended): ₹1,176
Invalidation:
A daily close back below the ₹680 level (Low 3) would invalidate this immediate bullish thesis and suggest the funnel is broadening into a wider range.
Bottom Line: The accumulation phase is over. We are now playing for the compounding leg of this cycle.
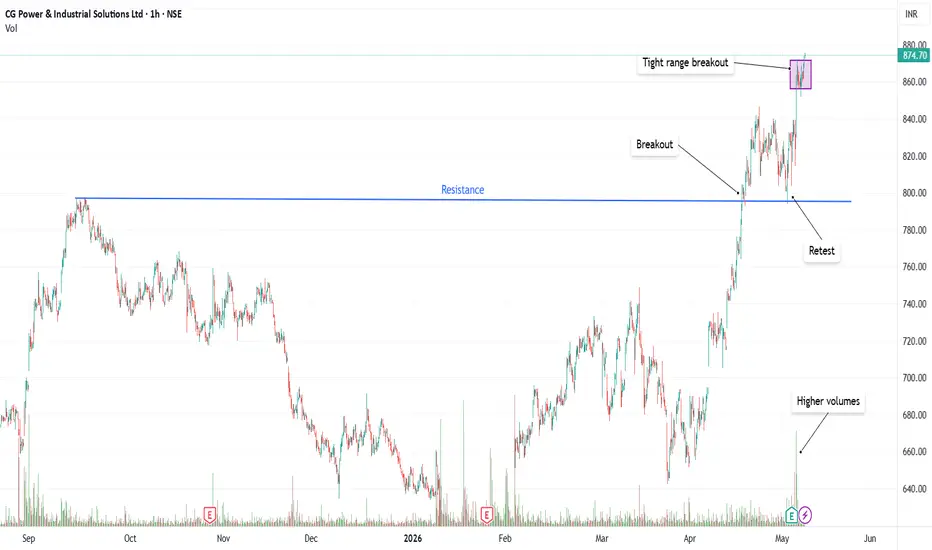
CG power breakoutBreakout: Price has moved decisively above the ₹800 resistance, confirming bullish strength.
Retest: The breakout level was retested successfully, showing strong buyer interest.
Volume Spike: Higher volumes supported the breakout, adding conviction.
Tight Range Breakout: After consolidation, price expanded upward, signaling momentum continuation.
Current Price: ₹874.70
🎯 Upside Targets:
Target 1: ₹900 – psychological round number & immediate extension
Target 2: ₹940 – next resistance zone from prior swing highs
Target 3: ₹1,000 – major psychological milestone & measured breakout projection
🛡️ Stop Loss:
Conservative: Below ₹840 (recent consolidation support)
Aggressive: Below ₹800 (original breakout level, invalidation point)
CG Power Unfolding Price ActionThe Semiconductor Story of India.
The stock price has seen a recent rally which puts the stock in a very nice position to consolidate prior a rally from ATH.
Can the stock proceed ahead with caution and create new history with ATH?
Or
Will it hit roadbloack (ATH resistance) and return?
Price action in the coming days will unfold the mystery and market will teach a new thing or two.
C G PowerFalling Channel (Bullish Pattern)
The stock is currently trading within a descending channel.
A breakout above the upper trendline of this channel could indicate a bullish reversal.
Support & Demand Zones
Discount Zone: Around ₹660–₹680 — strong demand zone, potential area for price reversal.
Order Block: Around ₹690 — aligns with historical consolidation and institutional buying.
FVG (Fair Value Gap): Between ₹690–₹710 — price may fill this gap before a major move.
Immediate Support: ₹720
Next Support: ₹670–₹680
Resistance & Supply Zones
Immediate Resistance: ₹760–₹780 (upper channel boundary).
Premium Zone: Around ₹820–₹840 — potential target zone after breakout.
Volume Analysis
Noticeable increase in volume during prior upswings suggests strong institutional participation.
Recent declines occurred on lower volume, indicating a healthy correction.
📈 Possible Scenarios
Bullish Scenario (High Probability)
If price respects the ₹720 support or the discount zone, and forms a bullish candle or breakout above the upper channel:
Upside Targets:
₹760 (first target)
₹800–₹820 (second target)
₹840 (final target)
Confirmation: Daily candle closing above ₹750–₹760 with volume.
Bearish Scenario (Low Probability)
If price breaks below ₹680, it may retest the ₹640–₹650 zone.
That would invalidate the bullish setup temporarily.
🧭 Trading Plan (for reference only)
TypeEntry ZoneStop-LossTarget 1Target 2Target 3Swing Buy₹700–₹720₹670₹760₹800₹840
⚠️ Conclusion
The stock is currently in a correction phase within a bullish structure. Price action suggests a potential reversal from the discount zone leading to a breakout above the falling channel. Confirmation through volume and breakout candle is key before entering long position
CGPOWER - Symmetrical Triangle ( BULL )Disclaimer:
I am not a SEBI-registered investment advisor. The information provided here is for educational and informational purposes only and should not be construed as financial or investment advice. Please do your own research or consult with a SEBI-registered financial advisor before making any investment decisions. Investments in the securities market are subject to market risks. Read all the related documents carefully before investing.
Current Price: ₹694.30
✅ RSI (Relative Strength Index)
RSI: 61.13 → Bullish Bias (Above 60 indicates buying strength, but not yet overbought)
✅ Support and Resistance
Supports:
S1: ₹681.10
S2: ₹685.50
S3: ₹693.05
Price is holding just above all support levels. ₹681–685 zone could act as a strong demand area if a pullback occurs.
Resistances:
R1: ₹695.50
R2: ₹698.10
R3: ₹698.40
The stock is very close to immediate resistance zone. A breakout above ₹698.40 could trigger further upside and price discovery.
✅ Fibonacci Levels
23.6%: ₹221.90
38.2%: ₹346.65
50.0%: ₹447.48
61.8%: ₹548.30
78.6%: ₹691.85
Current price (₹694.30) is above the 78.6% retracement, suggesting strong continuation of the uptrend and long-term bullish strength.
✅ Moving Averages
Short-Term Averages:
EMA5 = ₹678.33, SMA5 = ₹675.62 → Price above both → short-term momentum is bullish.
EMA9 = ₹675.96, SMA9 = ₹676.28 → Price well above → confirming buying interest.
Medium-Term Averages:
EMA20 = ₹673.61, SMA20 = ₹671.89 → Price above → trend remains intact.
EMA50 = ₹671.79, SMA50 = ₹673.58 → Price above → medium-term strength continues.
Long-Term Averages:
EMA100 = ₹667.51, SMA100 = ₹663.83 → Price above both → positive long-term structure.
EMA200 = ₹660.84, SMA200 = ₹664.66 → Well above → confirms a strong bullish long-term trend.
CG Power & Industrial Solutions Ltd. (NSE) (W)- Bullish strengthPrice Action
Stock was in a correction phase (orange downtrend line) after hitting highs around ₹875–₹895.
It has now broken out of the downtrend and is forming a cup & handle pattern (highlighted by the rounded bottom).
Price has been consolidating in the ₹644–₹694 zone for weeks and is now attempting a breakout.
Key Levels
Support Zones:
₹694.35 (immediate breakout zone).
₹644.10 (major support).
₹539.25 (long-term strong support).
Resistance / Upside Targets:
₹744.60 (first target after breakout).
₹794.85 (next key level).
₹845.10 (higher resistance).
₹875.70 → ₹895.35 (major swing high, long-term target).
Volume Analysis
Strong volume breakout visible on the latest candle → clear sign of accumulation and institutional buying.
The average volume (blue line) has been trending up, further validating strength.
Trend & Momentum
Short-term trend: Bullish (breaking out of consolidation).
Medium-term trend: Bullish, with a possible cup & handle breakout pattern.
Momentum: Strong → supported by volume surge and higher highs.
Possible Scenarios
Bullish Case
If price sustains above ₹694, it may rally towards ₹744 → ₹794 → ₹845 → ₹875–895.
Cup & Handle breakout suggests potential for all-time high retest.
Bearish Case
If breakout fails and price falls below ₹644, downside risk extends to ₹539.
Breakdown below ₹539 would negate the bullish setup.
Overall Bias:
Bullish breakout in progress . If sustained above ₹694 with volume, CG Power could target ₹744–₹795 in the short term and ₹875–895 in the medium term.
⚠️ Disclaimer : This chart is for educational purposes only.
Regulatory Note : We are an independent development team. Our services are not registered or licensed by any regulatory body in India, the U.S., the U.K., or any global financial authority. Please consult a licensed advisor before making trading decisions.
CGPower getting ready for big upside move.Two inside candles after big green candle. Pole & Flag pattern on weekly timeframe and getting ready to give break out with bullish engulfing. Day timeframe is also showing multiple positive reasons like golden crossover, channel breakout and spending time on higher levels. Also near 0.5 fib levels. If it crosses 695 then can see 740 level with 660 as SL.
CG Power and Industrial Solutions with Strong Bullish Flag SetupCG Power and Industrial Solutions just landed its largest-ever single order a 641 crore contract from Power Grid Corporation of India Ltd (PGCIL) for high-voltage transformers and reactors
The company, now under the Murugappa Group, reported consolidated FY25 revenues of 9,909 crore. However, annual profit dipped to 972.98 crore from 1,427.61 crore in FY24, despite a strong Q4 showing with a 17% YoY rise in net profit to 274.26 crore.
- Inverse Head & Shoulders Breakout: The stock recently broke out of an inverse H&S pattern, a classic bullish reversal signal, with strong volume confirmation. Holding above 690 could push it toward 750 TO 800.
Support & Resistance Levels
- Support: 663–679 demand zone
- Resistance: 694, 704 and 712
Trend Summary
- Short-Term: Neutral to bullish
- Medium-Term: Bullish bias if it sustains above 690
- Volatility: Elevated, so expect sharp swings
CG Power Technical Setup📉 CG Power Technical Setup (Daily Chart)
🗓️ Date: 7th June 2025
📊 Current Trend: Consolidation after a strong rally
⸻
🔍 Chart Analysis:
• Support Zone: ₹673 (Red line) – Strong demand area
• Resistance / Entry Trigger: ₹708.90 (Green line) – Previous swing high
• Intermediate Level: ₹681.60 (Blue dotted line) – Possible intraday support/resistance
🔁 Expected Move:
• Price may retest the support zone near ₹673
• A bounce from support could signal strength 📈
• Entry only above ₹708.90 for fresh momentum buying
• Watch for volume confirmation on breakout
🧠 Strategy:
Wait for breakout above ₹709 with good volume.
Avoid premature entry in the consolidation zone.
📌 Disclaimer: Not a buy/sell recommendation. For educational purposes only.
CG Power Technical Setup📉 CG Power Technical Setup (Daily Chart)
🗓️ Date: 7th June 2025
📊 Current Trend: Consolidation after a strong rally
⸻
🔍 Chart Analysis:
• Support Zone: ₹673 (Red line) – Strong demand area
• Resistance / Entry Trigger: ₹708.90 (Green line) – Previous swing high
• Intermediate Level: ₹681.60 (Blue dotted line) – Possible intraday support/resistance
🔁 Expected Move:
• Price may retest the support zone near ₹673
• A bounce from support could signal strength 📈
• Entry only above ₹708.90 for fresh momentum buying
• Watch for volume confirmation on breakout
🧠 Strategy:
Wait for breakout above ₹709 with good volume.
Avoid premature entry in the consolidation zone.
📌 Disclaimer: Not a buy/sell recommendation. For educational purposes only.
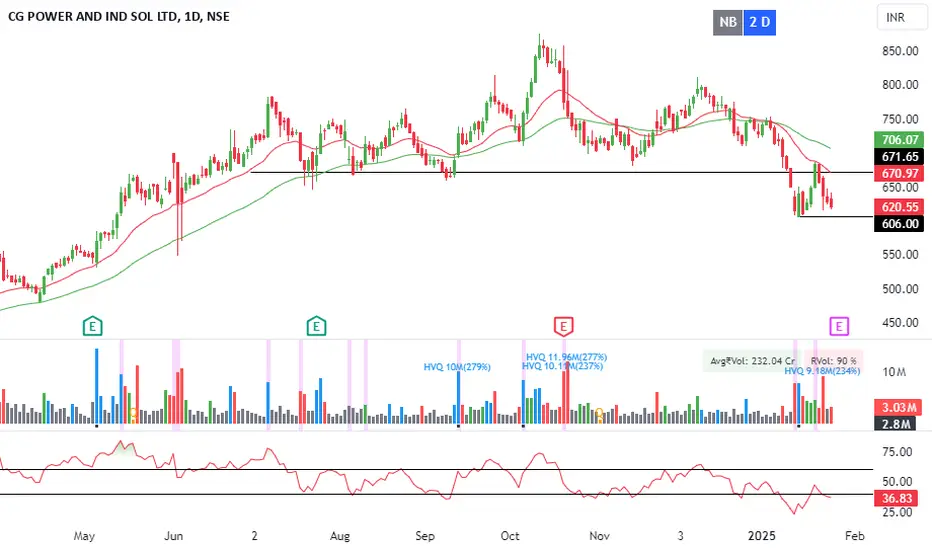
Bullish on CG POWERCG POWER had been correcting since Oct-2024. After a massive decline, the stock has now found good support.
The stock formed a low on 28th Jan 2025 and tried to reverse.
Further on, it again corrected sharply when the Trump tarriff came into force.
However, it could not breach its earlier low and now it has started to move upwards.
I have built long position on the stock for a target to 750 price.
P.S. Not a recommendation. Pls do your own due diligence.
Bullish on CGPOWERCGPOWER has some interesting price action.
The stock has declined more than 40% from its highs in Oct-24.
Now, the stock is showing excellent Bullish tendency.
Notice that it forms a low in Jan-25 and then continously forms Higher lows in Feb & March 2025.
In April due to the Trump tarriff panic, the stock gaps down put again shoots back up. This signals that buyers are lapping up the good prices.
As per my analysis, a target of 750 is likely in the near term.
Today, let's dive into an analysis of CGPower stock-CGPower is a large-cap stock with a market capitalization of ₹98,023 crore. The stock currently trades at a Price-to-Earnings (P/E) ratio of 104, which is significantly higher than the industry average of 64. Based on these fundamentals, CGPower seems to have entered an overbought zone, suggesting that the stock may be trading at a premium compared to its earnings potential.
Now, let's turn to the technical side of things.
The all-time high for CGPower was around ₹875, after which the stock underwent some profit booking. Since then, it has experienced a correction of approximately 40%. In the short term, there could be some upside, but a more cautious view is warranted over the long term.
The stock currently has strong support levels in the range of ₹530-₹500. Given its overvaluation, there’s a higher likelihood of the stock continuing to face downward pressure in the near future, rather than sustaining upward momentum.
In conclusion, while there may be short-term movements, the long-term outlook suggests that CGPower might struggle to maintain its current valuation, with more risk of a decline than a sustained recovery
Review and plan for 9th December 2024 Nifty future and banknifty future analysis and intraday plan.
Stock for short term.
This video is for information/education purpose only. you are 100% responsible for any actions you take by reading/viewing this post.
please consult your financial advisor before taking any action.
----Vinaykumar hiremath, CMT
POV: CGPOWER - Channel + Cup and Handle Breakout**POV: CGPOWER - Channel + Cup and Handle Breakout**
**Chart Reading:**
1. Today, it started with a 0.6% gap-up, tested, and traded below the previous day's close, then rose and closed above the channel's upper range.
2. There have been five previous breakout attempts. One attempt almost succeeded, but a market downturn pulled it back into the channel.
3. The Cup and Handle pattern formed within the channel. The cup took exactly 25 sessions to form, aligning with my minimum criterion of 20 sessions.
4. The 200 SMA shows a steadily growing path. In my observation, it’s rare to see such a clean rising angle.
5. The channel has been in existence for more than 100 sessions.
6. The average candle range is relatively narrow.
7. Trend and momentum are in sync.
*For educational purposes only. This is not financial advice. Please consult a professional before making financial decisions.*
**#NiVYAMi**