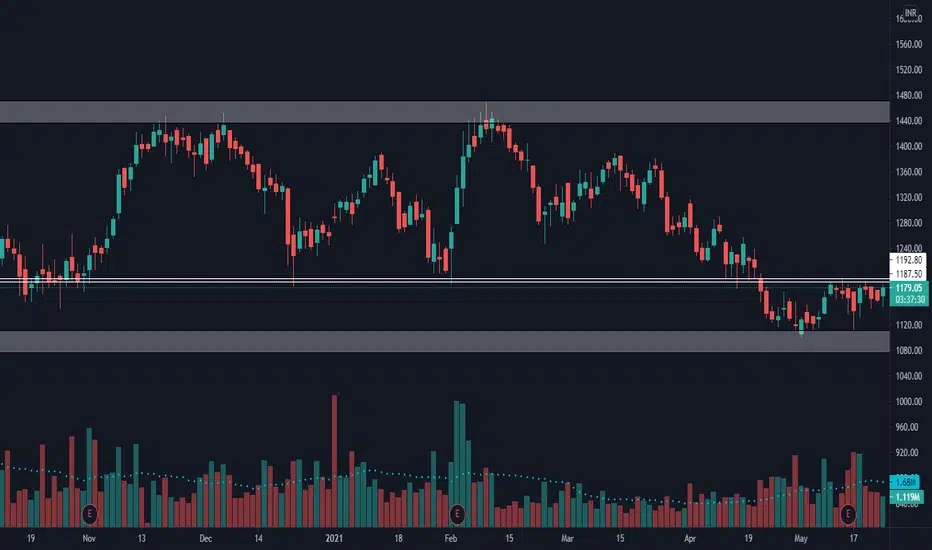
Escorts SwingHi all Escorts looking good for short term investment. one can go long on daily candle close above 1192 or safe players above 1200. Longby Chetan_Kumar_AnjanUpdated 1
ESCORTS KUBOTAEscorts Kubota Ltd. (currently trading at ₹3569) is a leading manufacturer of agricultural tractors, construction equipment, and railway components. Following its strategic partnership with Kubota Corporation, Japan, the company has expanded its global footprint, product portfolio, and manufacturing capabilities. With a strong legacy in farm mechanization and a growing presence in high-horsepower and premium tractor segments, Escorts Kubota Ltd. – FY22–FY25 Snapshot Sales – ₹7,238 Cr → ₹8,520 Cr → ₹9,410 Cr → ₹10,320 Cr Growth driven by tractor exports, premiumization, and infra-linked demand Net Profit – ₹873 Cr → ₹1,020 Cr → ₹1,145 Cr → ₹1,280 Cr Margin expansion through product mix and operating leverage Operating Performance – Moderate → Strong → Strong → Strong Efficiency gains from Kubota integration and automation Dividend Yield (%) – 0.75% → 0.85% → 0.90% → 1.00% Steady payouts aligned with earnings growth Equity Capital – ₹136.00 Cr (constant) No dilution; Kubota holds majority stake Total Debt – ₹0 Cr (debt-free) Fully equity-financed operations Fixed Assets – ₹2,450 Cr → ₹2,620 Cr → ₹2,780 Cr → ₹2,940 Cr Capex focused on new tractor platforms and rail component expansion Institutional Interest & Ownership Trends Promoter holding stands at 72.44%, led by Kubota Corporation. FIIs and DIIs maintain strong exposure due to Escorts’ leadership in agri-mechanization and infra-linked verticals. Delivery volumes reflect long-term accumulation by industrial and rural consumption-focused funds. Business Growth Verdict Escorts Kubota is scaling efficiently across agri, infra, and rail segments Margins remain strong due to premiumization and cost control Debt-free structure enhances financial flexibility Capex supports long-term product innovation and export readiness Management Con Call Management confirmed the launch of a new tractor manufacturing facility on the Yamuna Expressway with ₹4,500 Cr investment, expected to generate 4,000 jobs. Focus remains on high-horsepower tractors, electric variants, and global distribution via Kubota’s network. Railway division continues to expand with new orders for brake systems and couplers. FY26 outlook includes mid-teen revenue growth and margin retention, supported by automation, export traction, and rural infrastructure demand. Final Investment Verdict Escorts Kubota Ltd. offers a high-quality industrial and agri-tech story backed by global parentage, strong execution, and diversified product lines. Its debt-free status, expanding manufacturing footprint, and strategic alignment with Kubota make it suitable for accumulation by investors seeking exposure to India’s rural growth, infrastructure, and mobility transformation.Longby TechnicalAnalystSucrit0
ESCORTS - LONGNSE:ESCORTS Weekly chart to quarterly charts all are longer timeframe chart showing classic accumulation in the stock. Looks like base are form near 4 years moving average now time to resume upside trend for medium to long bull run.Longby Chartstory_Jigar1
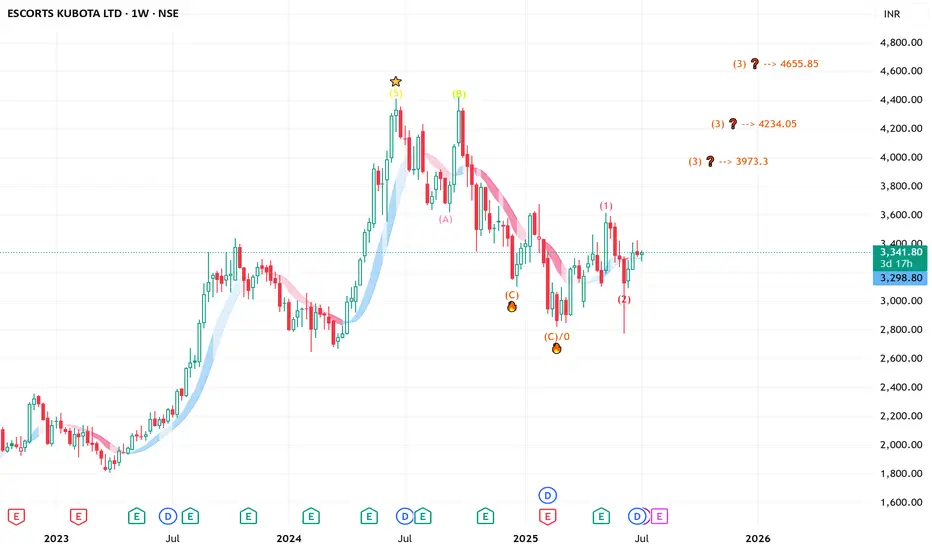
ESCORTS looking strong on weekly count ESCORTS KUBOTA-----WEEKLY counts indicate Excellent bullish wave structure. Both appear to be optimistic and this stock invalidation number wave 2 low target short / long term are already shared as per charts correction wave leg seems completed Investing in declines is a smart move for short/ long-term players. Buy in DIPS recommended Long-term investors prepare for strong returns over the next two to five years. one of best counter Every graphic used to comprehend & LEARN & understand the theory of Elliot waves, Harmonic waves, Gann Theory, and Time theory Every chart is for educational purposes. We have no accountability for your profit or loss. Longby wavesmonk0
Escorts Buy SetupHead and shoulder pattern in formation. looking good for a buyLongby prem_sharma_030
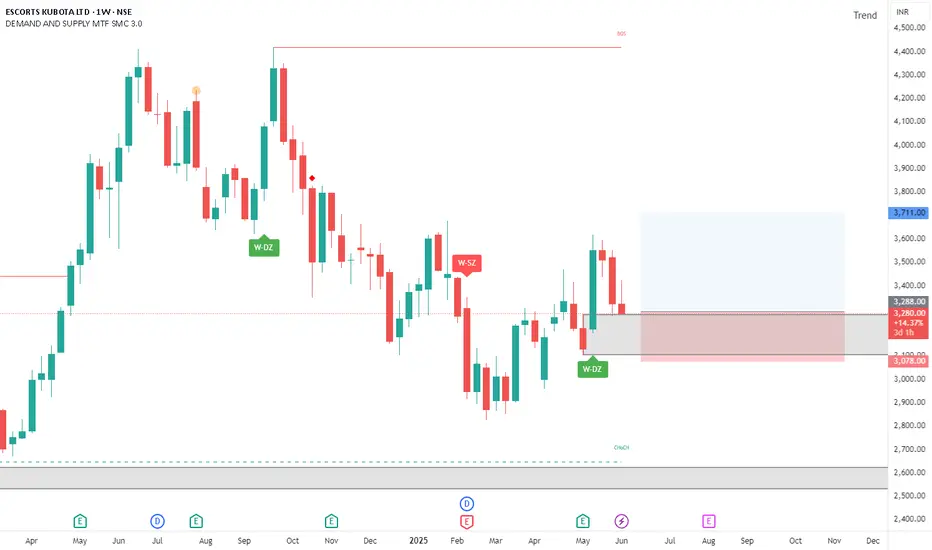
ESCORTS : Weekly Demand zone Long tradekey highlights : ESCORTS : Weekly Demand zone Long trade area market structure : Bullish Analysis Time frame : Weekly proximal line - 3273 distal line - 3102 short entry - 3288 Stop loss- 3078 Target - 3711Longby aquasonic19873
Ready for 3660 & 3850 levels??Immediate resistance will be 3660 and then upon breakout looks like 3850 in next trading sessions based on the support and trend! Note: Its only for educational purpose. Not a SEBI registered adviser.Shortby mahesh_oni0
Review and plan for 9th May 2025 Nifty future and banknifty future analysis and intraday plan. Quarterly results. This video is for information/education purpose only. you are 100% responsible for any actions you take by reading/viewing this post. please consult your financial advisor before taking any action. ----Vinaykumar hiremath, CMT 10:28by vinaysh2
ESCORTS NSE:ESCORTS Parameter Value Trend Reversing to bullish Entry Zone ₹3,250–3,300 (or above ₹3,400) Targets ₹3,500 → ₹3,680 → ₹3,850+ Stop-Loss ₹3,150 (strict) ADX Signal Bullish (+DI > -DI) Volume Confirming accumulation Ideal Entry: Between ₹3,250–₹3,300 (on dips near support zones, preferably above 3,215 for safety). Confirmation Buy: Breakout above ₹3,400–3,420 with strong volume (price has tested this region recently).Longby parimalkr20000
ESCORTSESCORTS watch above levels. redline is our SL. DISCLAIMER : I am NOT a SEBI registered advisor or a financial adviser. All the views are for educational purpose only.Longby Royalprince20200
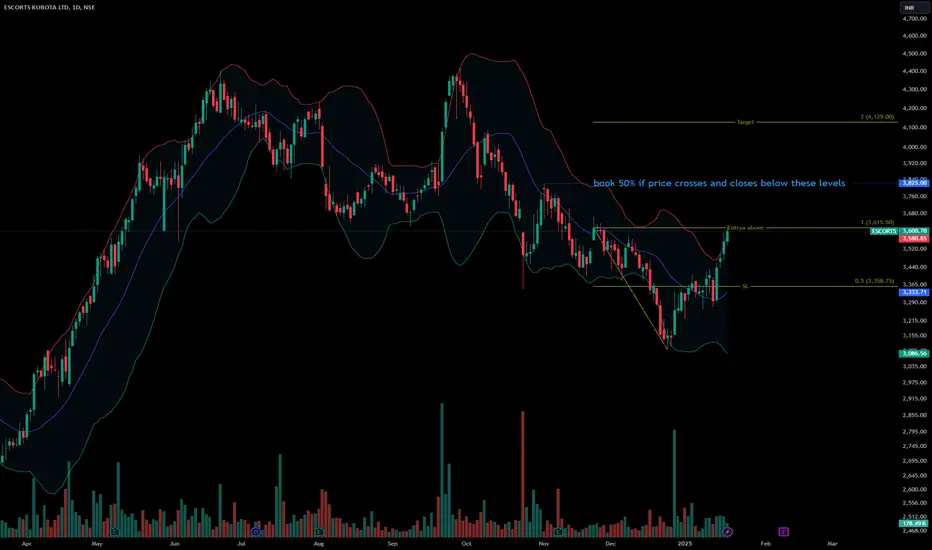
stock for swing escorts kubota ltd buying entry above-3580 stop loss-3030 target-3800-3880-4000++++ Escorts Ltd. is one of India’s leading engineering conglomerates engaged in the manufacturing of Agri-machinery, Construction & Material Handling Equipment and Railway Equipment.Longby pushkar25361
ESCORTS long tradeStock is closing above previous week/ month high, showing outperformance with respect to index and sector Buy above 3640. SL - 3350 Target - 4200Longby TrendUrFriend1
Escorts Limited - At long term significant support zoneEscorts has been forming series of Higher Highs and Highs lows indicates strong uptrend. The higher low has since last 4-5 years has bottomed out the 20 Monthly EMA. The stock has consistently found support at the moving average and bottomed out near the same. Currently stock is placed near the same juncture, going ahead if support holds well like in the past, stock could end its corrective phase and resume its prior uptrend.Longby rohanshah446
ESCORTS: Stablizing at support?It has formed tripple bottom around same level. Considering volumes it seems we can consider it as stopping volume. Too early to trade but there are signs. So better enter with 50% quantity. SL is very short here. Longby vkfinserv0
ESCORTS : Turning Corrections into Opportunities ESCORTS KUBOTA Learning Points: Extended Retracement Zones: Corrections beyond standard Fibonacci levels (113%–127%) often precede strong reversals. Multiple Entry Levels: Tiered buying zones reduce volatility risk and improve average entry. Wave Analysis: Wave C zones offer attractive entry points for medium- to long-term trades. Trading Plan: Entry Strategy: First Entry: ₹3409–₹3520 (extended retracement zone). Second Entry: ₹3290–₹3330 (Wave C demand zone). Stop-Loss Placement: ₹3268.60, below the second demand zone. Target Strategy: First Target Zone: ₹3821–₹3875, aligning with swing highs. Second Target Zone: ₹4190, a major supply zone. Predictions: Support is expected near the first buy zone, with potential recovery toward ₹4190. Disclaimer: I am not a SEBI-registered analyst. This analysis is for educational purposes only. Conduct your research or consult a financial advisor before trading. General Risk Management Rules: Always maintain a 1:2 or 1:3 risk-reward ratio . Avoid over-leveraging during high volatility. For options, use spreads or hedging strategies to limit losses. This detailed plan aims to provide clarity and actionable steps for traders across different timeframes. Trade responsibly!Longby LiveTradingBox4
ESCORTS KUBOTA LTD S/R Support and Resistance Levels: Support Levels: These are price points (green line/shade) where a downward trend may be halted due to a concentration of buying interest. Imagine them as a safety net where buyers step in, preventing further decline. Resistance Levels: Conversely, resistance levels (red line/shade) are where upward trends might stall due to increased selling interest. They act like a ceiling where sellers come in to push prices down. Breakouts: Bullish Breakout: When the price moves above resistance, it often indicates strong buying interest and the potential for a continued uptrend. Traders may view this as a signal to buy or hold. Bearish Breakout: When the price falls below support, it can signal strong selling interest and the potential for a continued downtrend. Traders might see this as a cue to sell or avoid buying. 20 EMA (Exponential Moving Average): Above 20 EMA(50 EMA): If the stock price is above the 20 EMA, it suggests a potential uptrend or bullish momentum. Below 20 EMA: If the stock price is below the 20 EMA, it indicates a potential downtrend or bearish momentum. Trendline: A trendline is a straight line drawn on a chart to represent the general direction of a data point set. Uptrend Line: Drawn by connecting the lows in an upward trend. Indicates that the price is moving higher over time. Acts as a support level, where prices tend to bounce upward. Downtrend Line: Drawn by connecting the highs in a downward trend. Indicates that the price is moving lower over time. It acts as a resistance level, where prices tend to drop. RSI: RSI readings greater than the 70 level are overbought territory, and RSI readings lower than the 30 level are considered oversold territory. Combining RSI with Support and Resistance: Support Level: This is a price level where a stock tends to find buying interest, preventing it from falling further. If RSI is showing an oversold condition (below 30) and the price is near or at a strong support level, it could be a good buy signal. Resistance Level: This is a price level where a stock tends to find selling interest, preventing it from rising further. If RSI is showing an overbought condition (above 70) and the price is near or at a strong resistance level, it could be a signal to sell or short the asset. Disclaimer: I am not a SEBI registered. The information provided here is for learning purposes only and should not be interpreted as financial advice. Consider the broader market context and consult with a qualified financial advisor before making investment decisions.by zenthosh0
escorts buy swing /positional now at 3855 buy near 3790-3800 wait for buy triggerd avg at near 3730 sl at near 3640 4%sl tgt 4%8%12%16%20%24% hold 3-6 weeks by optionkey331
Nifty Auto- EscortsNifty Auto Index have given breakout on daily timeframe, Mostly auto stocks have given breakout on the charts, I published idea on banknifty when everyone was bearish on banks, look at banknifty now from when I posted, have closed above ATH weekly. everyone is running behind it. Same is going to happen in auto index as well. Will post strong breakouts in Auto sector. Escorts being on top with strong breakout with closing. Keep in radar. 10% is the first target after that ATH breakout is possible.Longby Stockiist3
ESCORTS TRIANGLE BREAKOUTESCORTS TRIANGLE BREAKOUT Proper flag BO with huge huge volume... More strong above 4108 Keep on radar.... Longby saahilchopraa1
ESCORTS TRIANGLE BREAKOUTESCORTS TRIANGLE BREAKOUT Proper flag BO with huge huge volume... More strong above 4108 Keep on radar.... Longby saahilchopraa1
Escorts - following simple price action Good fundamentals and a leading player in its segment.Longby himanshuchugh8113
VIEW3848.05 is the level. Short Eicher Motors for the target of 3812 and then second target of 3784. You can Short sept futures only when 30 min candle in spot closes below 3848.05 level. Option sellers can sell ATM options and use 50% of the premiums as SL , use this number. If option premium reaches above your 50% of selling price. then book SL in futures too, this is how you put your SL based on premiums of options.by vivekz_142Updated 0
perfect set up stock has a perfect set up of uptrend then correction and now ready to continue upwards journey. enter at CMP for a short target of 4400 and long target of 5000.Longby tabrez19841
 Long
Long