GRASIM S/R
Support and Resistance Levels:
Support Levels: These are price points (green line/shade) where a downward trend may be halted due to a concentration of buying interest. Imagine them as a safety net where buyers step in, preventing further decline.
Resistance Levels: Conversely, resistance levels (red line/shade) are where upward trends might stall due to increased selling interest. They act like a ceiling where sellers come in to push prices down.
Breakouts:
Bullish Breakout: When the price mov
In-depth trading ideas
Grasim Industries: Momentum Surge & BreakoutRecent News & Corporate Announcements
Q1 FY27 Earnings Date: Grasim Industries is scheduled to announce its Q1 FY27 financial results and hold its analyst call on August 12, 2026.
Dividend Record Date: August 7, 2026 marks the record date for the recommended final dividend of ₹10 per share (500% on ₹2 face value) for FY26.
Business Expansion: Market sentiment remains supported by rapid capacity utilization in the Birla Opus paints segment and expansion in cellulosic specialty fibers, offsettin
GRASIM (D) CHARTTechnical Note: Let the market come to your zones and show its hand. Trade safe and manage your risk! Always wait for your own confirmations before entering the market.
Risk Disclaimer: This analysis is for educational purposes only and does not constitute financial advice. Always practice proper risk and position sizing. Stop Loss Must if you want to be a profitable Trader.
Grasim IndustriesSupport Zones
₹3,180–3,200 – Immediate support
₹3,140–3,160 – Strong buying zone
₹3,080–3,100 – Major positional support
Resistance Zones
₹3,225–3,245 – Immediate resistance
₹3,280–3,320 – Breakout zone
₹3,400–3,500 – Positional target if momentum continues
Trading View
Bullish above ₹3,245 → Targets: ₹3,320 → ₹3,400 → ₹3,500
Range-bound between ₹3,180–₹3,245.
Below ₹3,180 → Weakness may extend towards ₹3,140 and ₹3,100.
Indicators
Overall trend: Bullish
Moving Averages: Strong Buy
RSI: Aroun
**My View on GRASIM — Daily Chart****1. Key Observation**
GRASIM looks weak near the upper resistance zone. Price is struggling around **₹3,126–₹3,197**, and the structure suggests that a short-term downtrend may be starting.
**2. My View**
My view is bearish as long as GRASIM stays below **₹3,197**. The stock may enter a correction phase and move lower in the coming weeks.
**3. Invalidation**
This bearish study becomes invalid if GRASIM breaks **₹3,197** and gives a daily close above it.
**4. Risk-Reward**
Risk is limited abo
Grasim Industries Limited
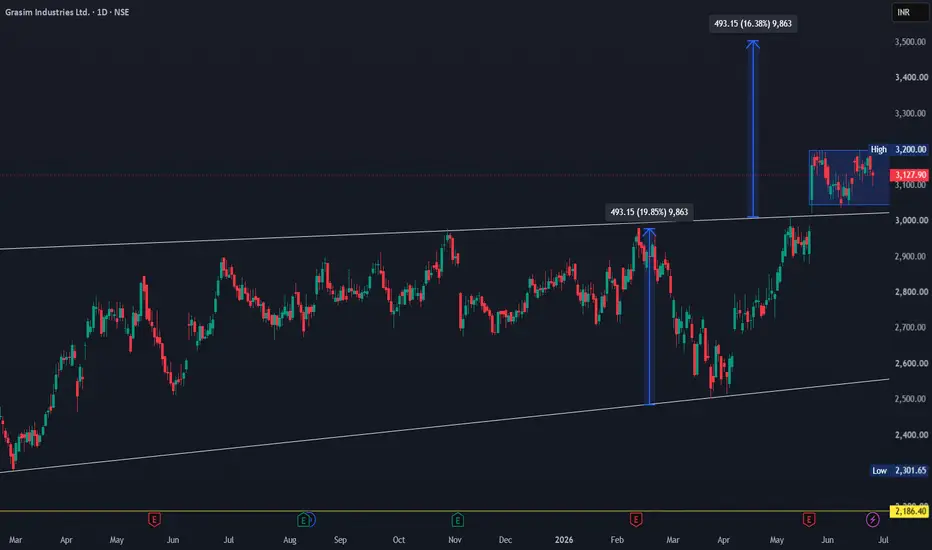
Price broke out of a 2 year base and is forming a new base above the 2Y base.
A break of this base can lead a good rally as this base indicates a accumulation of strong hands at play since big moves are made by buyers and in between slight profit booking.
Short, Medium and Long Term moving averages are well aligned.
No signs of sellers stepping in.
Fundamentally
Stock has given a consistent growth in EPS and Sales.
Increase in Promoters Holding and FIIs holding.
GRASIM available at BUY ZONE ..............Grasim is looking bullish for the next few months , trail your stoploss after subsequent HH ( higher highs ) , PLEASE RESPECT THE STOPLOSS , no matter how much you are convinced with fundamentals .
ALL THE BEST ....................
Few points to note :::::
1. RETRACEMENT WITH LESS VOLUME COMPARED TO BREAKOUT CANDLE'S VOLUME .
2. ATT TIME HIGH CANDLE CLOSED NEAR ITS HIGH ( SHOWS INVESTORS INTEREST ) .
Amazing BREAKOUT on WEEKLY Timeframe - GRASIMCheckout an amazing breakout happened in the stock in Weekly timeframe, macroscopically seen in Daily timeframe. Having a great favor that the stock might be bullish expecting a staggering returns of minimum 25% TGT. IMPORTANT BREAKOUT LEVELS ARE ALWAYS RESPECTED!
NOTE for learners: Place the breakout levels as per the chart shared and track it yourself to get amazed!!
#No complicated chart patterns
#No big big indicators
#No Excel sheet or number magics
TRADE IDEA: WAIT FOR THE STOCK TO BREA
Grasim Industries Ltd *Grasim Industries*
P&F on 3MonthlyTF with BO.
Darwas Box Rage BO.
Strong Volume Consolidation.
EMAs: Widening Gap amongst 20/50/100/200 levels on Monthly Basis.
RSI: H=D>W>M. All in Bullish Zone.
*Trail SL with Upside,*
*Book Profit as per Risk Appetite*
*This is an Opinion. Do your own Research as well*
*_,Happy Investing_*🤓
Review and plan for 21st May 2026Nifty future and banknifty future analysis and intraday plan.
Quarterly results- analysed.
This video is for information/education purpose only. you are 100% responsible for any actions you take by reading/viewing this post.
please consult your financial advisor before taking any action.
----Vinaykumar hiremath, CMT
NSE – NIFTY 750 | GRASIM INDUSTRIES | 08 Mar 2026Grasim Industries shows a long-term impulsive structure with periodic deep corrections that reset momentum without damaging the broader trend.
The 2008 and 2020 declines acted as structural resets, while the post-pandemic rally produced a strong expansion phase.
Price is now compressing near highs, which typically reflects trend maturity or consolidation rather than immediate structural weakness.
The key structural observation remains that the primary trend is still intact unless major higher
GRASIM – Base Pressure Building for Breakout Above ₹2,850Price has spent almost a year trapped between ₹2,480 and ₹2,850. Each dip since mid-2025 has formed higher lows, compressing against the same horizontal ceiling. Today’s candle closes right at ₹2,850 with RSI rising toward 60 — the structure is tightening for resolution.
A decisive close above ₹2,900 with strong volume will confirm breakout and open the path toward ₹3,200–₹3,250 (~12–13% measured move).
Setup: Ascending Triangle re-attempt
Entry Trigger: ₹2,900+ close with volume confirmat
GRASIM – Price Compressing Toward Major Trendline SupportPrice is getting squeezed between a falling trendline and a rising support. This type of compression usually ends with a strong move. A clean descending trendline from the recent swing-high shows short-term selling pressure. A major rising trendline from the bottom still holds the structure.
Price is drifting towards the intersection zone of both trendlines. If price taps the rising trendline and holds, a bounce + trendline breakout is possible.
Save this setup — this zone decides the
Grasim Industries Ltd for 28th Oct #GRASIM Grasim Industries Ltd for 28th Oct #GRASIM
Resistance 2940-2950 Watching above 2952 for upside momentum.
Support area 2900 Below 2920 gnoring upside momentum for intraday
Watching below 2897 for downside movement...
Above 2930 ignoring downside move for intraday
Charts for Educational purposes only.
Please follow strict stop loss and risk reward if you follow the level.
Thanks,
V Trade Point
Positional setup and fundamental summary for Grasim Industries.Fundamentals
Market cap: ~ ₹1.9-2.0 lakh Crore.
P/E Ratio: ~ ~45× (recent data).
PB Ratio: ~1.9-2.0×.
ROCE / ROE: Historically modest – ROCE ~5-6% in some published ratios.
Recent performance: It posted ~9% YoY growth in Q4 FY25 PAT (~₹1,496 crore) and declared a dividend.
The Economic Times
Strategic move: The company’s new paints business (“Birla Opus”) has become the second-largest player in India by capacity in its segment.
The Economic Times
Valuation note: Some sources suggest
GRASIM - Weekly Breakout?Chart Analysis :
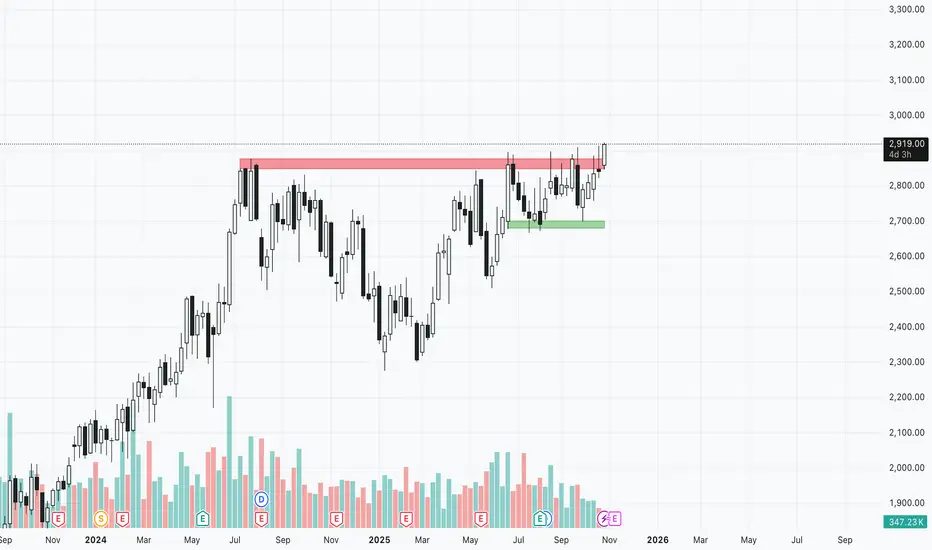
Price sustaining and breaking out above its major resistance of 2895-2910 zone. Price made a long consolidation of 67 weeks/ 15months and now breaking out.
Daily close above 2910-2920 will confirm breakout and can be considered for long.
Key Levels:
Entry level : Above 2920
Targets : 3000 psychologically imp level can move more if breaks out above 3000 (Trailing with day low SL post breakout is the suggested strategy)
StopLoss : Day close below 2820
Disclaimer:
I am not SE
Grasim - Bullish SetupGood bullish setup shaping up in Grasim. A new consolidation above 2875-2900, will help further with upmove. Trading close to ATH, above MA's, decent RSI, volumes are consistent. I will consider it more as a positional candidate. A well known name from Birla Group. Had a decent Q1 and with India govt focus on Infra expansion, it should benefit.
Disclaimer - Shared for education and study purpose. Please do self analysis or consult your advisor before taking any position.