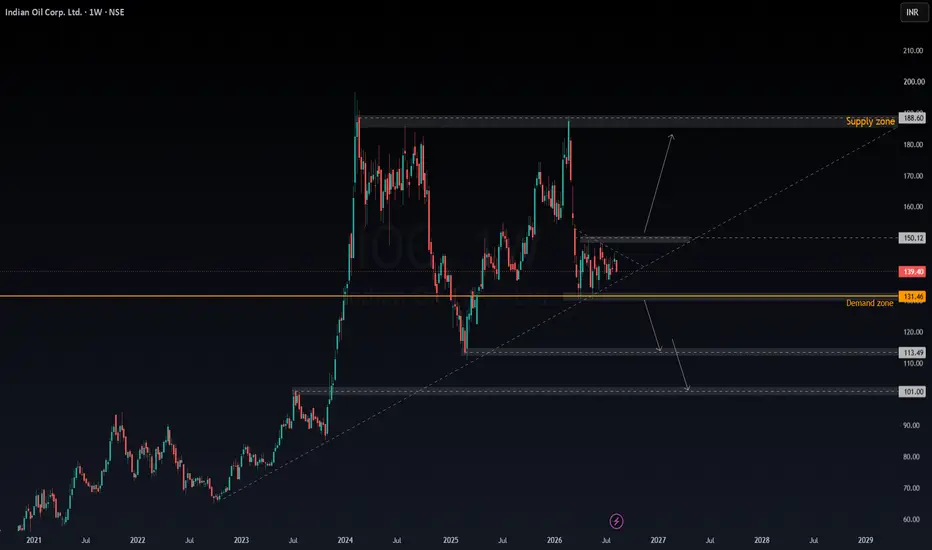
IOC Weekly Chart Analysis | Key Levels to WatchIndian Oil Corporation is currently trading in a consolidation phase on the weekly timeframe, with price moving between a major demand zone near ₹131–132 and an immediate resistance area around ₹145–150.
The bigger picture still looks constructive as long as the long-term rising structure remains intact. However, at the current level, I would prefer to wait for confirmation rather than anticipate the next move.
Bullish scenario:
A strong weekly close above ₹145–150, followed by a successful re
In-depth trading ideas
NSE – IOC | 21 Mar 2026Introduction
Price is holding within a rising structure while exhibiting range-bound compression near the upper boundary.
Structure Overview
The broader structure remains intact within a rising channel.
Current behaviour reflects compression following prior expansion, with no structural breakdown observed.
Key Levels
Major Resistance
200
Resistance Zone
165 – 180
Pivot Zone
140 – 148
Support Zone
125 – 110
Structure Weakens Below
100
Structural Triggers
Acceptance above the resista
Indian Oil Corporation (IOCL): 15-minIOCL Short Term Breakout Setup | Risk-Reward 1:3
Indian Oil Corporation (IOCL) is showing strong momentum on the 15-minute timeframe.
Price is forming higher highs and higher lows, supported by rising volume.
🔹 Current Structure: Short-term bullish
🔹 Resistance Zone: 188–194
🔹 Immediate Support: 181–182
Entry:
Buy above 184 on strong 15-min close with volume
Stop Loss:
181 (strict SL)
Targets:
T1 – 188
T2 – 192–194
Risk-Reward looks attractive if breakout sustains. Momentum and volume exp
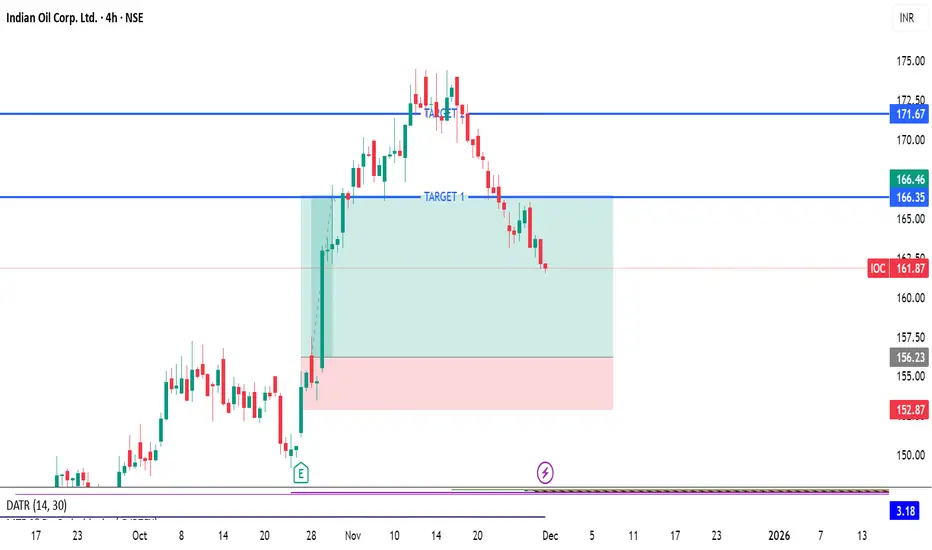
IOC LONG TRADEIOC Long trade setup for Weekly Income.
Logic: IOC was in continuous uptrend, with a some dip coming in a demand zone sits right on the prior pivot. The zone is strong on the 4 hrly.
Entry: 156.23
SL: 152.87
Target: 166.19.
Maintain strict stoploss.
## If the trade is taken in futures, consider taking Jan futures, to avoid tender period and roll overs, as the trade may take time to hit target.
#Maintain proper position size and risk. # Safer trades.
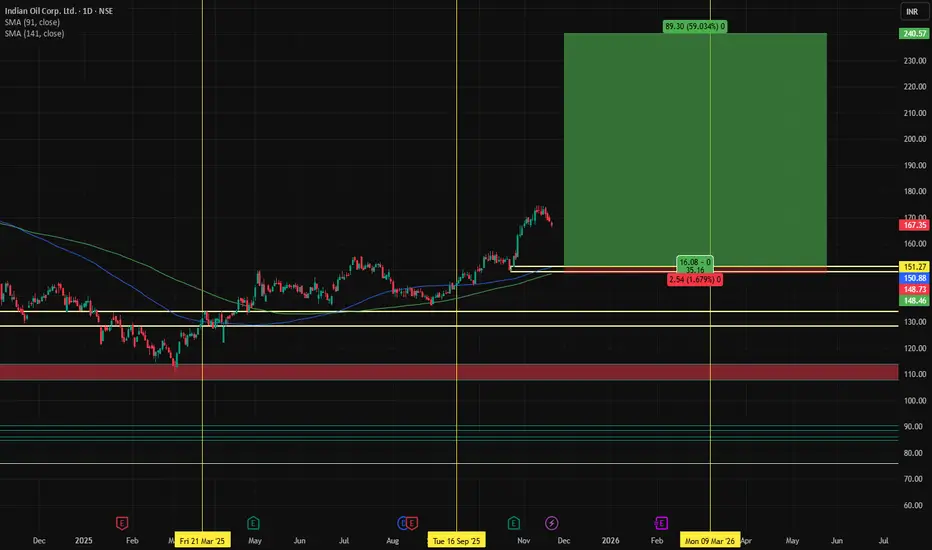
INDIAN OILTechnical Summary
🔵 Overall Trend Across HTF–MTF–ITF: STRONG UP
🔵 Very strong cluster of demand zones at: 149–152
🔵 MTF weekly support extremely strong at: 149
🔵 Upside projection clean up to: 218 → 240
🔵 Gann Uptrend level: 145 (stays positive above this)
🔵 Downtrend break only below 143
Trade Plan Summary (IOCL)
Entries
Entry-1: 156
Entry-2: 152
Average Entry: 154
Stop-Loss: 149
Risk: 7 points
Targets
First Target: 218
Positional Target: 240
Last High MTF: 197
Upside Potential vs A
Indian Oil: Tight Range Breakout | Short-Term Swing TradeBUY Setup 🛢️
Entry: ₹166.25-166.50 (Current Level)
Target 1: ₹170.05-170.50
Target 2: ₹173.59-174.00
Target 3: ₹176-178 (Extended)
Stop Loss: ₹163.85
Technical Rationale:
Consolidating near resistance at 166.99 level on 1-hour chart
Strong uptrend from 161 to 167 in recent sessions
Trading in tight range (166-167) - coiling for breakout
Volume at 4.95M showing decent participation
RSI around 65-70 zone indicating strength
Price holding above key support at 163.85
PSU oil marketing company with
Buy IOC short term target 155, 165 & Medium Term tgt 185, 250 Indian Oil Corporation does business in the entire hydrocarbon value chain - from Refining, Pipeline transportation and marketing of Petroleum products to R&D, Exploration & production, marketing of natural gas and petrochemicals. It has the leadership position in the Oil refining & petroleum marketing sector of India.
The company aims to strengthen EV mobility infrastructure by setting up charging points and battery-swapping facilities at its fuel stations. It has also signed a binding term sh
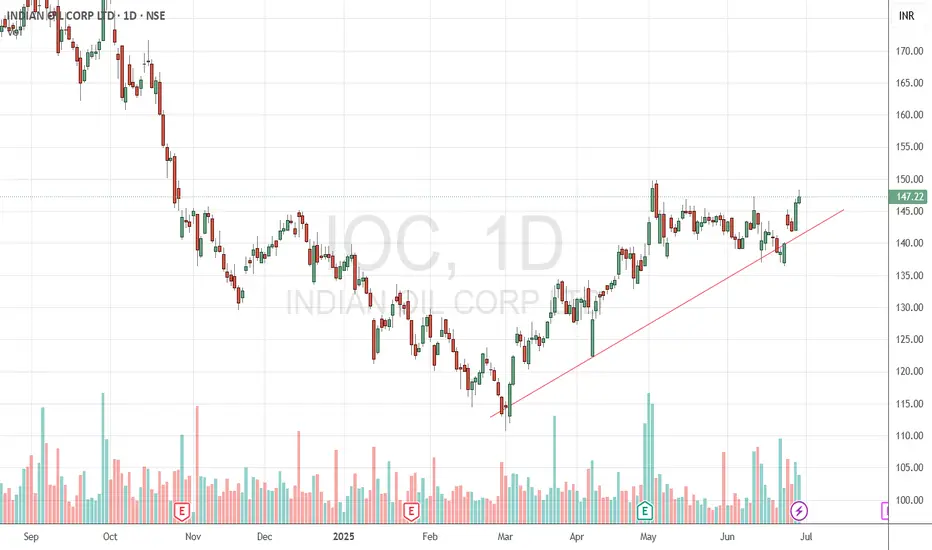
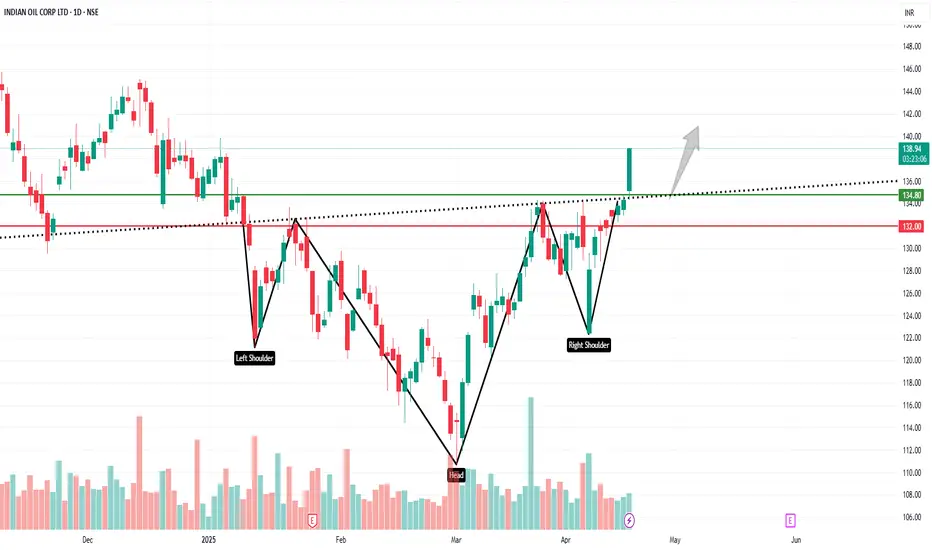
IOC The red horizontal line on the chart represents the resistance zone, which is around ₹145.
In the past, the stock price has stalled at this level multiple times – indicating that it's a strong resistance level.
This time, the stock has attempted to break through this resistance, which is a positive (bullish) signal.
If you find this helpful and want more FREE forecasts in TradingView, Hit the 'BOOST' button
Drop some feedback in the comments below! (e.g., What did you find most useful?
How
Indian oil Corporation (IOC)market is in uptrend and As you see bullish engulfing candlestick form above support level. Simply it's a buy.
it is for educational purpose only before buying do your own research.
My chart doesn't have lots of indicators. if you found something missing kindly comment and tell my fault please.
TIME TO AVERAGE YOUR POSITIONS - IOCEverything is pretty much explained in the picture itself.
I am Abhishek Srivastava | SEBI-Certified Research and Equity Derivative Analyst from Delhi with 4+ years of experience.
I focus on simplifying equity markets through technical analysis. On Trading View, I share easy-to-understand insights to help traders and investors make better decisions.
Indian Oil LongThe Stock Indian Oil has gone through a Massive Correction and now its trying to hold upon its Long Term Support which was a Resistance when the Price Broke that level of 117 on 4th Dec , 2024 and now again after a year the price is again at that exact level and since few trading days the price is holding over that level and indicating good Buying Strength from that Zone.
Remember : "Be fearful when others are greedy, and be greedy when others are fearful"
NSE IOC – Approaching a Key Demand ZoneTimeframe: Daily
After reaching a high of 196.8, the price has declined by over 39% in 13 weeks. It is currently trading below the 50/100 EMA band, with ATR at 3.68 and ADX at 26.02 . According to the Elliott Wave projection, the peak of 196.80 can be identified as a wave ((3)). The security is currently undergoing the formation of a corrective wave (4).
Wave (B) formed at 185.97 , while wave 4 of wave (C) was completed at 145.10 . NSE IOC is now setting up for the final wave 5 of wave (C
Indian Oil Here’s a detailed company profile for **Indian Oil Corporation Limited (IOCL)**:
---
### **Company Overview**
**Indian Oil Corporation Limited (IOCL)**, often referred to as **Indian Oil**, is India’s largest commercial oil company and one of the leading energy providers globally. It is a public sector undertaking (PSU) under the ownership of the **Ministry of Petroleum and Natural Gas, Government of India**.
IOC Positioned for Significant Upside Potential: Projected 10%+ Indian Oil Corporation (IOC) has recently experienced a reversal from a well-established support level, accompanied by a notable surge in trading volume, which suggests the potential for continued bullish momentum. Currently, the price is approaching a critical trendline on the daily chart. A breakout above this trendline could signal a significant reversal and drive further upward movement in the coming months. Alternatively, if the price fails to break through, it may retrace to test the suppo