Ion Exchange (India) Ltd.
No trades
No trades
In-depth trading ideas
IONEXCHANGE | Trendline Breakout with Bullish Momentum
📄 Description:
Stock: IONEXCHANG
Timeframe: 1D (Daily Chart)
By: | FinSight Research
⸻
📈 Technical Analysis:
ION Exchange (India) has broken out of a long-term falling trendline on the daily chart, indicating a strong trend reversal. After months of lower lows, the price has finally reversed with strong upward price action and volume support, confirming the strength of the breakout.
The structure has now shifted to a bullish market structure where the stock is forming higher highs and high
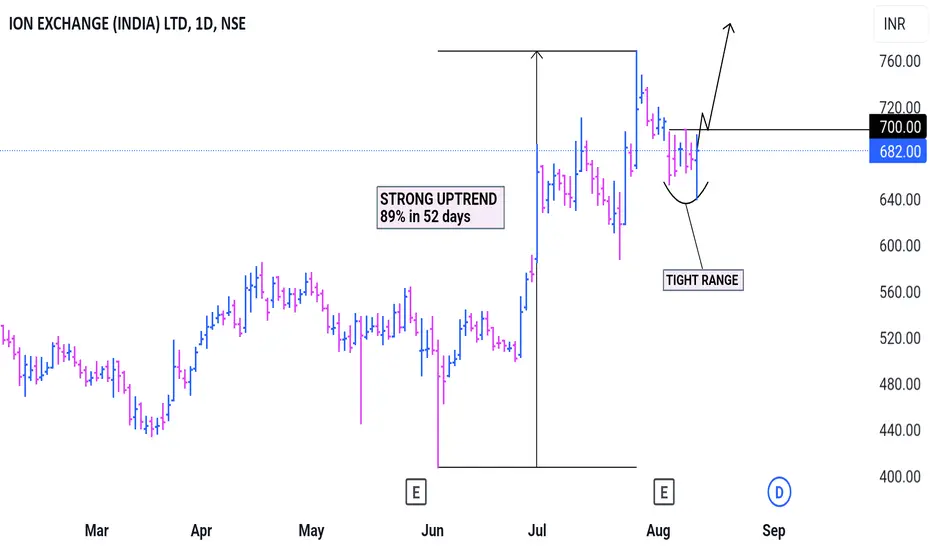
Stock Alert / Analysis - Ion Exchange 🚀 Buy Above: ₹706.65
🎯 Target: ₹927.70
🔑 Key Observations:
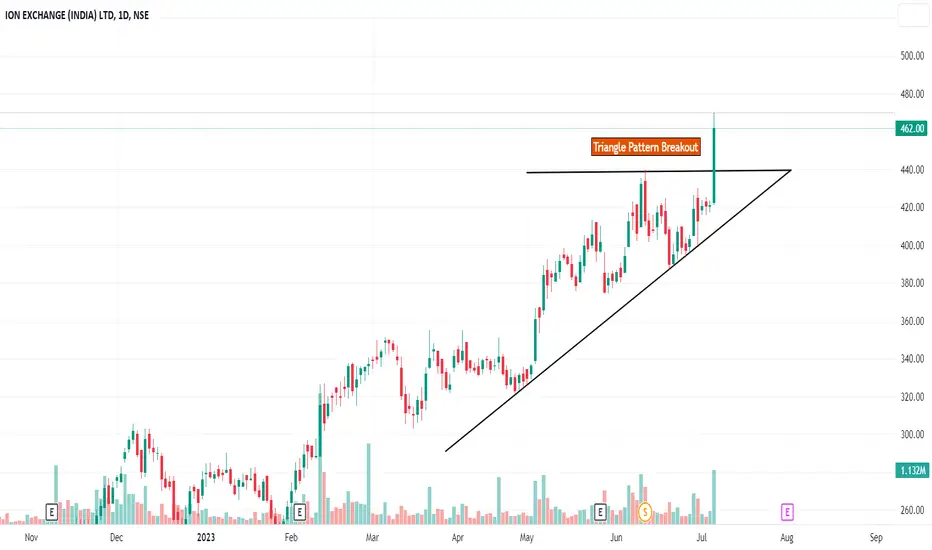
A triangle breakout pattern is forming.
Strong support from rising volumes and positive momentum.
Robust fundamentals: ROE 21.2%, consistent EPS & Sales YoY growth.
📊 Strategy: Enter above ₹706.65 for a potential move toward ₹927.70. Watch for sustained momentum!
Follow for more updates! 🚀
@investofino
#investofino
IONEXCHANGE NSE FLAG&POLE BO WTF SWING/POSITIONALIONEXCHANGE STOCK Analysis
TRADE PLAN (DTF Close Price for SWING)
ENTRY -687 25 to 50% Qty, Add 50% qty 710 DTF Close
SL -605
TARGET -SWING 768, 01-991
Hold For a 1-2 Year or TGT 01
Chart Pattern :
STOCK was in a BEARISH SUBTREND for 8M touching the previous ATH of 687, with 1Month Streak to Touch an new ATH of 768, after retracing and BO of the 8M RBC its showing signs of Recovery forming a Bullish Flag Pattern from in 50-61% FIBO Level .
INDICATORS EMA :
The Price is Currently Tradi
50 SMA Rising - Positional TradeDisclaimer: I am not a Sebi registered adviser.
This Idea is publish purely for educational purpose only before investing in any stocks please take advise from your financial adviser.
It 50 SMA Rising. Suitable for Positional Trading Initial Stop loss lowest of last 2 candles and keep trailing with 50 days SMA if price close below 50 SMA then Exit or be in the trade some time trade can go for several months.
Be Discipline because discipline is the Key to Success in the STOCK Market.
Trade Wha
ATH breakout Good volume build up in daily and weekly timeframe.
ATH breakout and retest conformed on supply zone and after some consolidation of price from the supply zone turned demand zone breakout of consolidation with good volume.
Fundamentals are OK.
DII stakes increased compared to last year.
NOTE: I do my analysis, do yours before trade.
BUY IONEXCHANG PRICE @ 531 28% ROI EXPECTEDBUY IONEXCHANG PRICE @ 531 28% ROI EXPECTED
Buy1 cmp entry @531
Target 1 @686
ROI 1 @28
Buy2 Pending entry @428
Target 2 @686
ROI 2 @60
Our Unique Features
—————————————————————
1. Follow our 10 signals ….10% equity will increase in your account for sure.
2. We are not Trailing stop! or average the trades.
3. 1% Risk Management Per trade.
4. Risk vs Reward up to 25.
Note Please leave comments for any query.
Disclaimer This is my trading experience, it is not an invite or recommendation
#IONEXCHANG 584 TGT700:20% SL533 Recommended Buy - Rachit SethiaIONEXCHANG
CMP 584
TGT 700 ++
SL 533
Return ~ 20%
TF 6months
RR >2.2
NSE:IONEXCHANG
#IONEXCHANG
Factors: BULLISH WEDGE BREAKOUT Trend Following Rising Volume with rising Prices. Flag pattern breakout. Pennant Pattern Breakout with Bullish Candle. Retest Successful. Higher Highs & Higher Lows. Broken above RESISTANCE levels Trading at SUPPORT levels Earnings are strong. Bullish Wedge Breakout Risk Return Ratio is healthy. And Rising from Double Bottom Pattern to Flag Pattern forming. If you
Ion Exchange (India) Ltd has given a breakout on daily timeframeIon Exchange (India) Ltd has given a breakout on daily timeframe with strong volume buildup
Company has delivered good profit growth of 37.4% CAGR over last 5 years.
Company has a good return on equity (ROE) track record: 3 Years ROE 28.5%.
Debt to Equity - 0.07
ION Exchange neven seen in lifeHigher high higher low from begining
Ion Exchange (India) is engaged in a wide range of solutions across the water cycle from pre-treatment to process water treatment, waste water treatment, recycle, zero liquid discharge, sewage treatment, packaged drinking water, sea water desalination etc
Ion Exchange (India) Ltd
STOP LOSS AND TARGETS IN CHART
FUNDAMENTALS
Market Cap
₹ 8,469 Cr.
Current Price
₹ 577
High / Low
₹ 610 / 194
Stock P/E
42.2
Book Value
₹ 56.8
Dividend Yield
0.23 %
ROCE
33.8 %
ROE
26.2 %
Face Value
₹ 1.00
Promoter holding
26.9 %
EPS last year
₹ 13.4
EPS latest quarter
₹ 2.27
Debt
₹ 59.2 Cr.
Pledged percentage
0.00 %
Net CF
₹ 6.28 Cr.
Price to Cash Flow
135
Free Cash Flow
₹ 3.22 Cr.
Debt to equity
0.07
OPM last year
13.0 %
OPM 5Year
12.1 %
Reserves
₹ 819 Cr.
Price
🌋 volcano ready for eruption Stop losss 534
Entry CMP or choice
Breakout trading implementation:
1. **Identifying New Trends:** Breakout trading helps traders identify the beginning of new trends by focusing on price levels where an asset breaks out of its historical trading range.
2. **Volatility Indicator:** Breakouts often occur when there's increased volatility in the market. Monitoring breakouts can provide insights into shifts in market sentiment and potential price movements.
3. **Entry Points:** Breakout points s
Triangle Pattern BreakoutPlease look into the chart for a detailed understanding.
Consider these for short-term & swing trades with 2% profit.
For BTST trades consider booking
target for 1% - 2%
For long-term trades look out for resistance drawn above closing.
Please consider these ideas for educational purpose
Ion Exchange - Investment long positionStock made a double bottom at 1625 and now giving a breakout from pole and flag pattern on weekly basis.
One can initiate longs here and add aggressively after closing above 2100 on weekly basis.
Stock has potential to touch 2600 and 3000 levels. I have 12-18 months timeframe in my mind.
Stock trend is intact until a weekly close below 1500, which is 50% Fibonacci retracement as well. If you are a short term positional player and don’t want to hold for these targets, then 1500 is a very deep st