Mahanagar Gas(MGL) - Simple Breakdown🌟 Good News & Why It Could Grow
🏦 Big investor just bought in – A large institution called Eastspring Investments bought a 5% stake in MGL. When big money moves in, it's usually a good sign.
☀️ Not just gas anymore – MGL is branching out into solar energy, biogas, and even EV batteries. Smart move to stay relevant in the future!
🛡️ Government has their back – A new 2026 law makes sure homes and CNG stations (over 80% of MGL's business) get gas supply priority. So even if there's a global shortage, MGL's main customers stay protected.
💰 They keep paying dividends – MGL recently announced ₹12/share as dividend. They consistently reward their shareholders.
📊 How Has MGL Performed This Past Year?
Simple summary: Sales are going UP 📈, but profits are under pressure 📉
QuarterRevenueNet Profit What Happened? Dec '25₹2,266 Cr₹202 Cr Sales up 11%, but costs ate into profits Sep '25₹2,079 Cr₹191 Cr Weakest margins, but volumes held steady Jun '25₹2,083 Cr₹319 Cr🏆 Best quarter – gas was cheap globally Mar '25₹1,964 Cr₹248 Cr Stable and consistent
Why are profits falling? 😟 Gas bought through US-linked contracts got more expensive. But MGL is now switching to cheaper, more stable contracts — so this problem should ease in 2026. ✅
⚔️ MGL vs Its Competitors
🏆 Winner = MGL — cheapest valuation + low risk from industrial supply cuts = best value in the group right now.
🚦 Should You Buy or Wait?
✅ Reasons to BUY
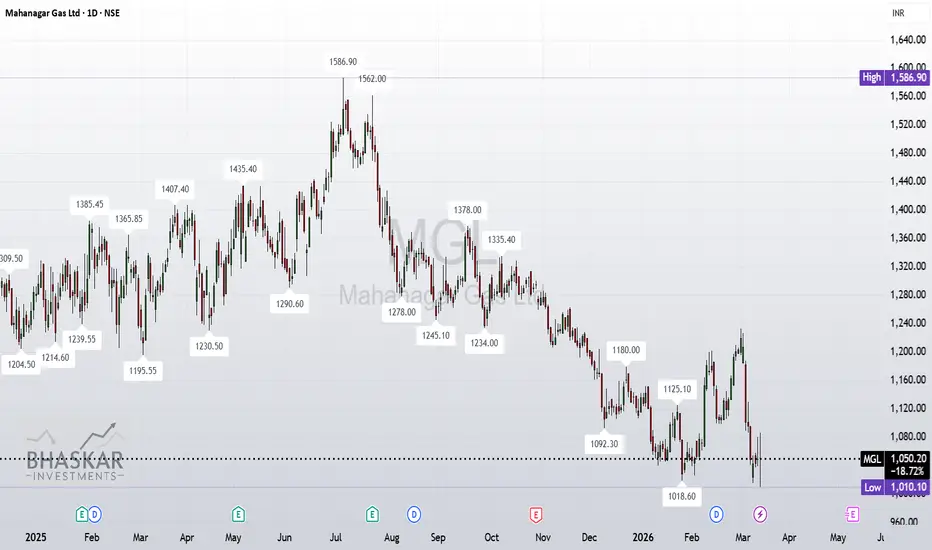
🎯 Analysts think it can go 30–45% higher – Target prices are ₹1,380–₹1,540, while it currently trades around ₹1,050
🧮 Historically cheap – A P/E of ~11x means you're buying it at a bargain
🔄 Better days ahead – Cheaper gas contracts + green energy ventures = possible big stock re-rating in late 2026
⚠️ Reasons to WAIT
🌍 If things heat up in West Asia, LNG prices could spike and the stock might dip short term — better entry point possible for patient investors
💡 Final Advice
Buy slowly, don't go all in at once! 🐢
Try to accumulate the stock in small lots around the ₹1,000–₹1,030 range for the best value. Think of it as a medium-to-long term bet on India's energy future. 🇮🇳⚡
⚠️ This is not financial advice. Always do your own research or consult a SEBI-registered advisor before investing.
Mahanagar Gas Ltd
No trades
No trades
In-depth trading ideas
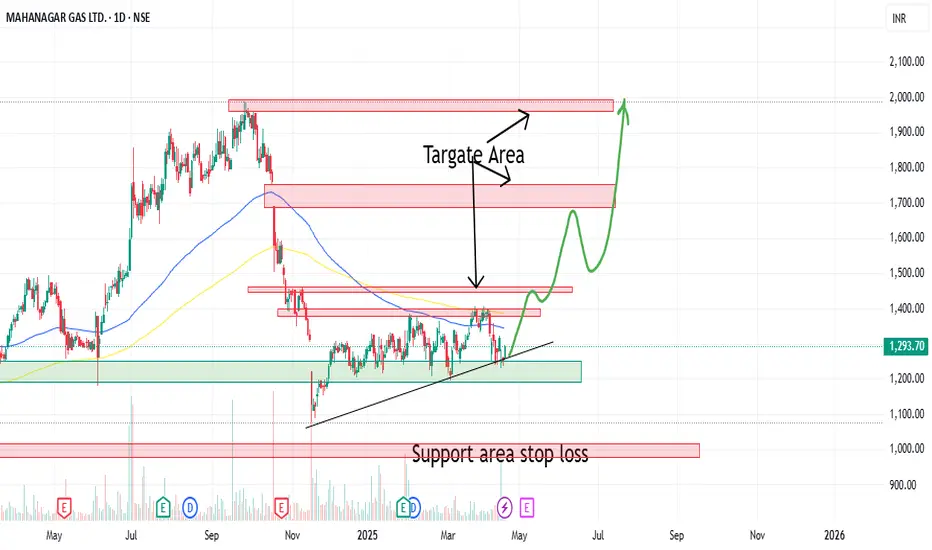
[Short Term]MGL at a Critical Inflection PointMahanagar Gas Ltd is currently trading at a decisive zone where long-term structure and short-term price behavior are colliding. After a strong multi-year uptrend, the stock entered a prolonged corrective phase marked by lower highs and sustained selling pressure from the top. However, price has now reached a historically important rising support zone, making this region a potential make-or-break area for the next major move.
The repeated reactions from the upward-sloping support trendline indicate that buyers are still active at lower levels. Each time price approached this zone in the past, demand stepped in and prevented deeper damage. This suggests that long-term participants are still defending their positions, keeping the broader bullish structure technically alive for now. As long as this support remains intact, the correction can be classified as structural consolidation rather than a trend reversal.
At the same time, the descending resistance trendline continues to cap upside attempts. Every rally toward this zone has been met with supply, showing that sellers are still in control of the higher range. The compression between rising support and falling resistance is gradually tightening, which often precedes an expansion move. Such environments reward patience, as the direction becomes clearer only after confirmation.
If MGL manages to hold above the support trendline and break decisively above the falling resistance, it could trigger a strong recovery phase. In that scenario, the first meaningful upside objective lies near the 1560 region, followed by a broader move toward the 1990–2000 zone over the medium term. This outcome would confirm that the stock has successfully transitioned from correction into a new accumulation-to-expansion cycle.
On the downside, the bullish thesis weakens significantly if price closes below the rising support trendline. A breakdown from this zone would indicate that long-term buyers are stepping aside, opening the door for a deeper retracement and trend reset. In such a case, the current setup would be considered invalid, and downside risk would dominate until a new base is formed.
Overall, MGL is not a momentum trade at this stage but a structure-driven opportunity. The stock is asking the market a simple question: defend and reverse, or fail and reset. The answer will come from how price behaves around this support zone, making the coming weeks crucial for positional traders.
Mahanagar Gas (MGL): A High-Volume Channel BreakoutThe Macro Context Mahanagar Gas Limited (NSE: MGL) has successfully broken out of a multi-month Descending Channel on the Daily timeframe. After a prolonged corrective phase characterized by lower highs and lower lows, the stock has staged a sharp recovery. This breakout is significant as it signals a potential shift in trend from bearish/consolidation to bullish accumulation.
Why this setup is on our radar:
Volume Confirmation: The most critical element of this breakout is the participation. The stock has witnessed a massive spike in volume (1.21M vs 30-Day Avg of 273k). This indicates strong institutional interest driving the price out of the channel. A breakout backed by 4x average volume is statistically more reliable than a low-volume move.
Momentum Shift: The aggressive green candle (+7.57%) has sliced through the upper trendline resistance with conviction. This "Impulse Move" suggests that sellers who were controlling the channel have been overwhelmed by demand.
Structural Turn: By closing above the channel resistance, the market structure has initiated a potential "Change of Character." We are now looking for the formation of higher lows to confirm a sustainable uptrend.
Technical Levels & Plan:
Accumulation Zone: The breakout level (~1,100 - 1,120) now acts as a potential support zone on any retest.
Invalidation Level: The bullish thesis relies on the breakout holding. A daily close back inside the channel (below ~1,050) would signal a "Bull Trap" and invalidate the current momentum.
Structural Resistance (Targets): Short Term: 1,220 - 1,250 (Previous Swing Highs) Mid Term: 1,350 - 1,400 (Major Supply Zone)
Risological Note: We trade the "Evidence." The volume here is the evidence. We are watching for follow-through to confirm that this isn't just a one-day wonder.
Disclaimer: This analysis is for educational purposes only. Technical patterns are probabilistic, not guaranteed. Please consult a SEBI registered investment advisor.
MGL | Gann Square of 9 – 90° Reversal Case Study | 28 Mar 2022This idea demonstrates a historical intraday example of how the Gann Square of 9 can be applied on TradingView to identify precise reversal zones using price–degree relationships.
On 28 March 2022, Mahanagar Gas Ltd (MGL) established its 0° reference point near the session high and then declined sharply.
📐 Gann Degree Structure
0° level: 766
45° level: 752
90° level: 739
Price moved decisively downward from the 0° base and completed the full 90° distance, where a strong price reaction and reversal was observed.
⏱️ Time–Price Validation (Gann Rule)
As per classical Gann intraday guidelines:
A reversal opportunity becomes valid when
45° is reached before 2:30 PM, or
90° is reached before 2:45 PM
In this session, MGL completed the 90° move within the valid time window, making the 739 zone a logical reaction area rather than a random support.
🧠 Key Learning
This case highlights how:
Degree completion confirms market readiness
Reversals emerge from mathematical structure, not indicators
Patience and rule-based execution remove emotional bias
📌 Conclusion
The Gann Square of 9 provides a structured framework for reading intraday price behavior. When price completes a degree move within time, reactions often emerge with high clarity.
Disclaimer:
This chart is shared strictly for educational and analytical purposes only. It is not a trade recommendation or investment advice.
Mahanagar Gas Ltd (MGL) | Gann Square of 9 – 45° Reaction | 28 JThis idea shares a historical intraday case study on Mahanagar Gas Ltd (MGL), demonstrating how Gann Square of 9 price-degree mapping helps identify logical reaction zones.
On 28 July 2022, MGL opened with a downward bias and established its 0° reference based on the Gann Square of 9 framework.
📊 Gann Degree Structure
0° reference: 756
45° level: 742
90° level: 729
Price declined from the 0° base and completed the 45° move well within the intraday time window.
⏱️ Time–Price Observation
According to Gann’s intraday principles:
When the 45° level is achieved before 2:30 PM, it often acts as a reaction or reversal zone
In this session, price respected the 45° level near 742 and showed a clear reaction, confirming the relevance of degree-based market structure.
📐 Key Insight
Rather than breaking directly toward the 90° level, price reacted at the 45° degree boundary, illustrating how Gann degrees act as natural support/resistance zones instead of random price levels.
🧠 Conclusion
This example highlights how:
Converting price into degrees
Combining time and price rules
Following predefined geometric levels
can help traders analyze markets with structure, clarity, and discipline.
Disclaimer:
This idea is shared strictly for educational and analytical purposes only. It does not constitute investment advice or a trade recommendation.
MGL I'm not a SEBI REGISTERED ANYLISIS
just for learning purpose
above the blue line close in D chart candle i will buy and put strictly SL to below red line...once candle close below Red line in D chart...i will close the Trade...
target check the chart
educational purpose only
oits simple ORB WITH VOLUME BREAKOUT STRATEGY...with small condition apply for selecting the stocks
owt not response for your profit and loss
MGLprice is traded at support area so it s possible chance that price will move upper side
This idea is for Educational purpose and paper trading only. Please consult your financial advisor before investing or making any position. Facts or Data given above may be slightly incorrect. We are not SEBI registered.
Mahanagar Gas (MGL) – Big Move Loading?📊 **Mahanagar Gas (MGL) – Big Move Loading?** 🚀⚠️
MGL is **coiling within a tight range**, signaling that a **major breakout or breakdown** could be on the horizon! Traders should be ready as momentum builds.
### 🔎 **Technical Outlook:**
🔹 **Range-Bound Action:** The stock is stuck in a sideways consolidation phase, indicating accumulation or distribution.
🔹 **Breakout Watch:** A breakout above the **resistance zone** could trigger a **momentum rally**, leading to a potential trend shift.
🔹 **Volume Confirmation:** A **surge in volume** during the breakout would validate the move and confirm strong buying interest.
🔹 **Moving Average Factor:** The price remains **below a key moving average**, acting as a dynamic resistance – a breakout above it could confirm a trend reversal.
🔹 **Momentum Indicators:** RSI and MACD should be watched for **bullish crossover** or divergence signals that may hint at an early move.
### 🎯 **What’s Next?**
✅ **Bullish Bias:** A breakout with strong volume could **unlock an explosive rally**, leading to a sustained uptrend.
❌ **Bearish Breakdown:** If support cracks, **selling pressure could accelerate**, triggering a larger downside move.
⚡ **Traders’ Playbook:** Keep a close eye on price action, volume spikes, and key indicator signals. **A big move is brewing!** 💥📈
🔔 **Are you ready for the next breakout?** 🔥🚀
Stock Idea: Mahanagar Gas Limited (MGL)Price: ₹1,336.50
Target: ₹1,500
Stop Loss: ₹1,250
MGL shows solid support at ₹1,250 and potential resistance at ₹1,400. Watch for bullish momentum if RSI crosses above 60. A strong buy opportunity as demand for clean energy rises.
Disclaimer: This is not investment advice. Conduct your own research.
MGL Bullish buy side Mahanagar Gas Limited (MGL) is exhibiting a bullish trend on the weekly chart, indicating a positive market sentiment and potential upward movement in its stock price. This bullish outlook suggests that investors are optimistic about the company's future performance, possibly due to favorable market conditions, strong financial results, or positive industry developments. As a result, the stock is expected to experience upward momentum, attracting more buyers and potentially leading to higher price levels in the coming weeks.
MAHANAGAR GAS LTD S/R Support and Resistance Levels:
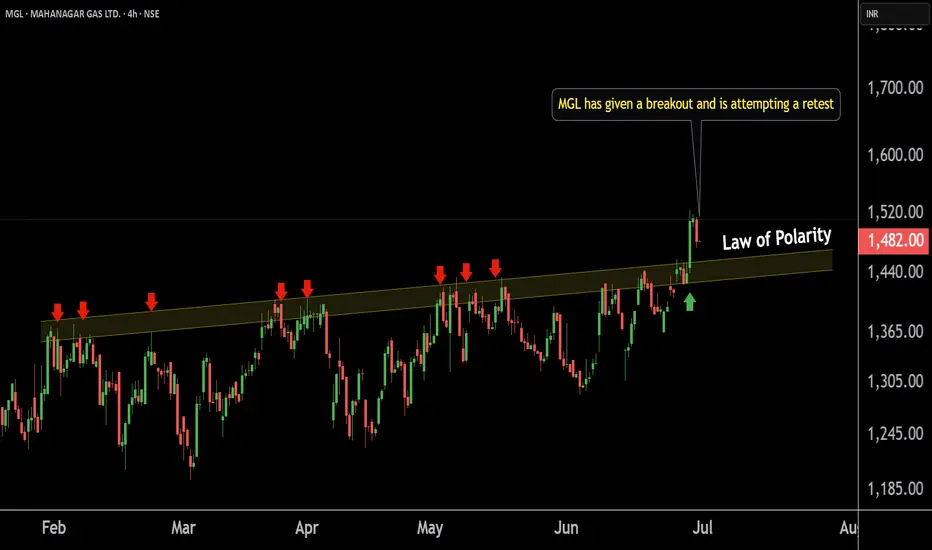
Support Levels: These are price points (green line/shade) where a downward trend may be halted due to a concentration of buying interest. Imagine them as a safety net where buyers step in, preventing further decline.
Resistance Levels: Conversely, resistance levels (red line/shade) are where upward trends might stall due to increased selling interest. They act like a ceiling where sellers come in to push prices down.
Breakouts:
Bullish Breakout: When the price moves above resistance, it often indicates strong buying interest and the potential for a continued uptrend. Traders may view this as a signal to buy or hold.
Bearish Breakout: When the price falls below support, it can signal strong selling interest and the potential for a continued downtrend. Traders might see this as a cue to sell or avoid buying.
20 EMA (Exponential Moving Average):
Above 20 EMA: If the stock price is above the 20 EMA, it suggests a potential uptrend or bullish momentum.
Below 20 EMA: If the stock price is below the 20 EMA, it indicates a potential downtrend or bearish momentum.
Trendline: A trendline is a straight line drawn on a chart to represent the general direction of a data point set.
Uptrend Line: Drawn by connecting the lows in an upward trend. Indicates that the price is moving higher over time. Acts as a support level, where prices tend to bounce upward.
Downtrend Line: Drawn by connecting the highs in a downward trend. Indicates that the price is moving lower over time. It acts as a resistance level, where prices tend to drop.
RSI: RSI readings greater than the 70 level are overbought territory, and RSI readings lower than the 30 level are considered oversold territory.
Combining RSI with Support and Resistance:
Support Level: This is a price level where a stock tends to find buying interest, preventing it from falling further. If RSI is showing an oversold condition (below 30) and the price is near or at a strong support level, it could be a good buy signal.
Resistance Level: This is a price level where a stock tends to find selling interest, preventing it from rising further. If RSI is showing an overbought condition (above 70) and the price is near or at a strong resistance level, it could be a signal to sell or short the asset.
Disclaimer:
I am not a SEBI registered. The information provided here is for learning purposes only and should not be interpreted as financial advice. Consider the broader market context and consult with a qualified financial advisor before making investment decisions.
MGL Next Week Downside Target 1680MGL may see a downside trend next week, with the stock moving downwards with lower low formations on the daily chart frame. The stock is also down by 50% on the RSI indicator. The stock is also seen in a downtrend on our golden moving average, with a small stop loss that could lead to selling in the stock next week.
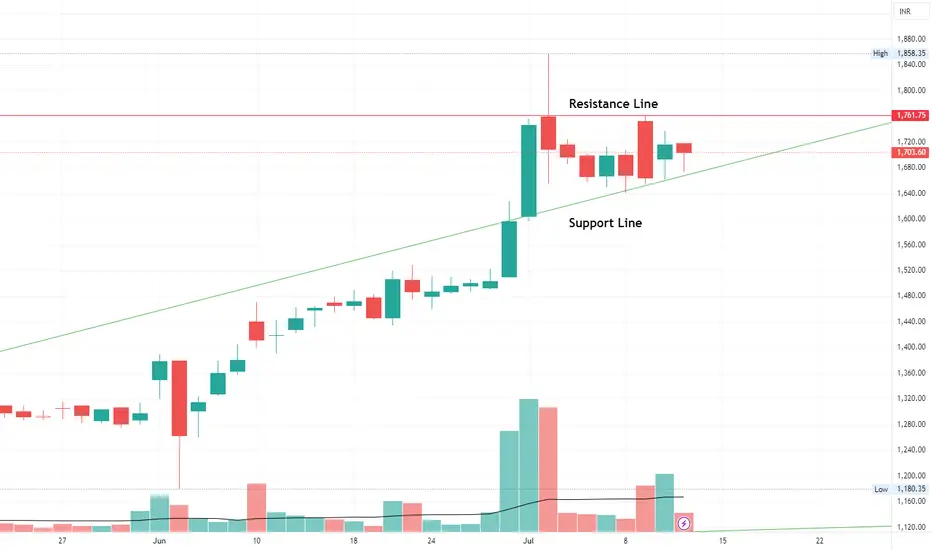
MGL Breakout CandidateMGL has recently showed good movement. With budget around the corner and possibility of tax cuts and recent boost to CNG bikes, this scrip looks promising. Keep it in watchlist. Trade if it breaks the upper resistance with first target of 1840-1850. Trail stoploss as per your risk appetite.
This is not a recommendation. This idea is for educational purpose only. Consult your financial advisor before investing.
Review and plan for 11th July 2024 Nifty future and banknifty future analysis and intraday plan in kannada.
This video is for information/education purpose only. you are 100% responsible for any actions you take by reading/viewing this post.
please consult your financial advisor before taking any action.
----Vinaykumar hiremath, CMT
Review and plan for 10th July 2024Nifty future and banknifty future analysis and intraday plan in kannada.
Stocks to watch- included.
This video is for information/education purpose only. you are 100% responsible for any actions you take by reading/viewing this post.
please consult your financial advisor before taking any action.
----Vinaykumar hiremath, CMT