New India Assurance Company Ltd NIACL - on way to new heights?The New India Assurance Company Ltd is trading 17.54% upper at Rs. 229.80 as compared to its last closing price. The New India Assurance Company Ltd has been trading in the price range of 234.60 & 195.80.
There are 3 analysts who have initiated coverage on The New India Assurance Company Ltd. There are analysts who have given it a strong buy rating & 1 analysts have given it a buy rating.
The company posted a net profit of -242.65 Crores in its last quarter. The Mutual Fund holding in The New India Assurance Company Ltd was at 0.10% in 30 Jun 2026.
The MF holding has decreased from the last quarter. The FII holding in The New India Assurance Company Ltd was at 1.02% in 30 Jun 2026. The FII holding has increased from the last quarter.
The New India Assurance Company Ltd reported a net profit of 1412.26 Cr in 2026.
New India Assurance Co. Ltd.
No trades
No trades
In-depth trading ideas
Master the Inverse Head & Shoulders PatternThe weekly chart of NEducational Spotlight: The chart offers a textbook lesson on how markets transition from a major markdown cycle into a clean bullish reversal structure. Let’s break down the mechanics of this high-probability setup.
🔍 1. Understanding the Market StructureAfter hitting local highs near ₹290, the stock experienced a prolonged corrective phase, printing lower highs and lower lows.The reversal began when price stopped chasing new lows, transitioning into a multi-month accumulation pattern known as an Inverse Head and Shoulders (
H&S):Left Shoulder: Formed during early 2025 around the ₹140 mark before experiencing a temporary relief rally.The Head: A final capitulation drop in early 2026 that found a strong floor near ₹114 before aggressively bouncing back.Right Shoulder: A shallow correction that formed a crucial Higher Low near ₹160, signaling that sellers were losing control to defensive buyers.
💡 2. The Power of the Neckline BreakoutThe dotted horizontal line acting as a resistance boundary across the prior swing peaks is called the Neckline (sitting roughly around the ₹215–₹220 zone).The Trigger: Notice the massive, decisive green weekly candle breaking clean above this boundary.The Significance: A weekly close above a major macro neckline shifts the long-term trend from Bearish/Consolidation to Bullish Expansion.📊 3. Key Takeaways for Traders✅ Patience Over Anticipation: Reversal patterns take months to mature. Entering on the definitive breakout or waiting for a minor retest of the neckline ensures the momentum is truly on your side.
⚠️ Risk Management: In structural swing trades like this, invalidation zones (stop-losses) are typically placed right below the structural swing low of the Right Shoulder.
🎯 Target Formulation: Conservatively, the minimum technical target of an Inverse H&S is calculated by measuring the depth from the Neckline down to the base of the Head, then projecting that same distance upward from the breakout point.
Disclaimer: This post is strictly for educational purposes to help visualize market structure and pattern recognition. It does not constitute financial or trading advice.
need to ride with NEW INDIA ASSURENCE AS per ELIIOTT WAVE here wave 2 n wave 4 are in law of alternation / law of similarity the( % 0f fall ) expected wave 5 could hit 127 % ie 428.32 level but before that needed to hit 61.8% ie 219.84 and as per TIME PERIOD CALCULATION IT COULD BE Q4 2027 TO Q12028
NIACLDear friends,
Stock price traded at lower end and there is support of Trend 📉. So possiblity that price will be moves upper side
This idea is for Educational purpose and paper trading only. Please consult your financial advisor before investing or making any position. Facts or Data given above may be slightly incorrect. We are not SEBI registered
NIACL CONDITIONAL LONG CMP : 190
waiting for weekly close above 195
look at chart for details
Disclaimer:
This publication is strictly for educational and informational purposes only and should not be construed as investment advice, a trading recommendation, or a solicitation to buy or sell any securities. The analysis and views expressed are solely my personal opinions and may contain inherent biases. I may or may not have a position in the securities discussed at the time of writing. Please do your own research and consult with a qualified financial advisor before making any trading or investment decisions. Trading and investing in financial markets involves substantial risk, and you are solely responsible for your own decisions and outcomes.
Market Cap
₹ 31,387 Cr.
Current Price
₹ 190
High / Low
₹ 310 / 135
Stock P/E
30.3
Book Value
₹ 176
Dividend Yield
1.08 %
ROCE
3.56 %
ROE
3.62 %
Face Value
₹ 5.00
THE NEW INDIA ASSU CO LTD S/RSupport and Resistance Levels:
Support Levels: These are price points (green line/shade) where a downward trend may be halted due to a concentration of buying interest. Imagine them as a safety net where buyers step in, preventing further decline.
Resistance Levels: Conversely, resistance levels (red line/shade) are where upward trends might stall due to increased selling interest. They act like a ceiling where sellers come in to push prices down.
Breakouts:
Bullish Breakout: When the price moves above resistance, it often indicates strong buying interest and the potential for a continued uptrend. Traders may view this as a signal to buy or hold.
Bearish Breakout: When the price falls below support, it can signal strong selling interest and the potential for a continued downtrend. Traders might see this as a cue to sell or avoid buying.
MA Ribbon (EMA 20, EMA 50, EMA 100, EMA 200) :
Above EMA: If the stock price is above the EMA, it suggests a potential uptrend or bullish momentum.
Below EMA: If the stock price is below the EMA, it indicates a potential downtrend or bearish momentum.
Trendline: A trendline is a straight line drawn on a chart to represent the general direction of a data point set.
Uptrend Line: Drawn by connecting the lows in an upward trend. Indicates that the price is moving higher over time. Acts as a support level, where prices tend to bounce upward.
Downtrend Line: Drawn by connecting the highs in a downward trend. Indicates that the price is moving lower over time. It acts as a resistance level, where prices tend to drop.
Disclaimer:
I am not a SEBI registered. The information provided here is for learning purposes only and should not be interpreted as financial advice. Consider the broader market context and consult with a qualified financial advisor before making investment decisions.
NIACL: Requested Price ActionOkay, This one is #requested by @sakshisehrawat4192
The chart should tell you everything you need to know. But again, for those who like to read our analysis, Here are a few easy pointers:
- The script is Forming an ascending triangle on a shorter time length
- The ultimate resistance trendline stands strong since 2018
- It is nearing a crucial resistance zone
- The best case would be if it consolidates at the resistance for 4 - 6 weeks and then breaks the resistance.
- A break of it would be a three-in-one breakout i.e. Trendline, triangle, and Resistance zone. This should give a push to the momentum. of course, based on the then price action.
- RSI and MCD are positive indicators
- The PE has Improved a.k.a better valuation
- The first target should be around 140 - 150. Post which it will enter a previous consolidation range making it difficult to draw targets.
- If it continues the upmove the final resistance zone sits at 170-180 levels.
What should we analyze next??
Have Requests, Questions, or Suggestions? Let us know in the comments below.👇
While you do that, how about a boost for some motivation🚀
⚠️Disclaimer: We are not registered advisors. The views expressed here are merely personal opinions. Irrespective of the language used, Nothing mentioned here should be considered as advice or recommendation. Please consult with your financial advisors before making any investment decisions. Like everybody else, we too can be wrong at times ✌🏻
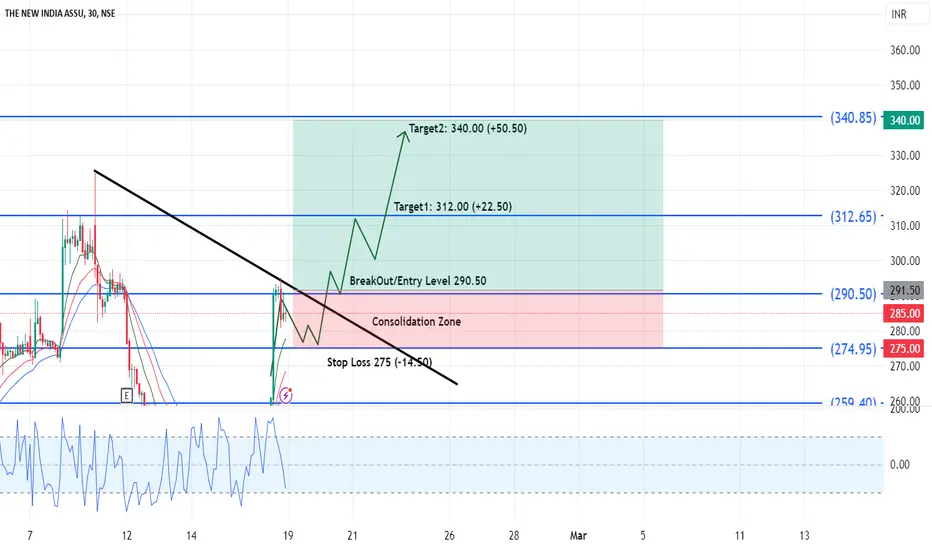
NIACL Upside LevelAs per my analysis, NSE:NIACL has more potential for upside. Best level to take entry is breakout of 290.50 with stop loss of 275 (-14.50 points risk). Upside level would be 312 (+22.50) & 340 (+50.50). This could be low risk and high reward idea.
Note: This is my personal analysis, only to learn stock market behavior. Kindly do your own analysis to take any trade. Thanks.
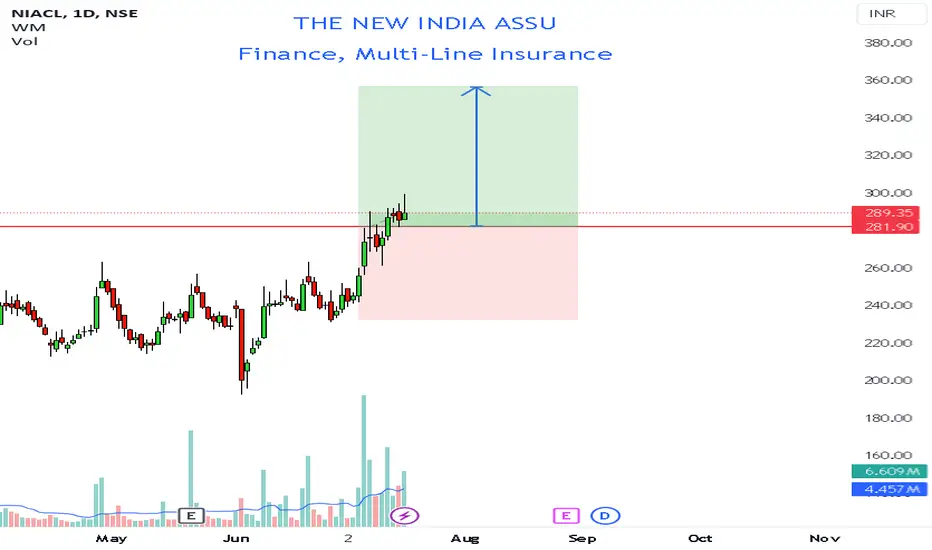
SWING IDEA - NEW INDIA ASSURANCE COMPANYthe New India Assurance Company Limited (NIACL) currently presents a compelling swing buying prospect.
Reasons are listed below :
After multiple tests in the 250-260 zone, NIACL has successfully breached this critical level, signaling a potential shift in momentum.
A bullish marubozu candle on the daily timeframe emphasizes the strength of the upward movement, suggesting sustained buying interest.
Breaking free from a two-month consolidation period, NIACL is poised for a new directional move, indicating a release of pent-up energy in the market.
The consistent formation of higher highs underscores the stock's upward trajectory, reflecting a positive trend.
The overall uptrend is evident, providing a favorable backdrop for traders looking to capitalize on potential price appreciation.
Trading comfortably above both the 50 and 200 exponential moving averages (EMA) signifies a robust position and adds a layer of confidence to the bullish case.
Increased trading volume during this period supports the validity of the breakout, providing additional confirmation of the stock's upward momentum.
Target - 300 // 347
StopLoss - daily close below 242
DISCLAIMER -
Decisions to buy, sell, hold or trade in securities, commodities and other investments involve risk and are best made based on the advice of qualified financial professionals. Any trading in securities or other investments involves a risk of substantial losses. The practice of "Day Trading" involves particularly high risks and can cause you to lose substantial sums of money. Before undertaking any trading program, you should consult a qualified financial professional. Please consider carefully whether such trading is suitable for you in light of your financial condition and ability to bear financial risks. Under no circumstances shall we be liable for any loss or damage you or anyone else incurs as a result of any trading or investment activity that you or anyone else engages in based on any information or material you receive through TradingView or our services.
@visionary.growth.insights
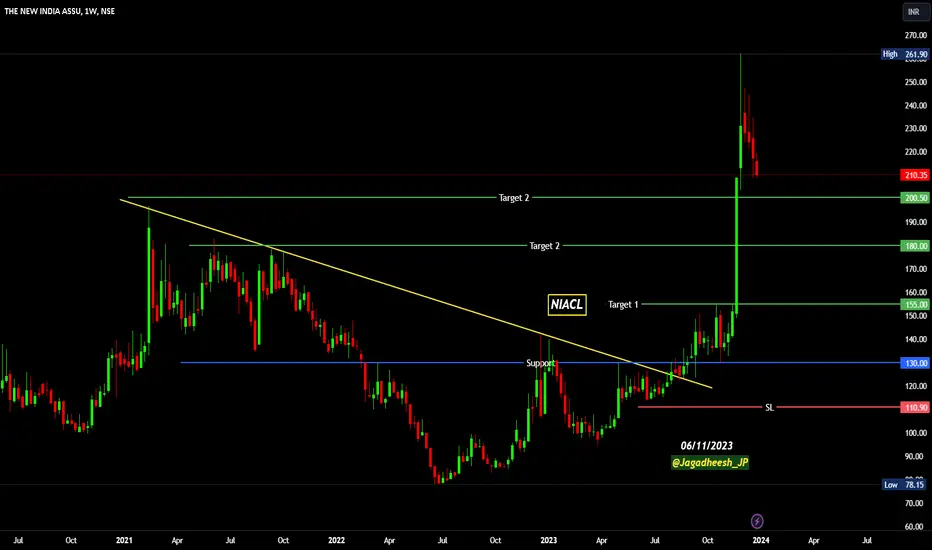
NIACL DOWNTREND BREAKOUT ON 22/08/20232.5 YEARS OF DOWNTREND BREAKOUT HAPPENED ON 22nd Aug 2023
But i suggested this stock on 6th Nov 2023 at 140 level
Entered at 140
Targets - 155,180,200+
ALL 3 TARGETS DONE WITH IN JUST 15 DAYS ONLY 💥🚀💹 & GIVEN 120 POINTS (85%) IN JUST 20 DAYS...... SKY ROCKING STOCK FROM MY WATCHLIST
CMP - 210.35
Re-entry possible at 200 level... if falls again than average at 180 level
@Jagadheesh_JP
In this channel, I share my expertise in trading strategies, technical analysis, and market trends to help you make informed decisions in your trading ventures.
Stay tuned for daily updates, in-depth market analyses, and real-time trading scenarios to witness firsthand how we transform from Zero to Hero in the trading world. My Only aim is to empower you with the knowledge and skills necessary to navigate the complexities of the financial markets successfully.
Disclaimer - All information on this page is for educational purposes only,
we are not SEBI Registered, Please consult a SEBI registered financial advisor for your financial matters before investing And taking any decision. We are not responsible for any profit/loss you made.
Request your support and engagement by liking and commenting & follow to provide encouragement
HAPPY TRADING 👍
60% to 70% Upside. 📊 Stock Breakout Analysis 🚀
Remarkable: A breakout from a 5-year resistance channel has occurred.
Presently at 140, but anticipation of a retest within the range of 120 to 126.
Notable Targets:
🎯 Upper Levels: 165-178 & 222-234.
Anticipated timeline: 12-14 months.
Caution: View becomes invalid if a weekly closing basis dips below 113.