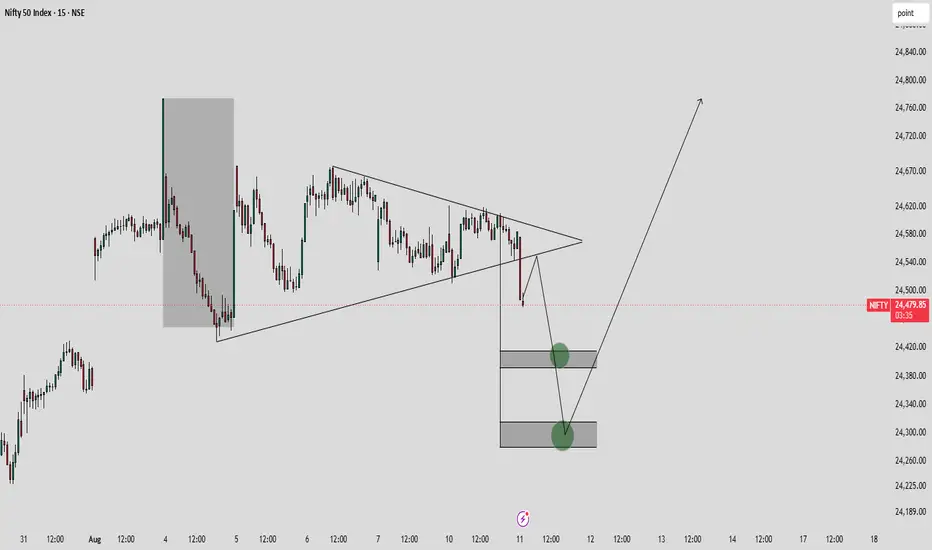
NIFTY SHORT SETUP Nifty current daily bias is bearish. Invalidation zone 24430, below this buying zone. Disclaimer:- This is not buy or sell recommendation.Shortby Joker_traderfx113
Nifty 15 Min Analysis Triangle FMFRjust tp analysis i am not active in indian market just checking today what is happning Longby ThEDeViL18220
Nifty levels - Aug 14, 2026Nifty support and resistance levels are valuable tools for making informed trading decisions, specifically when combined with the analysis of 5-minute timeframe candlesticks and VWAP. By closely monitoring these levels and observing the price movements within this timeframe, traders can enhance the accuracy of their entry and exit points. It is important to bear in mind that support and resistance levels are not fixed, and they can change over time as market conditions evolve. The dashed lines on the chart indicate the reaction levels, serving as additional points of significance to consider. Furthermore, take note of the response at the levels of the High, Low, and Close values from the day prior. We hope you find this information beneficial in your trading endeavors. * If you found the idea appealing, kindly tap the Boost icon located below the chart. We encourage you to share your thoughts and comments regarding it. Wishing you success in your trading activities!by sacxe2214
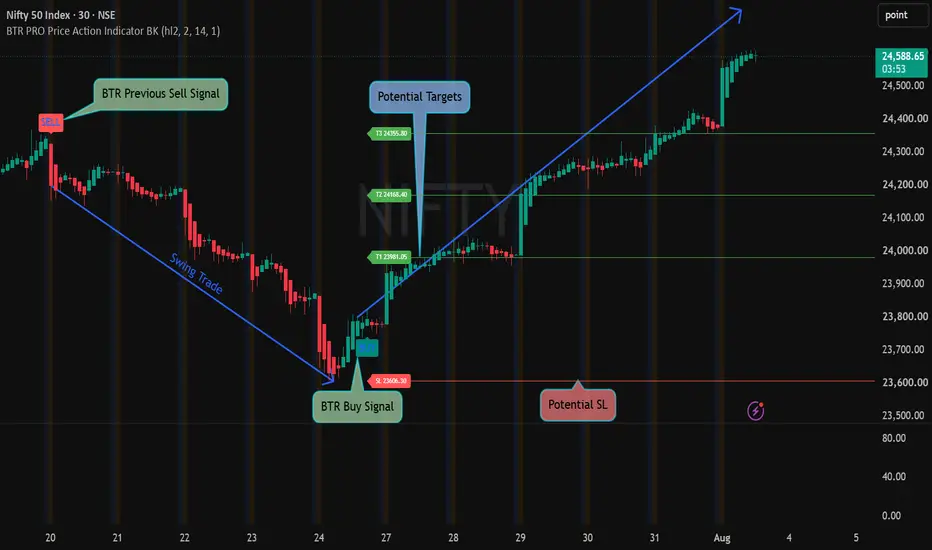
NIFTY 50 | 30-Min Chart | Swing Trade Update📈 BTR Buy Signal continues to demonstrate the power of trend-following. After the previous sell-off, the BTR Buy Signal identified the reversal near the lows. Since then, NIFTY has maintained a strong bullish structure, with all projected targets successfully achieved and price continuing to make higher highs and higher lows. Trade Summary 🟢 BTR Buy Signal Reached ✅ Target 1 Reached ✅ Target 2 Reached ✅ Target 3 Reached 📈 Trend remains bullish with momentum intact. Market Outlook As long as price continues to respect higher lows, the bullish structure remains valid. Existing swing traders can continue to trail their stop loss and let profits run instead of exiting prematurely. 💡 Trading Lesson: "The best swing trades come from staying with the trend, not predicting its end." ⚠️ This analysis is for educational purposes only and should not be considered investment advice. Always manage risk before taking any trade. Longby BK_QuantDesk440
Nifty strategy for todayNifty may open on flat note as per sgx nifty around at 24460 levels in today trading session.on daily charts a bearish candle formed followed by doji candle which is indicated profit booking occured after recent rally in the nifty so I am expecting nifty will come down once it breached and closed 24430 levels on daily closing basis. The equity market are awating for U.S and Iran peace deal once it happened nifty can rally upto 26500 levels which are highest peak in the last financial year. In my point of view one another choppy session expecting in the nifty for today. Nifty trading levels : sell nifty :24510 stop loss :24590 1st target :24435 2nd target :24390 stock of the day :Godrej consumer products buy price :1015 stop loss :1003 1st target :1039 2nd target :1060 Disclaimer : I am not a SEBI Research Analyst please take advise from your financial advisor before take position based on my recommendation. Thanking for your support if liked my content please suggest to your friends to follow my channel Please drop a comment on whether my recommendation is useful and correct my mistakes by viswanath_ktc9
NIFTY SENTIMENT ANLAYSIS FOR 12/08/2026NIFTY | 12 AUGUST 2026 | TIME + PRICE SENTIMENT ⚡ Today’s sentiment: 🟢 STRONG BULLISH ⚡ EXPLOSIVE BEHAVIOUR 🟢 CE DOMINANT 📍 OPEN: 24,473.30 ⏱️ TIME ANCHOR: 10:15 AM 🎯 KEY PRICE MAP: 🔴 24,529 → Upside Trigger 🟣 24,473.30 → Opening Anchor 🔻 24,417 → First Downside Level ⚠️ 24,361 → Critical Support 🔻 24,305 → Major Lower Support 🔥 SECTOR FOCUS: 🥇 Leadership 🥇 IT / Midcap Nifty is currently trading below the opening anchor. So the key question is: 👉 Can bulls reclaim 24,417 and then 24,473.30? 🟢 Above 24,473.30 → bullish strength improves 🚀 Above 24,529 → expansion becomes more credible 🔴 Below 24,361 → bullish thesis comes under pressure 💥 Below 24,305 → downside expansion risk increases ⚡ Market character = EXPLOSIVE. The bullish sentiment remains the framework. PRICE is the confirmation. ⏱️ TIME gives the window. 📍 PRICE gives the signal. 🔥 SECTORS show where participation is appearing. Today's Time + Price range remains valid until 3:15 PM. Watch the levels. Let price confirm. #NIFTY #Nifty50 #TradingView #TimeAndPrice #MarketSentiment #PriceAction #TechnicalAnalysis #IndianStockMarket #IntradayTrading by RaviRoushanSrivastava5
NIFTY Long SETUP Nifty reacted from yesterday’s zone, which indicates that we can consider it as a potential support level today. Therefore, bullish setups are likely to work if the price sustains above this zone.Longby Joker_traderfx4
Nifty strategy for todaynifty may open on gap down note as per sgx nifty around at 24520 levels in todays session. coming to yesterday session nifty hovered around 24600 to 24500 levels within 100 points range and settled down at 24583 points by 13 points marginal gains. I am expecting one another choppy day for nifty due to nifty option expiry hold today so I am advised to traders takes short positions in nifty options instead of option buying because option premiums are killing while consolidation in the nifty. Crude oil price are spiked 5% in yesterday due to inventory of the crude oil is falling below the 1983 levels and also U.S&Iran uncertainity so crude may hit 90 dollors in coming days. Nifty trading levels : buy nifty :24490 stop loss :24430 1st target :24580 2nd target :24620 stock of the day :Paytm in this stock breakout has occured in symmetrical traingle so I am expecting the rally continues today also when it retested the support levels. Buy price :1564 stop loss :1508 target :1620 Disclaimer : I am not a SEBI Research Analyst please take advise from your financial advisor before take position based on my recommendation. Thanking for your support if liked my content please suggest to your friends to follow my channel Please drop a comment on whether my recommendation is useful and correct my mistakes by viswanath_ktc4
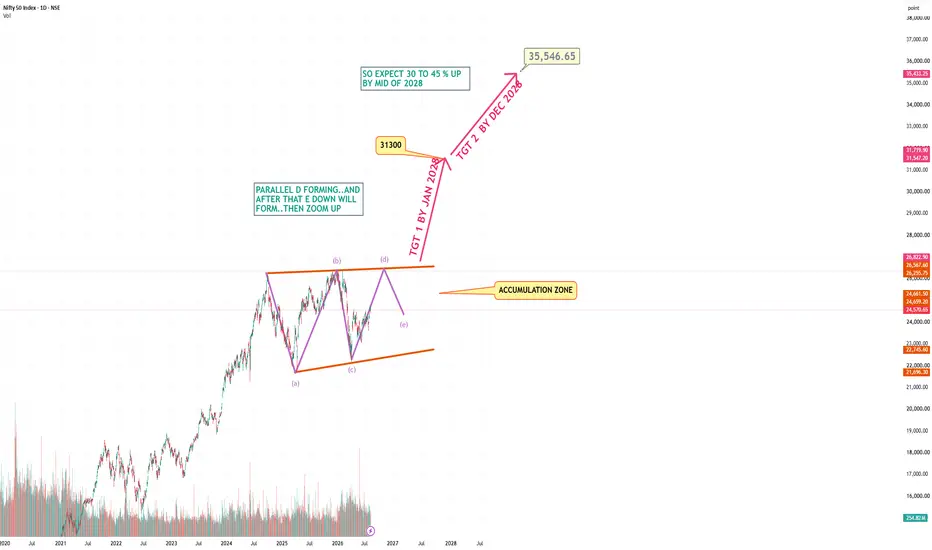
NIFTY TGT BY 2028Nifty is forming a parallel..a b c d e pattern.As seen on the chart d up is forming then e down.,,So once the pattern is completed I mapped the tgts of the parallel patter which shows 30% and from a flag patter tgt mapped and placed on chart is 45%..everything fits..so this is accumulating time now..for a future run up..Feel free for questionsLongby JUDEBOY3
NIFTY SENTIMENT ANALYSIS FOR 10 April 2026🚨 NIFTY 10 AUGUST | TIME + PRICE SENTIMENT The market has started testing the bullish thesis. My Time & Price Sentiment Engine gave: 🟢 STRONG BULLISH DIRECTION ⚡ EXPLOSIVE BEHAVIOUR 🟡 NEUTRAL INTERNAL STRUCTURE ⏱️ TIME ANCHORS: 9:15 AM → Primary Anchor 1:45 PM → Critical Window 📍 OPEN: 24,580.45 🎯 KEY LEVELS: 24,750 → Major Upside 24,692 → Resistance 24,636 → Bullish Trigger 24,601.70 → Anchor Reference 24,580.45 → Open 24,552 → Critical Reference 24,523.10 → Support 24,468 → Lower Support ⚠️ UPDATE: NIFTY HAS DRIFTED BELOW 24,552. Now the question isn't whether the market is bullish or bearish. The question is: 👉 CAN PRICE RECLAIM 24,552? 🟢 Reclaim → Failed breakdown / recovery possibility 🔻 Sustain below → 24,523.10 becomes the next battleground 💥 Break 24,523.10 → 24,468 comes into focus Today’s character: BULLISH INTENT 🟢 + EXPLOSIVE BEHAVIOUR ⚡ + HIGH TWO-WAY RISK 🟡 ⏰ IMPORTANT: The 9:15 AM Time + Price range is VALID ONLY UNTIL 3:15 PM. After 3:15 PM → TODAY’S RANGE EXPIRES. Time tells us WHEN to pay attention. Price tells us WHAT is actually happening. 🎯 WATCH: 24,552 + 1:45 PM This is where the market may reveal its hand. #NIFTY #Nifty50 #TradingView #TimeAndPrice #PriceAction #MarketSentiment #TechnicalAnalysis #IndianStockMarket #IntradayTradingby RaviRoushanSrivastava3
NIFTY SENTIMENT ANALYSIS FOR 13/08/2026🚨 NIFTY | 13 AUGUST 2026 | TIME + PRICE SENTIMENT Yesterday’s **24,305** was the number to watch. Once Nifty recovered it: 💥 24,305 → 24,385 A predefined level. A clean recovery. A rapid expansion. That’s the power of watching TIME + PRICE instead of chasing candles. 🔱 TODAY’S SENTIMENT 🔴 Bearish Pressure ⚠️ Bullish Trap Risk ⚡ Explosive Behaviour 📍 OPEN: 24,424.75 ⏱️ ANCHOR: 11:20 AM 🎯 KEY LEVELS 🔴 24,530 → Major Resistance 🟣 24,424.75 → Opening Anchor 🔴 24,368 → Immediate Resistance 🟢 24,312 → Key Support 🔻 24,256 → Lower Support 🔥 SECTOR FOCUS 🥇 Infra/Metals — 5 🥈 FMCG — 3 🥉 Auto/Consumer — 2 📈 Above 24,368 → 24,424.75 comes into focus. 🚀 Above 24,424.75 → 24,530 becomes the next major test. 🔻 Below 24,312 → weakness can accelerate. 💥 Below 24,256 → downside expansion risk. Today’s question isn't: “Will Nifty go up or down?” It is: **WHAT WILL PRICE DO AT THE IMPORTANT LEVELS?** ⏱️ TIME gives the window. 📍 PRICE gives the confirmation. 🏭 SECTORS show participation. ⚡ BEHAVIOUR shows the intensity. Watch **11:20 AM**. Let PRICE reveal the move. #NIFTY #Nifty50 #TradingView #TimeAndPrice #MarketSentiment #PriceAction #IndianStockMarket #IntradayTrading by RaviRoushanSrivastava4
Nifty levels - Aug 12, 2026Nifty support and resistance levels are valuable tools for making informed trading decisions, specifically when combined with the analysis of 5-minute timeframe candlesticks and VWAP. By closely monitoring these levels and observing the price movements within this timeframe, traders can enhance the accuracy of their entry and exit points. It is important to bear in mind that support and resistance levels are not fixed, and they can change over time as market conditions evolve. The dashed lines on the chart indicate the reaction levels, serving as additional points of significance to consider. Furthermore, take note of the response at the levels of the High, Low, and Close values from the day prior. We hope you find this information beneficial in your trading endeavors. * If you found the idea appealing, kindly tap the Boost icon located below the chart. We encourage you to share your thoughts and comments regarding it. Wishing you success in your trading activities!by sacxe3
Nifty levels - Aug 11, 2026Nifty support and resistance levels are valuable tools for making informed trading decisions, specifically when combined with the analysis of 5-minute timeframe candlesticks and VWAP. By closely monitoring these levels and observing the price movements within this timeframe, traders can enhance the accuracy of their entry and exit points. It is important to bear in mind that support and resistance levels are not fixed, and they can change over time as market conditions evolve. The dashed lines on the chart indicate the reaction levels, serving as additional points of significance to consider. Furthermore, take note of the response at the levels of the High, Low, and Close values from the day prior. We hope you find this information beneficial in your trading endeavors. * If you found the idea appealing, kindly tap the Boost icon located below the chart. We encourage you to share your thoughts and comments regarding it. Wishing you success in your trading activities!by sacxe3
Nifty levels - Aug 13, 2026Nifty support and resistance levels are valuable tools for making informed trading decisions, specifically when combined with the analysis of 5-minute timeframe candlesticks and VWAP. By closely monitoring these levels and observing the price movements within this timeframe, traders can enhance the accuracy of their entry and exit points. It is important to bear in mind that support and resistance levels are not fixed, and they can change over time as market conditions evolve. The dashed lines on the chart indicate the reaction levels, serving as additional points of significance to consider. Furthermore, take note of the response at the levels of the High, Low, and Close values from the day prior. We hope you find this information beneficial in your trading endeavors. * If you found the idea appealing, kindly tap the Boost icon located below the chart. We encourage you to share your thoughts and comments regarding it. Wishing you success in your trading activities!by sacxe3
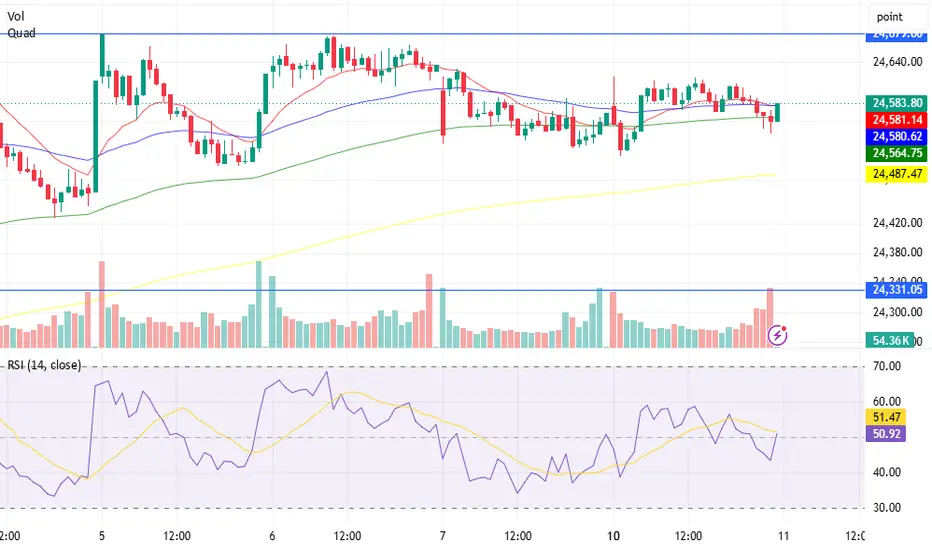
Nifty Analysis EOD – August 10, 2026 – Monday🟢 Nifty Analysis EOD – August 10, 2026 – Monday 🔴 The 24,600 Wall Holds: Nifty’s Tightest 180-Point Range Sets Up for Expiry 🗞 Nifty Summary I was away working on another project, so this diary went quiet for a while — apologies to regular readers for the gap. Nifty opened flat to positive and tested the 24,600 resistance zone, marking the day high at 24,620.95. From there it dropped sharply 110 points, where the PDL + S1 zone stepped in and helped the index find its base. From that base, Nifty climbed back toward 24,600, where resistance did its job again and price got stuck in a 20–30 point range. There were one or two attempts to break the 24,600 wall, but each was rejected, and the day closed at 24,560 — with the adjusted close at 24,583.80, up 23.65 points. Overall, the day stayed inside the IB with a range of 109.85 points — the third session in a row to stay inside IB. The daily candle itself is a tiny-bodied one with a longer lower wick — indecision on the surface, but with dip-buying defending the lows underneath. Tomorrow is weekly expiry and the second expiry under the CAS system. What stands out most: from the previous expiry until today, Nifty’s range has been just 180 points — the smallest I’ve seen in recent memory. The OI band is also very tight, so I’m expecting a volatile session tomorrow. 🛡 5 Min Intraday Chart with Levels 📉 Daily Time Frame Chart with Intraday Levels 🕯 Daily Candle Breakdown Open: 24,581.25 High: 24,620.95 Low: 24,511.10 Close: 24,583.80 Change: +13.15 (+0.05%) 🏗️ Structure Breakdown Type: Doji (Indecision) — tiny body with a longer lower wick, showing support defense but no clear directional push Range: ≈ 109.85 points — low volatility Body: ≈ 2.55 points — near-equal open and close, buyers and sellers essentially fighting to a draw Upper Wick: ≈ 37.15 points — mild rejection at the highs near the 24,600 wall Lower Wick: ≈ 70.15 points — dip buying stepped in and defended the lows 🛡 5 Min Intraday Chart ⚔️ Gladiator Strategy Update ATR: 196.60 IB Range: 109.85 → Medium Market Structure: Balanced Trade Highlights: No Trade Trade Summary: No trades today — the market stayed tucked inside the IB the whole session, and there wasn’t a clean setup that matched the plan. With the range this tight and expiry sitting right on top of it, staying out felt like the right call rather than forcing something. A conservative trader waits for the setup to show up instead of hunting for one. 🧱 Support & Resistance Levels Resistance Zones: 24625, 24675, 24765 ~ 24825 Support Zones: 24530 ~ 24500, 24420, 24365 🧠 Final Thoughts “The market wasn't resting today, it was just deciding — and deciding takes time too.” Today was really about that 24,600 level. Nifty pushed above it early, got rejected hard, found support at PDL + S1, and came right back to test the same wall two or three times — never getting through. Three sessions in a row inside the IB now, which is the tightest stretch I’ve seen in a while. For tomorrow, 24,625 and then 24,675 ~ 24,765/24,825 are the levels I’m watching on the upside — if Nifty finally clears 24,600 and holds above it, that opens room to move. On the downside, 24,530 ~ 24,500 is first support, then 24,420 and 24,365 below that. With weekly expiry and such a tight OI band, I wouldn’t be surprised if one of these levels gives way quickly. Second CAS expiry tomorrow, and after such a tight range building up, I want to stay patient rather than jump at the first move. Better to wait for the session to settle before picking a side. ✏️ Disclaimer This is my personal digital diary and represents my own analysis and point of view. It is not financial advice; please consult a professional advisor before making any trading decisions.by kzatakia2
NIFTY – TODAY’S MARKET OUTLOOK | 14 AUGUST 2026Nifty is likely to open flat to mildly positive. The key levels to watch during the session are 24,400–24,450. BULLISH SCENARIO If Nifty sustains above 24,435–24,450, the index may move towards: - 24,470 -24,500 A sustained breakout above 24,500 could strengthen the bullish momentum. BEARISH SCENARIO If Nifty fails to hold 24,400 and sustains below this level, weakness may extend towards: - 24,360 - 24,310 Key Trading Zones Bullish above: 24,450 Bearish below: 24,400 24,400–24,430: Possible consolidation/choppy zone Trading Note: Avoid taking trades solely on the basis of a level. Wait for confirmation through price action, volume, and candle closing before entering an options trade. Option premiums can move rapidly because of volatility and time decay.Trade with a defined stop-loss and controlled position size. Options trading involves substantial risk. Education purpose only and not financial advice. by vickshik1
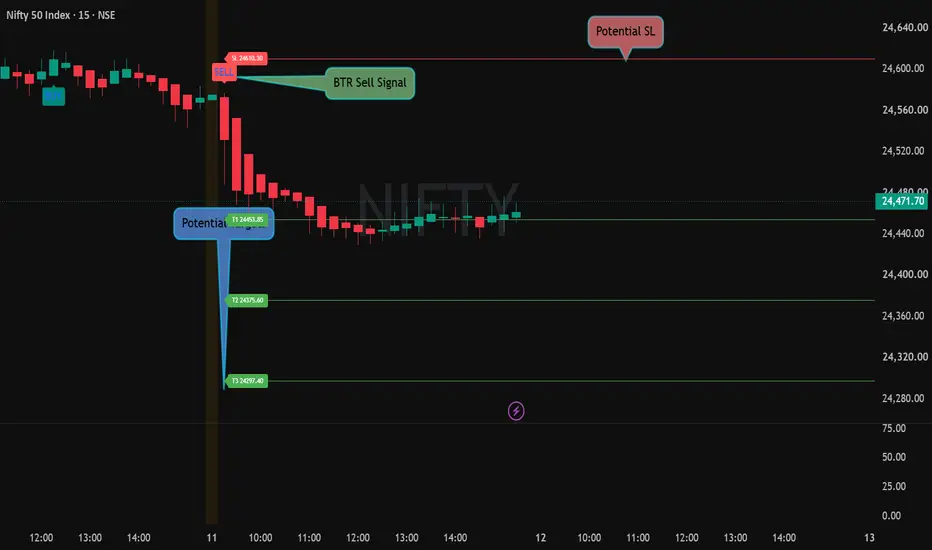
NIFTY 50 | 15-Min Short Setup | BTR IndicatorYesterday’s price action gave a clear bearish move from the 24,580–24,600 area. After the initial fall, price reached around 24,450 and then started consolidating instead of continuing immediately lower. That is where many traders make a mistake — they see the first move, enter late, and then get trapped when the market pauses. For a short setup like this, the important levels are: 🔴 Resistance: 24,600–24,610 🟢 First support: ~24,450 🟢 Next supports: ~24,375 and 24,300 If price remains below the resistance zone, sellers still have an advantage. But if price reclaims that zone, the bearish view needs to be reconsidered. The trade is not the signal. The trade is the entire process — entry, risk, patience and exit.Longby BK_QuantDesk1
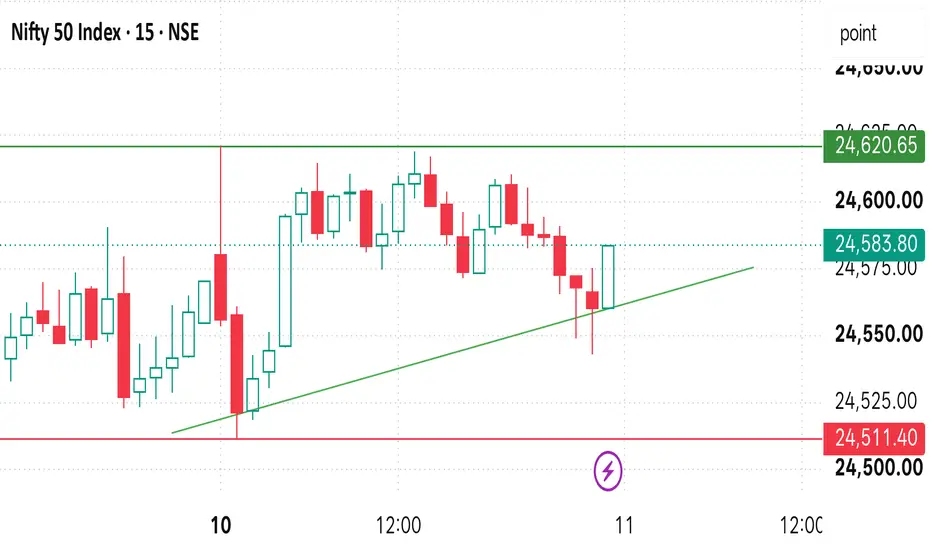
Nifty Tuesday Expiry: Key Levels & Possible SetupsNifty has remained range-bound over the past few sessions. Yesterday, Nifty traded between 24,511 and 24,620, making these levels important for Tuesday's expiry. Bearish Setup: If Nifty approaches 24,620–24,630 and forms a clear rejection candle, while a 15-minute candle fails to close above 24,630, a PE setup may be considered after confirmation. Preferred: 1-strike ITM PE Alternative: ATM PE Possible targets: 24,600 - 24,570 - 24,540 and below Bullish Setup: If Nifty approaches 24,500–24,511 and forms a reversal candle, while a 15-minute candle holds above 24,500, a CE setup may be considered after confirmation. Preferred: 1-strike ITM CE Alternative: ATM CE Possible targets: 24,540-24,560 -24,580 My View I would consider 24,500–24,630 as the broader decision zone. Above 24,630 with a sustained 15-minute close - bullish breakout possibility. Below 24,500 with a sustained 15-minute close - bearish breakdown possibility. Until then, rejection at resistance or reversal from support could provide the better risk-defined setups. This post is for educational purposes only and is not financial advice. Options trading involves substantial risk.by vickshik1
Nifty strategy for todayNifty may open around 24350 levels as per sgx nifty in today session on gap down note.all asian markets are traded with mixed cues in early morning within a range so I am expecting low volatality in our indexes also which is good market for option writers instead of option buyers so I am advised to traders sell out of the money options instead of buying positions at support and resistance levels and maintain strict stop losses. India vix traded at 11 it is good level for long term investors who are accumulated stocks at support levels.keeping eye on Crude oil prices ,inflation, rupee moments and monsoon updates which are given directions to our market. Nifty trading levels : Buy nifty :24320-24300 stop loss :24360 1st target :24372 2nd target :24430 stock of the day :Eclerx serivce in this stock a green candle formed followed by doji candle on daily charts which is positive signal at lower levels so I am advised to traders buy this stock at support levels and maintain keep stop loss which is mentioned below. Buy price :1840-1830 stop loss :1800 1st target :1880 2nd target :1910 Disclaimer : I am not a SEBI Research Analyst please take advise from your financial advisor before take position based on my recommendation. Thanking for your support if liked my content please suggest to your friends to follow my channel Please drop a comment on whether my recommendation is useful and correct my mistakes by viswanath_ktc2
nifty strategy for todayNifty may open on gap down note as per sgx nifty around at 24350 levels in today session. U.S inflatin data declared in yesterday night which is came around at 3.4% it is decreasing from 3.5% in june month so fed may not increase interest rates based on this inflation data in upcoming fed meet. coming to India cpi inflation data it is spiked to 4.5% which is open room for Rbi rate hike in the upcoming policy so investors avoid accumulated stocks at higher levels and at resistance levels. Nifty may consolidated between 24260 to 24430 levels in today trading session so I am advised to traders take positions at resistance and support levels which are mentioned at above. Nifty trading levels: sell nifty :24435 stop loss :24491 1st target :24304 2nd target :24260 Stock of the day : Mah bank buy price :80.80 stop loss :79.50 1st target :82.31 2nd target :83 Disclaimer : I am not a SEBI Research Analyst please take advise from your financial advisor before take position based on my recommendation. Thanking for your support if liked my content please suggest to your friends to follow my channel Please drop a comment on whether my recommendation is useful and correct my mistakes by viswanath_ktc2
Nifty 50 breakout from Triangle, not not enough strenthNifty 50 breakout from Triangle, not not enough strenth to continue bullish momentum.by ZYLOSTAR_EDUCATION1
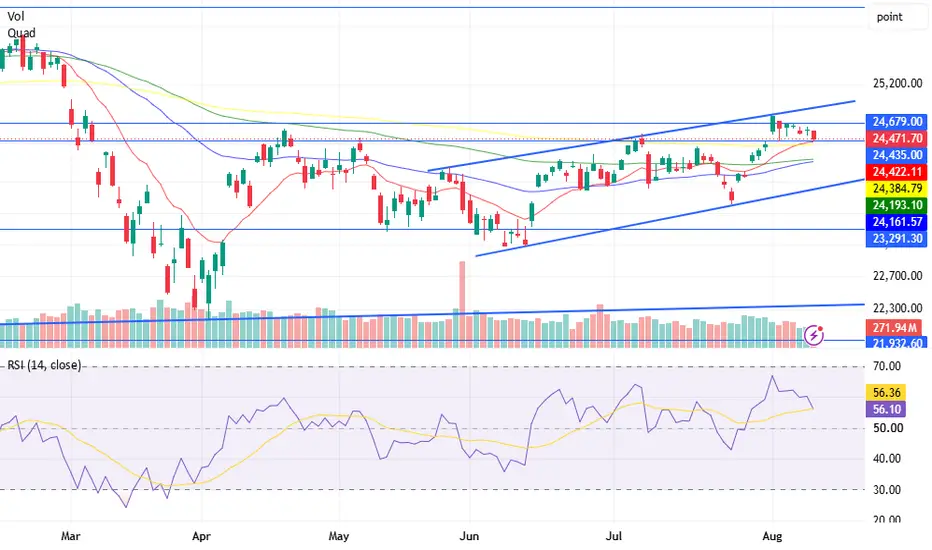
NIFTY 50 — Symmetrical Triangle Breakout 📊 NIFTY 50 — Symmetrical Triangle Breakout Attempt NIFTY 50 is currently at a critical technical juncture, showing a potential breakout from a multi-month Symmetrical Triangle formation on the Daily timeframe. The structure has been developing through a series of higher lows from the April bottom, while the upper boundary has formed a descending resistance trendline, creating a clear compression pattern. Price has now moved above the descending trendline and is trading around 24,570, indicating an initial breakout attempt. However, the breakout still requires confirmation through sustained price action and volume. The current volume appears relatively moderate compared with its 20-day average, so chasing the initial breakout may carry the risk of a false move. 🔑 Key Levels Bullish Confirmation: A sustained move and daily close above 24,450–24,500 could strengthen the breakout and potentially open the way toward: 24,800 → 25,200 → 25,500 → 26,000+ A successful completion of the triangle's measured move could potentially project toward the 26,500–26,900 zone. Bearish Failure: If Nifty falls back below the 24,400–24,500 breakout zone and closes below it, the current breakout could turn into a false breakout. In that scenario, the rising trendline becomes important, with potential downside levels around: 24,000 → 23,600 → 23,200 📈 My View Structure: Bullish breakout attempt Trend: Improving Volatility: Contracting → potential expansion Volume: Needs confirmation Bias: Bullish above 24,500; cautious below the breakout zone The pattern itself doesn't predict the direction — price confirmation does. I would therefore wait for a sustained breakout/retest rather than anticipating the move.Longby saimandali1
NIFTY Outlook for Friday: End-of-Week Test Near EquilibriumThursday closed with the broader market still holding together, but the internal picture remains selective rather than outright bullish. While 32.9% of NIFTY's weight is aligned bullish across both the daily and weekly timeframes, heavyweight participation is still mixed. Financials continue to dominate the index, while Technology remains a drag on the broader structure. For Friday, my AI model places the market in a fairly tight decision zone. Equilibrium: 24,626 Predictive Range: 24,565 – 24,676 Upside Expansion: 24,687 → 24,737 Downside Expansion: 24,575 → 24,514 Since this is the last trading session of the week, I would pay more attention to whether NIFTY can accept above 24,676 rather than simply trading there. A sustained move above that level could open the path towards 24,737, while failure near the upper rail may once again lead to profit booking back towards equilibrium. On the downside, 24,565 remains the first level to watch. A break below it shifts focus towards 24,514, with the model's extreme support near 24,464 if selling accelerates. My approach for Friday: I wouldn't chase moves near the extremes. As long as NIFTY holds around equilibrium, I'd rather let price confirm direction first. End-of-week sessions often produce sharp moves that reverse just as quickly, so confirmation matters more than anticipation.by NeuralMarketsUpdated 114
 Short
Short