Can PFC replicate AXISBANK's June Price action in July?
TF: 75 minutes
CMP: 437
The detailed comparison between Axis Bank and PFC chart's price action are explained within the charts.
Copied below is the chart of Axis Bank
As you can see, the price structure of PFC is almost exhibiting the exact nature that of the Axis bank..
Let's see if July will produce the follow up impulse move in PFC
Disclaimer: I am not a SEBI registered Analyst and this is not a trading advise. Views are personal and for educational purpose only. Please consult your Financial Advisor for any investment decisions. Please consider my views only to get a different perspective (FOR or AGAINST your views). Please don't trade FNO based on my views. If you like my analysis and learnt something from it, please give a BOOST. Feel free to express your thoughts and questions in the comments section.
In-depth trading ideas
PFC – Bullish Continuation Setup Near ₹420 Zone (Buy on Dips)**The price has shown a steady recovery from lower levels and is currently trading around the ₹415–₹420 zone. The structure indicates strength as the stock sustains above support, suggesting a potential continuation of the uptrend if momentum holds.
The key demand/support zone lies near ₹398 – ₹405, which can act as a strong base on pullbacks.
Trade Plan
Entry Zone:
₹410 – ₹420 (on consolidation or minor pullback near current levels)
Stop Loss:
₹398.85 (below key demand zone / invalidation level)
Primary Targets:
₹523.90 (near-term resistance level)
₹579.95 – ₹580.00 (major resistance level / extended target)
Chart Observations
• Price has formed higher lows, indicating bullish structure.
• The ₹398 – ₹405 zone is acting as a strong demand area.
• Current price is holding above support, showing strength.
• ₹523 is the immediate resistance where price may face selling pressure.
• A breakout above ₹523 can push the price toward ₹580 levels.
• Overall trend is shifting towards bullish continuation.
Notes
• This is a buy-on-dips (bullish continuation) setup.
• The stop loss at ₹398.85 helps manage downside risk effectively.
• Traders may consider partial profit booking near ₹523 and trail positions for higher targets.
Disclaimer
This idea is for educational purposes only and not financial or investment advice. Markets are volatile and conditions can change quickly. Always do your own analysis and apply proper risk management before taking any trades.
PFC: Daily Ascending Triangle High Conviction Breakout WatchPFC is currently consolidating within a classic Ascending Triangle on the daily chart. While the stock has faced consistent selling pressure near the ₹374–₹380 resistance zone, the rising support line confirms that the bulls are absorbing all available supply at higher prices.
This structure reflects strong demand absorbing the available supply, coiling for a significant directional move.
Trade Plan
Breakout Trigger Daily close above ₹382 (confirming a clear break of the multi-tap resistance).
Entry Above ₹383 after daily candle confirmation.
Stop Loss Below ₹358 (placed below the 20-day SMA and the recent higher low).
Target Triangle height ≈ ₹50 Target zone: ₹430 – ₹435
Risk–Reward
Entry ~ ₹383
SL ~ ₹358
Risk ~ ₹25
Target ₹430 = ₹47
Target ₹435 = ₹52
Risk–Reward ≈ 1 : 1.9 to 1 : 2.1
Notes
Volume: Watch for a significant volume spike (ideally >5M shares) on the breakout day to confirm institutional participation.
Catalyst: The quarterly results (Q3 FY26) are approaching; this fundamental event often acts as the trigger for such technical setups.
This is a classic volatility compression pattern. When the resistance at ₹380 finally gives way, the upward move is expected to be fast.
Not financial advice. Always manage your risk.
Unlocking Potential: Power Finance Corporation Analysis! 💼📈Traders, let's delve into Power Finance Corporation today ! 🌟 In the daily timeframe, we're witnessing a range-bound movement, with the price testing previous swing highs. 🔄 Anticipate a breakout above this level(red box), potentially targeting Rs. 450 and beyond. But before that it may come around at Rs.400 to go up further. PFC appears poised for bullish action! 🚀 Options traders, explore 400 CE or below 400 CE options with ample liquidity. Let's capitalize on this opportunity! 💼📊
Thank you. See you again in the next post!
Best regards,
Alpha Trading Station
Power Finance Corporation Ltd for 9th Oct #PFC Power Finance Corporation Ltd for 9th Oct #PFC
Resistance 403 Watching above 404 for upside momentum.
Support area 398 Below 398 gnoring upside momentum for intraday
Watching below 398 for downside movement...
Above 403 gnoring downside move for intraday
Charts for Educational purposes only.
Please follow strict stop loss and risk reward if you follow the level.
Thanks,
V Trade Point
Power Finance Corporation Ltd for 6th Oct #PFC Power Finance Corporation Ltd for 6th Oct #PFC
Resistance 415 Watching above 416 for upside momentum.
Support area 408-410 Below 410 gnoring upside momentum for intraday
Watching below 407 for downside movement...
Above 415 ignoring downside move for intraday
Charts for Educational purposes only.
Please follow strict stop loss and risk reward if you follow the level.
Thanks,
V Trade Point
PFC , 1W Breakout In this stock we clearly see the Channel pattern is formed and Ready for Breakout , Wait for candle Close in 1D with good volume , then we can see very good move up to 35% nearly .
As now nifty is given Breakout from 1D Channel pattern and in Market Breadth 1D has given breakout and in weekly market Breadth it is near the Resistance , if we see good volume close in this week we can expect Market will be Bullish for next 2-3 Months .
Follow for more Swing Ideas Like This .
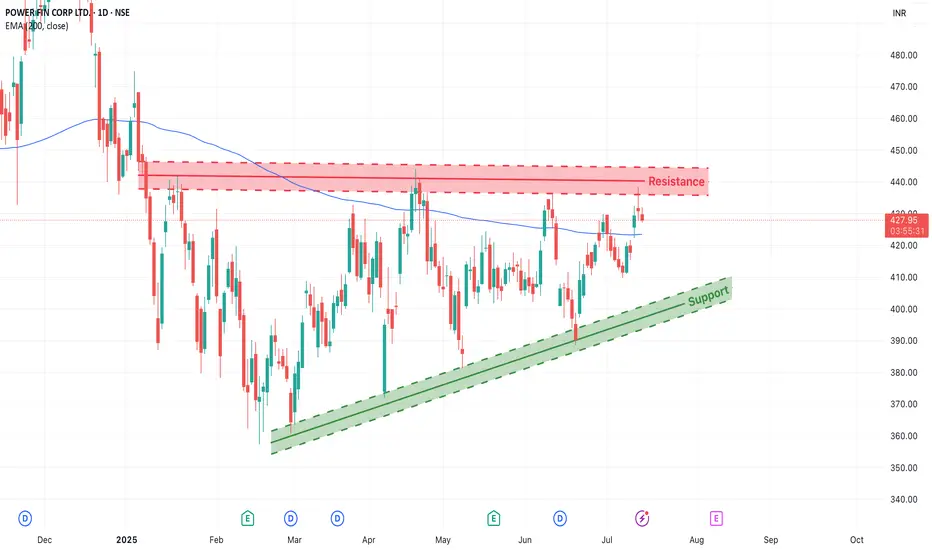
PFC– At Resistance with Ascending Triangle PatternPower Finance Corporation (NSE: PFC) is forming a technically clean structure — trading within a rising trend channel and now testing a critical resistance zone around ₹430–₹440.
This is a make-or-break level, and the market could tip in either direction depending on how price reacts this week.
1. Chart Structure Overview
Support Zone: Defined by a rising green trendline connecting higher lows since March 2025.
Resistance Zone: Red band between ₹430–₹440, where price has previously reversed multiple times.
200 EMA (Blue Line): Currently hovering around ₹423, adding confluence as a dynamic support/resistance level.
This convergence makes the current price zone crucial for directional confirmation.
2. Two Trade Scenarios
Scenario 1: Bullish Breakout (Trend Continuation)
If the price breaks above ₹440 with strong bullish candles, traders can look for:
✅ Entry after a confirmed breakout + re-test of the ₹430–₹435 zone
🎯 Target Zones: ₹455, ₹470+
🛡️ Stop Loss: Below the swing low of the re-test (₹425 or as per price structure)
🔁 Risk/Reward: 1:2 or better
Scenario 2: Resistance Rejection (Short-Term Pullback)
If the price fails to break above ₹430–₹440 and shows reversal patterns:
✅ Entry on confirmation (e.g., bearish engulfing, rejection wick)
🎯 Target Zones: ₹410 (near rising trendline), possible extension to ₹400
🛡️ Stop Loss: Just above the resistance (~₹442–₹445)
🔁 Risk/Reward: 1:2 to 1:3 depending on entry
Thread>
Review and plan for 11th July 2025 Nifty future and banknifty future analysis and intraday plan.
Analysis of "what i traded today".
This video is for information/education purpose only. you are 100% responsible for any actions you take by reading/viewing this post.
please consult your financial advisor before taking any action.
----Vinaykumar hiremath, CMT
Power Finance Corporation Ltd view for Intraday 14th May #PFC Power Finance Corporation Ltd view for Intraday 14th May #PFC
Resistance 415 Watching above 416 for upside movement...
Support area 405 Below 410 ignoring upside momentum for intraday
Watching below 404 for downside movement...
Above 410 ignoring downside move for intraday
Charts for Educational purposes only.
Please follow strict stop loss and risk reward if you follow the level.
Thanks,
V Trade Point
Power Finance Corporation Ltd view for Intraday 24th April #PFC Power Finance Corporation Ltd view for Intraday 24th April #PFC
Resistance 435 Watching above 436 for upside movement...
Support area 430 Below 430 ignoring upside momentum for intraday
Watching below 429 for downside movement...
Above 435 ignoring downside move for intraday
Charts for Educational purposes only.
Please follow strict stop loss and risk reward if you follow the level.
Thanks,
V Trade Point
POWER FIN CORP LTD S/R Support and Resistance Levels:
Support Levels: These are price points (green line/shade) where a downward trend may be halted due to a concentration of buying interest. Imagine them as a safety net where buyers step in, preventing further decline.
Resistance Levels: Conversely, resistance levels (red line/shade) are where upward trends might stall due to increased selling interest. They act like a ceiling where sellers come in to push prices down.
Breakouts:
Bullish Breakout: When the price moves above resistance, it often indicates strong buying interest and the potential for a continued uptrend. Traders may view this as a signal to buy or hold.
Bearish Breakout: When the price falls below support, it can signal strong selling interest and the potential for a continued downtrend. Traders might see this as a cue to sell or avoid buying.
MA Ribbon (EMA 20, EMA 50, EMA 100, EMA 200) :
Above EMA: If the stock price is above the EMA, it suggests a potential uptrend or bullish momentum.
Below EMA: If the stock price is below the EMA, it indicates a potential downtrend or bearish momentum.
Trendline: A trendline is a straight line drawn on a chart to represent the general direction of a data point set.
Uptrend Line: Drawn by connecting the lows in an upward trend. Indicates that the price is moving higher over time. Acts as a support level, where prices tend to bounce upward.
Downtrend Line: Drawn by connecting the highs in a downward trend. Indicates that the price is moving lower over time. It acts as a resistance level, where prices tend to drop.
Disclaimer:
I am not a SEBI registered. The information provided here is for learning purposes only and should not be interpreted as financial advice. Consider the broader market context and consult with a qualified financial advisor before making investment decisions.
PFC Making Flag pattern for 2X targetsThis is the daily timeframe chart of PFC
Prices are down 30% from highs and now currently trading around 400 levels
Stock is making flag pattern and we may get huge upside if stock gives breakout of the resistance
One can expect stock to gp up till 480-490 levels for quick upside
Thank You !!
Check The Support And Resistance Level Befour Investing...Hi ,
Only For Study Purpose...
I am Just Study as per my Treding Some Bullish Condition with
Volume Condition (100% increase): We check if the volume one day ago is greater than twice the volume from two days ago, indicating at least a 100% increase in trading volume:
This condition ensures that there has been a significant increase in trading activity (volume) compared to two days ago.
Combined Bullish Signal: The combined bullish signal now requires all of the following conditions to be met:
The 3-day EMA crosses above the 12-day EMA.
The RSI (14) crosses above 50.
The MACD signal is higher than the previous day's signal.
The MACD signal has increased by more than 20% from the previous day.
The current closing price is higher than the average closing price of the last two days.
Today's volume is greater than yesterday's volume.
The volume one day ago is at least 100% higher than the volume from two days ago.
Alert Condition: The alert condition will trigger when all of these conditions are met, signaling a bullish trend.
[Positional] PFC Buy IdeaWait for the trigger
Note -
One of the best forms of Price Action is to not try to predict at all. Instead of that, ACT on the price. So, this chart tells at "where" to act in "what direction. Unless it triggers, like, let's say the candle doesn't break the level which says "Buy if it breaks", You should not buy at all.
=======
I use shorthands for my trades.
"Positional" - means You can carry these positions and I do not see sharp volatility ahead. (I tally upcoming events and many small kinds of stuff to my own tiny capacity.)
"Intraday" -means You must close this position at any cost by the end of the day.
"Theta" , "Bounce" , "3BB" or "Entropy" - My own systems.
=======
I won't personally follow any rules. If I "think" (It is never gut feel. It is always some reason.) the trade is wrong, I may take reverse trade. I may carry forward an intraday position. What is meant here - You shouldn't follow me because I may miss updating. You should follow the system I share.
=======
Like -
Always follow a stop loss.
In the case of Intraday trades, it is mostly the "Day's High".
In the case of Positional trades, it is mostly the previous swings.
I do not use Stop Loss most of the time. But I manage my risk with options as I do most of the trades using derivatives