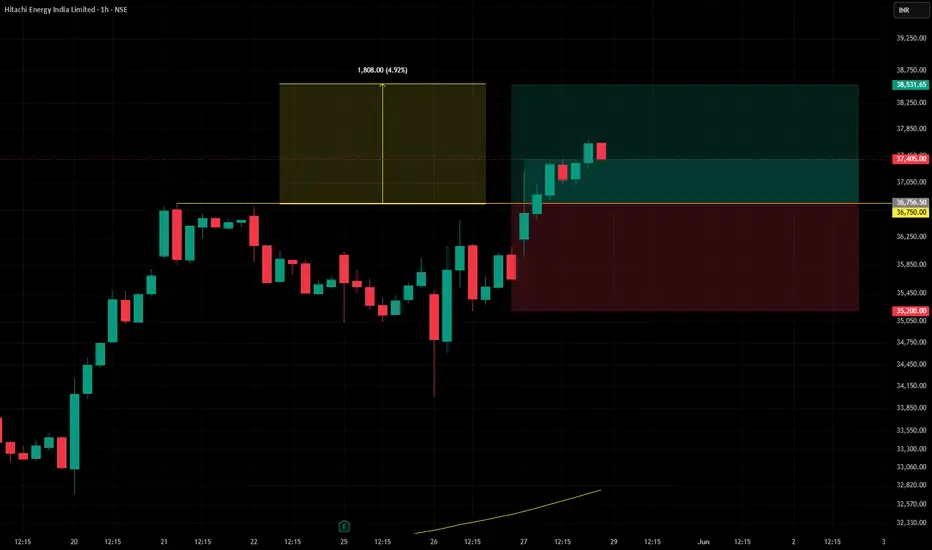
Hitachi Energy
arameter Details
Instrument Hitachi Energy India Ltd.
Timeframe Daily
Trend Context Long‑term bullish; short‑term corrective phase approaching 141 SMA (≈ 26,313).
Entry Zone 26,325 ± 50 pts — near 141 SMA and prior demand cluster.
Stop‑Loss 23,400 — below structural demand and swing low.
Target 38,000 — aligns with projected recovery wave and prior resistance zone.
Risk (pts) 2,925
Reward (pts) 11,675
Risk–Reward Ratio 5.87 : 1
Probability High
Trade Type Swing / Positional
Holding Period 6–10 weeks (approx.)
Confirmation Triggers - Bullish reversal candle near 26,300 support. - Volume expansion on breakout above 30,000. - Sustained close above 91 SMA (30,381).
Invalidation Daily close below 23,400 with volume.
Technical Bias Bullish continuation after corrective wave completion.
🧭 Commentary
The dotted yellow projection indicates a two‑phase recovery: short‑term retest of support followed by a strong impulsive leg toward 38,000.
The 26,300 zone acts as a confluence of moving‑average support and prior demand, making it a high‑probability entry area.
Maintain position sizing discipline — risk per trade ≤ 1–2 % of capital.
Hitachi Energy India Limited
No trades
No trades
In-depth trading ideas
HITACHI ENERGYHitachi Energy India Ltd. (NSE: POWERINDIA)
Prepared by Sucrit Patil | The SmartWay Research Desk | 28 May 2026
A Bengaluru‑based power technology and energy solutions company, incorporated in 1989 (formerly ABB Power Products & Systems India Ltd.). Hitachi Energy India provides grid automation, transformers, high‑voltage products, and digital energy solutions, serving utilities, industries, and infrastructure projects.
Promoter Holding (Mar 2026): Hitachi Energy & ABB Group — 75.00% stake (no pledges)
FY22–FY26 Snapshot
Revenue Growth: FY25 revenue ₹5,215 Cr vs ₹4,612 Cr in FY24 (+13.1% YoY). → Good
Net Profit: FY25 PAT ₹312 Cr vs ₹268 Cr in FY24 (+16.4% YoY). → Good
Operating Margin: FY25 EBITDA ₹612 Cr, margin 11.7% vs 11.2% last year (+50 bps). → Good
Equity Capital: Stable, face value ₹2. → Good
Dividend Policy: Dividend ₹10.00/share declared for FY25. → Good
Asset Building: Investments in digital substations, HVDC technology, and renewables integration. → Good
Sales: Strong demand from utilities, renewable energy projects, and industrial automation. → Good
Expense: Raw material and logistics costs remain elevated; efficiency gains offset. → Neutral/Good
EPS: FY25 EPS ₹62.45 vs ₹53.65 last year (+16.4%). → Good
Institutional Interest & Ownership Trends (Mar 2026)
Promoter Holding: 75.00% (no pledges)
FII Holding: 6.12%
DII Holding: 8.34%
Retail & Others: 10.54%
Strategic Moves & Innovations
Expansion in HVDC transmission and grid automation.
Focus on renewable energy integration and smart grids.
Partnerships with utilities and industrial clients for digital substations.
Diversification into AI‑driven energy management solutions.
Cash Flow & Balance Sheet Strength
Market cap ~₹26,500 Cr.
Debt‑to‑equity ratio ~0.18 (low leverage).
Book value per share ₹412.00; P/B ~14.9.
EPS (TTM) ₹62.45; P/E ~98.3.
Risk Factors
High P/E ratio ~98.3, indicating premium valuations.
Dependence on infrastructure and utility capex cycles.
Exposure to global supply chain volatility.
Competition from Siemens, GE, and other global players.
Investor Takeaway
Hitachi Energy India has delivered steady FY25 growth, supported by demand in grid automation, HVDC, and renewable integration. With strong promoter backing from Hitachi Energy & ABB Group, dividend payouts, and leadership in power technology, the company remains a premium play on India’s energy transition. At CMP , valuations are expensive (P/E ~98.3), but justified by sector tailwinds and digital energy leadership.
LOOKS BULLISHMoving Averages (Simple & Exponential): All signals (from 5‑day to 200‑day) in both SMA & EMA suggest strong BUY .
Trend Oscillators:
MACD: Bullish with positive value ~134 .
ADX/DMI: ADX ~23 indicates weak trend, but DMI+ (32.8) > DMI– (14.8), signalling a bullish bias .
Momentum Oscillators:
RSI (~75), Stochastic K/D (~85/71), and Stochastic RSI K/D (~100/81) all in overbought territory.
CCI (~195), PSAR (~14,150) and Momentum (~4,343) are bullish.
However, True Range (~1,071) and ATR (~647) show heightened volatility—coded as SELL signals Technical Summary (May): ~83% of indicators were BUY signals, with 7% SELL, and 10% NEUTRAL
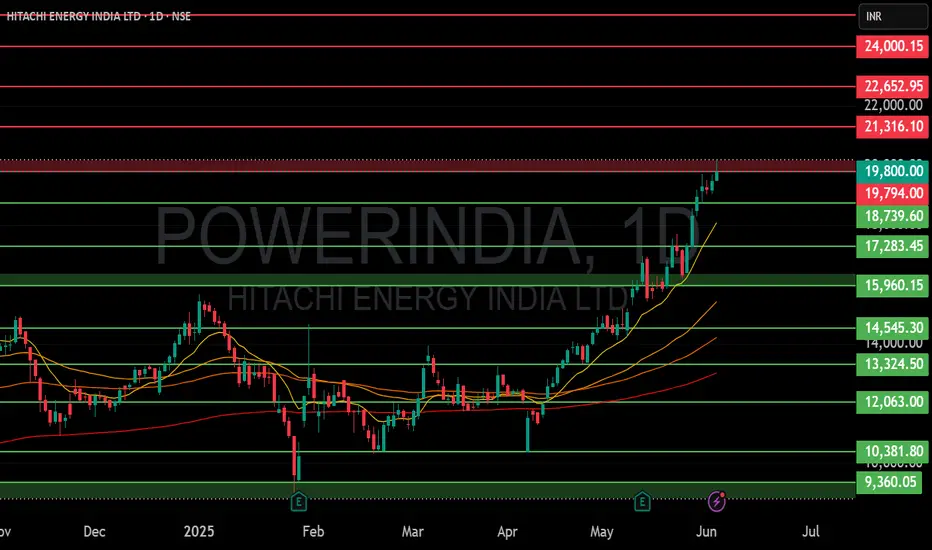
HITACHI ENERGY INDIA LTD S/RSupport and Resistance Levels:
Support Levels: These are price points (green line/shade) where a downward trend may be halted due to a concentration of buying interest. Imagine them as a safety net where buyers step in, preventing further decline.
Resistance Levels: Conversely, resistance levels (red line/shade) are where upward trends might stall due to increased selling interest. They act like a ceiling where sellers come in to push prices down.
Breakouts:
Bullish Breakout: When the price moves above resistance, it often indicates strong buying interest and the potential for a continued uptrend. Traders may view this as a signal to buy or hold.
Bearish Breakout: When the price falls below support, it can signal strong selling interest and the potential for a continued downtrend. Traders might see this as a cue to sell or avoid buying.
MA Ribbon (EMA 20, EMA 50, EMA 100, EMA 200) :
Above EMA: If the stock price is above the EMA, it suggests a potential uptrend or bullish momentum.
Below EMA: If the stock price is below the EMA, it indicates a potential downtrend or bearish momentum.
Trendline: A trendline is a straight line drawn on a chart to represent the general direction of a data point set.
Uptrend Line: Drawn by connecting the lows in an upward trend. Indicates that the price is moving higher over time. Acts as a support level, where prices tend to bounce upward.
Downtrend Line: Drawn by connecting the highs in a downward trend. Indicates that the price is moving lower over time. It acts as a resistance level, where prices tend to drop.
Disclaimer:
I am not a SEBI registered. The information provided here is for learning purposes only and should not be interpreted as financial advice. Consider the broader market context and consult with a qualified financial advisor before making investment decisions.
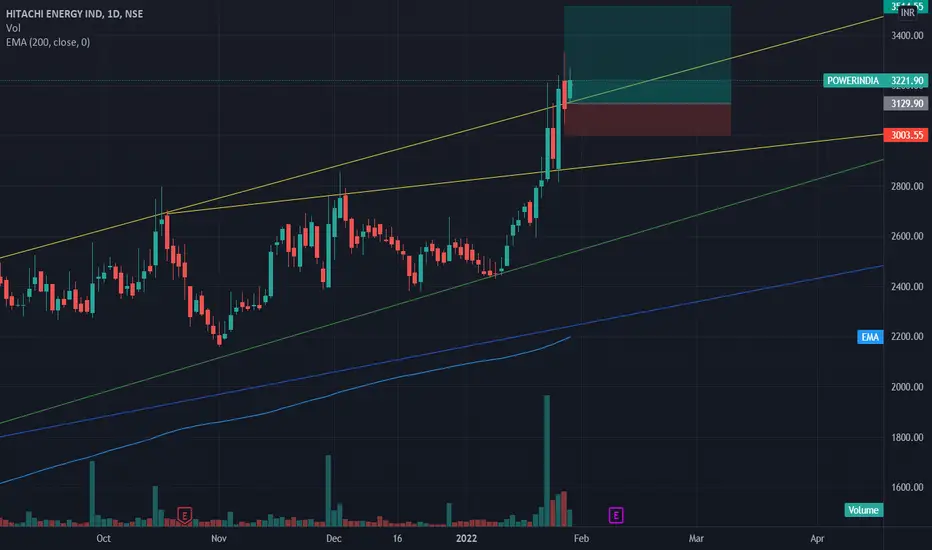
HITACHI ENERGY S/R Support and Resistance Levels:
Support Levels: These are price points (green line/shade) where a downward trend may be halted due to a concentration of buying interest. Imagine them as a safety net where buyers step in, preventing further decline.
Resistance Levels: Conversely, resistance levels (red line/shade) are where upward trends might stall due to increased selling interest. They act like a ceiling where sellers come in to push prices down.
Breakouts:
Bullish Breakout: When the price moves above resistance, it often indicates strong buying interest and the potential for a continued uptrend. Traders may view this as a signal to buy or hold.
Bearish Breakout: When the price falls below support, it can signal strong selling interest and the potential for a continued downtrend. Traders might see this as a cue to sell or avoid buying.
20 EMA (Exponential Moving Average):
Above 20 EMA(50 EMA): If the stock price is above the 20 EMA, it suggests a potential uptrend or bullish momentum.
Below 20 EMA: If the stock price is below the 20 EMA, it indicates a potential downtrend or bearish momentum.
Trendline: A trendline is a straight line drawn on a chart to represent the general direction of a data point set.
Uptrend Line: Drawn by connecting the lows in an upward trend. Indicates that the price is moving higher over time. Acts as a support level, where prices tend to bounce upward.
Downtrend Line: Drawn by connecting the highs in a downward trend. Indicates that the price is moving lower over time. It acts as a resistance level, where prices tend to drop.
RSI: RSI readings greater than the 70 level are overbought territory, and RSI readings lower than the 30 level are considered oversold territory.
Combining RSI with Support and Resistance:
Support Level: This is a price level where a stock tends to find buying interest, preventing it from falling further. If RSI is showing an oversold condition (below 30) and the price is near or at a strong support level, it could be a good buy signal.
Resistance Level: This is a price level where a stock tends to find selling interest, preventing it from rising further. If RSI is showing an overbought condition (above 70) and the price is near or at a strong resistance level, it could be a signal to sell or short the asset.
Disclaimer:
I am not a SEBI registered. The information provided here is for learning purposes only and should not be interpreted as financial advice. Consider the broader market context and consult with a qualified financial advisor before making investment decisions.
Hitachi EnergyStock Resumed its uptrend from 23-July-2024.
can accumulate in dips up to 11730 levels
Short Term Targets
First Target - 13400
second Target - 14400
Stop loss - 10895
Long term investors can buy in every dip and wait for the targets of 15600 and 20000
This idea is for education purpose and cannot be used for real time investment.. kindly consult your financial adviser before investing
[HP] Hitachi Energy Short IdeaStock is trading at 39.4 times its book value. Company has a low return on equity of 12.7% over last 3 years. Where ABB is 20% over last 3 years and that one is trading 30 times! So this is due to it being not in FNO and susceptible to manipulation!
Note -
One of the best forms of Price Action is to not try to predict at all. Instead of that, ACT on the price. So, this chart tells at "where" to act in "what direction. Unless it triggers, like, let's say the candle doesn't break the level which says "Buy if it breaks", You should not buy at all.
=======
I use shorthands for my trades.
"Positional" - means You can carry these positions and I do not see sharp volatility ahead. (I tally upcoming events and many small kinds of stuff to my own tiny capacity.)
"Intraday" -means You must close this position at any cost by the end of the day.
"Theta" , "Bounce" , "3BB" or "Entropy" - My own systems.
=======
I won't personally follow any rules. If I "think" (It is never gut feel. It is always some reason.) the trade is wrong, I may take reverse trade. I may carry forward an intraday position. What is meant here - You shouldn't follow me because I may miss updating. You should follow the system I share.
=======
Like -
Always follow a stop loss.
In the case of Intraday trades, it is mostly the "Day's High".
In the case of Positional trades, it is mostly the previous swings.
I do not use Stop Loss most of the time. But I manage my risk with options as I do most of the trades using derivatives