In-depth trading ideas
SBIN DAILY Bullish crab
VERTICAL DOTTED LINE is Ultra high volume down bar
Higher volume-Professionals are buying into the public selling
Price need to follow Accelerted TREND LINE i.e green line and hit targets else if price breaks PRIMARY TREN D LINE i.e exit trade with small loss before SL
Looking to BUY with those TARGETS and SL
SBIN : Get ready for 25-30% DownsideNSE:SBIN
No Trade Zone (930-1010)
Below 930 a decline upto 700 is quite likely where the price will match the mirror move from the ATH till 930 levels.
At 700 levels there is a confluence of an old order block and the mirror move.
1010 - 930 is a short term trader's zone, that can be attempted as Support and Resistance. For Mid term move this is a NTZ.
SBINSBIN
Technical View
Demand present across Quarterly, Monthly, Weekly and Daily charts.
Weekly demand at 917 and Daily demand at 865.
Higher-timeframe structure remains firmly bullish.
Trade Plan
Entry 1: 917
Entry 2: 878
Average Entry: 898
Stop Loss: 857
Target: 1272
RR: 4.6
Financial Projection
Capital Required: ₹6.73 lakh (25% margin basis)
Net Profit Potential: ~₹11.09 lakh
Net Loss Risk: ~₹1.35 lakh
Net RR: 8.23
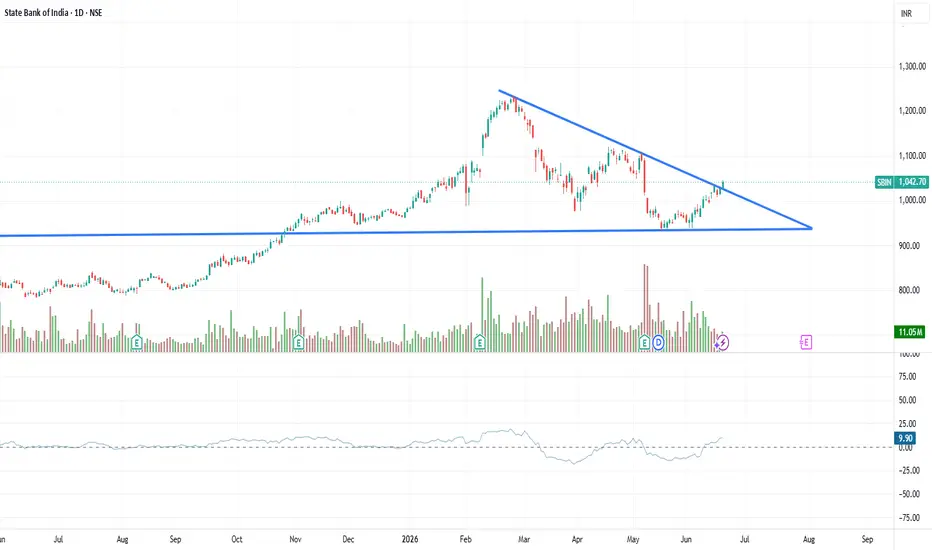
HONEYMOON TIME OVER FOR SBI ?? CAN DRAG TO 965-945 TODAY Result posted muted not so impressive ... Now honeymoon time over for SBI .. Avoid noise and sell on rise counter till weekly close above 1121 .. Can jump bounce to 1060 odd level that time sell on rise counter for the target for 968-945 .. Real break down can be seen weekly close below 945 for 880 ... if not comfort to sell now than wait to bounce but sell on rise....
CMP 1020 SL 1121 Target 968-945-880 ...
K.N: Before enter kindly consult financial advisor
State Bank of India SBIN– Bullish Buy on Dips StrategyTimeframe: Daily
Trend: Primary uptrend intact
SBI continues to trade within a rising trend structure, respecting the ascending trendline formed from previous higher lows. Price has retraced after a strong impulse move and is currently hovering near a confluence support zone, making this a classic bullish continuation setup rather than a trend reversal.
🔍 Technical Observations
Price is holding above the rising trendline, confirming structural strength.
The current pullback aligns with the Fibonacci Golden Zone (0.5 – 0.618), which historically acts as a high-probability demand area.
0 Fibonacci / prior breakout zone is acting as immediate support, indicating healthy retest behavior.
Volume expansion on the previous upside move suggests institutional participation, while current consolidation reflects profit booking rather than distribution.
📌 Trade Plan (Risk-Managed Approach)
Initial Entry: Add less quantity first near current levels to test price acceptance.
Add-on Strategy:
Add more quantity as and when price approaches the rising trendline
Further accumulation near 0 Fibonacci & Golden Zone support, provided price shows stability.
This staggered entry helps reduce timing risk and improves average cost.
🎯 Upside Targets
Target 1: Previous resistance zone
Target 2: Upper range breakout
Expected Upside: ~8–10% if momentum resumes with volume expansion
🛑 Invalidation / Risk Management
A daily close below the rising trendline and 0.618 Fib support would weaken the bullish thesis.
Traders should keep position size aligned with risk tolerance and trail stops as price moves higher.
⚠️ Risk Disclosure
This analysis is for educational purposes only and not financial advice. Stock market investments are subject to market risk. Prices can move against expectations due to broader market conditions, news, or volatility. Always use proper risk management, position sizing, and consult a qualified financial advisor before making trading or investment decisions.
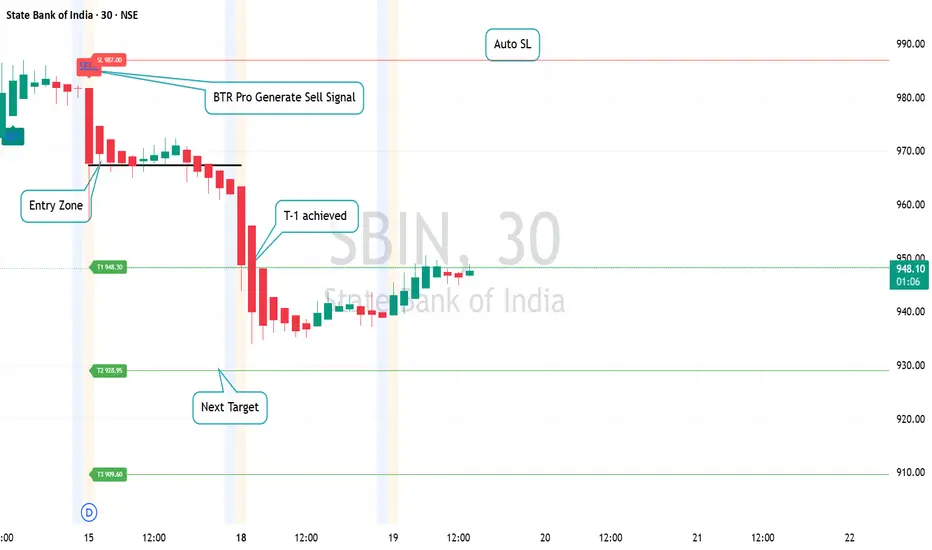
SBIN Swing Trade Setup with BTR Pro Indicator | 30M Timeframe18/05/2026
✅ BTR Pro Generated Clean SELL Signal
✅ Proper Entry Zone Identified
✅ Auto Stop Loss Defined
✅ T-1 Target Achieved Successfully 🎯
⏳ Now Tracking T-2 & T-3 for Extended Swing Move
This is the power of disciplined swing trading with pure price action.
No Noise. No Guesswork. Just Structured Trading. 📊
📌 Entry Based on Confirmation
📌 Risk Managed with Auto SL
📌 Profits Booked Step by Step
BTR Pro helps traders stay calm, systematic, and focused on high-probability setups. 😌
#SBIN #SwingTrading #BTRPro #PriceActionTrading #TradingView #StockMarketIndia #SwingTrader #IntradayTrading #RiskManagement #BankingStocks #PriceActionIndicator
SBIN: Demand Zone Divergence – Potential Long from Channel SuppoTechnical Overview:
State Bank of India (SBIN) is currently testing a major multi-month demand zone identified on the Daily chart. We are observing a confluence of support at the lower trendline of a descending channel.
Key Observations:
Timeframe Confluence: The daily chart shows the price hitting a historical support level.
Volume Analysis: On the 30-minute chart, there is a clear exhaustion in selling pressure. While price is forming lower lows, volume is declining—a classic sign of seller exhaustion.
Risk/Reward: The setup offers a very tight risk profile against a potential return to the upper channel boundary.
Expectation:
A relief rally is expected as the oversold conditions on the lower timeframe meet major daily support.
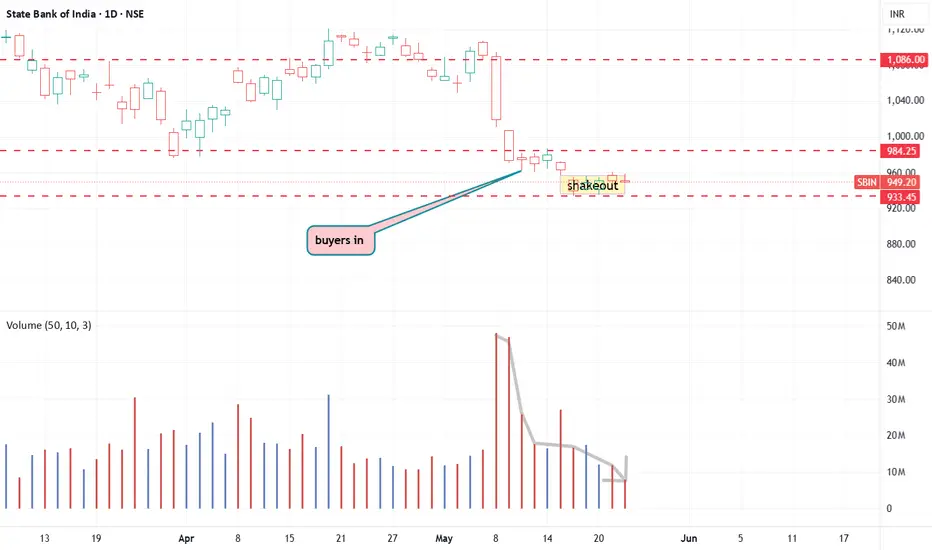
SBI Intraday Trend analysis for May 14, 2026SBI appears bullish for tomorrow. A triangular formation is visible on the chart, and a breakout from this pattern could trigger strong bullish momentum. The immediate resistance levels are placed at 985 and 1000, which may be achieved within a day or two, while the support level stands at 967.
Please note that this is purely my personal market view. Opening gaps and market volatility may alter the levels mentioned above. Traders are advised to conduct their own technical analysis before taking any entry or exit positions.
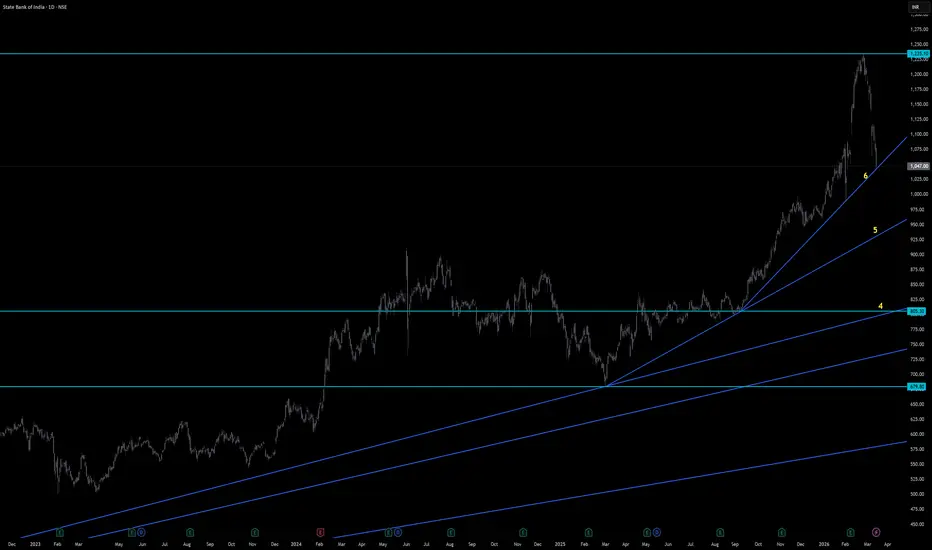
SBI - All time Technical AnalysisI did it so you don't have to :)
Here the stock is sitting on the angle 6. Its support.
A clever bounce from here is possible. What a run up and nice bull run with final exhaustion move.
If it starts going lower the next support is at UP angle 5. around the RS 988 mark.
What do you see ?
Downside Projection In SBIN 1000-1050 ## 🏦 **State Bank of India (SBI) – Business Model (Simple Explanation)**
**State Bank of India (SBI)** is India’s largest public sector bank. Its business model is built around **collecting deposits → lending money → earning interest and fees through financial services**.
---
## 🔹 1. Core Business Model
### ✅ A. Deposit Mobilization (Funding Source)
SBI collects money from customers through:
* Savings Accounts
* Current Accounts
* Fixed Deposits (FDs)
* Recurring Deposits (RDs)
👉 The bank pays relatively **low interest** on deposits.
This becomes SBI’s **low-cost source of funds**.
---
### ✅ B. Lending Activities (Main Revenue Engine)
SBI lends this deposited money at higher interest rates:
* Home Loans
* Personal Loans
* Auto Loans
* MSME & Business Loans
* Corporate Loans
* Agriculture Loans
👉 The difference between lending and deposit rates generates profit.
**Net Interest Income (NII) = Interest Earned − Interest Paid**
This is SBI’s primary earnings driver.
---
## 🔹 2. Non-Interest Income (Fee-Based Revenue)
Apart from lending, SBI earns through:
* Banking service charges
* ATM & transaction fees
* Loan processing fees
* Credit card fees
* Insurance & mutual fund distribution commissions
* Forex and trade services
👉 Known as **Fee Income** or **Other Income**.
---
## 🔹 3. Subsidiary Ecosystem (Additional Profit Engines)
SBI owns several strong subsidiaries:
* **SBI Life Insurance** – Life insurance business
* **SBI Cards & Payment Services** – Credit cards
* **SBI Mutual Fund** – Asset management
* **SBI General Insurance**
👉 These subsidiaries contribute via dividends, fees, and valuation growth.
---
## 🔹 4. Digital Banking Strategy
SBI is transforming into a digital-first bank through:
* **YONO App** (Integrated digital banking platform)
* Online loan approvals
* UPI & digital payments ecosystem
Benefits:
* Lower operating costs
* Higher customer acquisition
* Improved efficiency
---
## 🔹 5. Government Advantage (Structural Moat)
Being a government-backed bank provides SBI with:
* Government salary & pension accounts
* Direct Benefit Transfer (DBT) flows
* Large PSU and infrastructure financing opportunities
* High public trust, especially in rural India
👉 Leads to stable and large deposits.
---
## 🔹 6. Revenue Flow (Simple Model)
```
Customer Deposits (Low Cost Funds)
↓
Loans & Advances (Higher Interest)
↓
Interest Income + Fee Income + Subsidiary Earnings
↓
Net Profit
```
---
## 🔹 7. Competitive Advantages (Moat)
✅ Largest banking network in India
✅ Strong CASA (low-cost deposits) base
✅ Government ownership trust factor
✅ Rural + urban dominance
✅ Powerful subsidiary ecosystem
---
Sbi strategy for tomorrow Sbi in this stock breakout occurred on 3-2-26 at 1090 level then it is rallied upto 1240 levels at this level formed bearish engulfing pattern which is bearish continuation pattern so I am expecting some profit booking will come in this stock so Investors can accumulated short positions around these levels which are mention in below.
Short price : CMP (For risk traders )
: 1225(For safe traders )
Stop loss : 1250 on days closing basis
1 st Target price : 1130
2nd Target price : 1100
Disclaimer : I am not a SEBI Reasearch Analyst please take an advise from your financial advisor before take position based on my recommendation
Thanking you for your support if you liked my content suggest to your friends to follow my channel
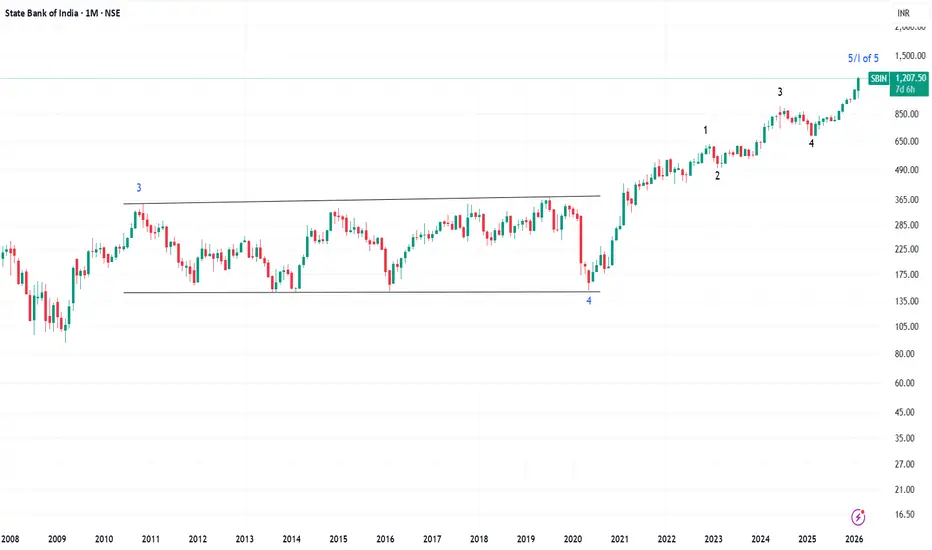
SBIN– Monthly Technical View: Corrective Risk EmergingSBIN has completed a five-wave impulsive advance following a breakout from a prolonged Wave 4 consolidation phase, confirming structural strength in the larger trend. The recent rally leg can be interpreted either as Wave 5 of a larger degree advance or as Wave 1 of a new impulsive sequence.
However, under both interpretations, the current structure suggests that a corrective phase is likely before further directional clarity emerges.
With the stock trading at CMP ₹1206, prices are now approaching upper extension zones, increasing the probability of retracement towards key Fibonacci support levels. While a marginal higher high cannot be ruled out — particularly in the case of a developing ending diagonal formation — the risk-reward at current levels appears skewed toward a corrective pullback.
Initial invalidation level: ₹1226
(A sustained move above this level would weaken the immediate bearish view; however, broader caution persists even if marginal new highs are registered.)
On the downside, key retracement objectives are projected at:
₹815
₹690
₹560
These levels correspond to significant Fibonacci retracement zones of the prior impulsive advance. Until price decisively sustains above resistance, the broader setup favours corrective downside risk in the medium term.
SBINNSE:SBIN
Note :
1. One should go long with a Stop Loss, below the Trendline or the Previous Swing Low.
2. Risk :Reward ratio should be minimum 1:2.
3. Plan your trade as per the Money Management and Risk Appetite.
Disclaimer :
>You are responsible for your profits and loss.
>The idea shared here is purely for Educational purpose.
>Follow back, for more ideas and their notifications on your email.
>Support and Like incase the idea works for you.