Siemens India: Pure-Play Physical AI While software-based Generative AI gets most of the headlines, Physical AI—where AI systems interface with hardware, robotics, edge computing, and industrial digital twins—is where real-world productivity explodes.
Siemens Limited stands as one of the purest structural plays for this macro trend on the NSE.
From a technical perspective, the weekly chart on Siemens demonstrates a classic stair-step consolidation pattern:
Base-Building & Multi-Month Range: The stock spent months digesting its previous leg up inside a clear rectangular consolidation zone (~3,000 – 3,500 INR).
Initial Expansion: A strong breakout pushed price into a fresh consolidation box right beneath structural resistance.
Key Trigger Level: 3,937.2 marks the high-water breakout level. A decisive weekly close above this key resistance confirms the continuation of the broader uptrend.
Consolidation Structure: Price is currently tight inside the upper consolidation band (around 3,500 – 3,935 INR), holding higher lows and setting up potential energy for the next leg higher.
Upside Targets:
Target 1: 5,508.0
Target 2: 6,540.0
Other Key Players in Physical AI for companies at the intersection of heavy industrial infrastructure, physical equipment, and AI/automation, here are the primary listings alongside Siemens.
1. Large-Cap Industrial Heavyweight
#Honeywell
ABB India (#ABB): Right alongside Siemens, ABB is arguably the purest play in industrial robotics, cobots (collaborative robots), and smart factory control systems.
They heavy-lift in Physical AI through their ABB Ability™ platform, using edge AI for robotic motion, predictive maintenance, and energy grids.
Larsen & Toubro (#LT): India's engineering giant is heavily investing in digital twin technology, smart city IoT grids, and autonomous heavy machinery through its L&T Technology Services (LTTS) and core industrial engineering divisions.
2. Niche & Specialised Industrial Automation
Schneider Electric Infrastructure (#SCHNEIDER): Dominates smart grids, energy automation, and physical data center infrastructure.
They use AI algorithms embedded directly into hardware to optimise power distribution in real-time.
Hitachi Energy India (#POWERINDIA): Crucial player in power grid automation and high-voltage physical assets powered by digital twins and AI monitoring.
Schaeffler India (#SCHAEFFLER): A global leader in motion technology, smart bearings, and mechatronics.
They equip industrial machines with sensors that feed edge-AI models to predict wear and control precision movement.
3. Pure-Play System Integrators & Engineering R&D
(ER&D)Tata Elxsi (#TATAELXSI): While an IT/design firm, they specialise in embedded software for physical systems—specifically autonomous driving (ADAS), medical robotics, and smart factory design.
Cyient (#CYIENT): Focuses heavily on geospatial AI, autonomous equipment systems for mining/heavy industry, and smart manufacturing R&D.
4. Micro-Cap / Pure Robotics Integrator
Affordable Robotic & Automation (#ARAPL): A smaller player focused specifically on turnkey warehouse automation, robotic welding lines, and automated car parking systems.
Conclusion:
As industrial automation, factory digitisation, and physical AI adoption accelerate across Indian manufacturing, Siemens remains in prime position fundamental-wise, with the weekly chart coiling right beneath key structural breakout levels.
Disclaimer: For educational and informational purposes only. Not financial advice.
Siemens Limited
No trades
No trades
In-depth trading ideas
Siemens Ltd — Daily Consolidation Breakout SetupSIEMENS Building Strength Near Resistance | Potential 9% Upside Towards ₹4,100
Siemens is displaying a constructive bullish setup on the daily timeframe after a strong impulsive rally from the ₹3,000 zone. Following the sharp advance, the stock entered a healthy consolidation phase and is now attempting to resume its primary uptrend.
Price has reclaimed its short-term moving average and is forming a series of higher lows, indicating that buyers continue to absorb supply on dips.
The stock is currently trading near a key breakout zone, making the next few sessions important for trend continuation.
Key Levels
Current Price: ₹3,760
Immediate Support: ₹3,690
Breakout Resistance: ₹3,913
Target 1: ₹3,913
Target 2: ₹4,099
The immediate resistance lies at ₹3,913. A decisive breakout above this level could pave the way for a move toward ₹4,099, offering nearly 9% upside from current levels. The structure remains constructive while price holds above ₹3,690.
This setup represents a classic continuation pattern where consolidation follows a strong impulsive move, often leading to the next phase of trend expansion.
Disclaimer
This analysis is for educational purposes only and should not be considered financial or investment advice. Stock markets involve risk, and all trading decisions should be based on your own research, risk tolerance, and financial circumstances. Always use proper position sizing and risk management.
SIEMENS | Swing Trading Analysis | 11 Jun 2026📈 Market Structure Update
Siemens has demonstrated a complete trend transition over the last few weeks. After a prolonged decline following the earlier SELL signal, price found support near the lower zone and subsequently generated a fresh BUY signal.
Since the reversal, buyers have maintained control, producing a series of higher highs and higher lows. The stock is now approaching the next resistance zone while maintaining a constructive bullish structure.
Trend Evolution
🔴 Earlier SELL signal captured a significant downside move.
🔴 Extended decline continued toward lower support levels.
🟢 BUY signal generated near the reversal zone.
🟢 Strong recovery followed with sustained bullish momentum.
🟢 Price currently trading above T-1 and approaching T-2.
Key Levels
🟢 Potential T-1: ₹3661.85 (Achieved)
🟢 Potential T-2: ₹3742.30 (Under Test)
🟢 Potential T-3: ₹3822.70
🔴 Potential Risk Level (SL): ₹3501.00
Price Action Observations
✅ Clear trend reversal from support.
✅ Higher-low structure intact.
✅ Bullish trendline remains respected.
✅ Buyers continue defending pullbacks.
✅ Momentum remains positive while price stays above the recent swing lows.
Swing Trading View
• T-1 has already been achieved.
• Sustained trading above T-2 may strengthen the bullish structure further.
• If momentum continues, T-3 becomes the next major objective.
• Any meaningful breakdown below the bullish trendline would require reassessment of the current setup.
Educational Note
This chart highlights an important market principle:
➡️ Trends eventually end.
➡️ Downtrends transition into accumulation.
➡️ Accumulation can evolve into new uptrends.
The objective is not to predict tops or bottoms, but to identify when market structure begins shifting in favor of buyers or sellers.
⚠️ This analysis is shared for educational purposes and market structure discussion only. Future price movements cannot be predicted with certainty.
#Siemens #SwingTrading #PriceAction #TrendFollowing #MarketStructure #TechnicalAnalysis #NSE #RiskManagement #TradingViewIndia #BKQuantDesk
$SIEMENS India The Infrastructure Play Powering India's Growth.India is in the middle of the largest infrastructure buildout in its history. 🏗️
Power grids are being upgraded. Railways are being modernised. Data centres are multiplying. Smart cities are being built from the ground up. 🌍
Siemens India sits at the centre of every single one of those themes simultaneously. 🔥 The monthly chart has pulled back into a clean demand zone at the 0.618 Fibonacci retracement. This is the entry. 📊
Q4 FY2026 results confirmed the momentum. 🏆 Revenue rose 14.6% year over year to ₹4,618 crore, beating consensus estimates. 💰 New orders surged 32.6% to ₹6,731 crore in a single quarter. 🚀
The total order backlog now stands at ₹45,033 crore, up 9% year over year, providing exceptional revenue visibility well into FY2028. 🔒 The book to bill ratio is strong and above 1, meaning the company is winning more orders than it is converting to revenue every quarter. ⚡
Management recommended a final dividend of ₹18 per share for FY2026, reflecting confidence in the underlying business. 💵
The margin story needs context. 🤔 Net profit declined due to higher commodity costs, rupee depreciation, and one-off restructuring charges related to the energy business demerger. ⚠️
However this is transitional pressure, not structural deterioration. The energy demerger makes Siemens India a sharper, more focused technology company going into FY2027 with automation, electrification, smart infrastructure, and mobility as its four clean core segments. 🧠
Management commentary on the Q2 FY2026 earnings call confirmed that data centres and railways are the two fastest growing order intake categories, with the data centre segment contributing meaningfully to the electrification backlog. 🤖
The India macro tailwind is multi year and structural. 📈 India's government has committed to 500 gigawatts of renewable energy capacity by 2030. Railway electrification and high speed corridor expansion is running at full pace. Manufacturing capex from semiconductors, defence, and electronics is accelerating. 🏭
Siemens India has been the technology partner of choice for Indian infrastructure for over 65 years and its global parent provides access to cutting edge automation and digitisation solutions that domestic competitors cannot match. 💼
The 52 week range sits between ₹2,826 and ₹3,930. 📉 13 analysts have Buy ratings. The high analyst price target is ₹4,015. Next earnings are due in late August 2026. The all time high is ₹4,222 reached in October 2024. 🎯
The monthly chart has pulled back from the all time high into a clean demand zone at the 0.618 Fibonacci retracement. ✅ The backlog is record high. The order intake is accelerating. The zone is the entry. 📊
🟢 Buy Zone ~ ₹2,938.95 area (0.618 Fibonacci Monthly)
Monthly demand zone with Fibonacci confluence. Price will retrace from all time highs into a level where long term institutional buyers are expected to step in.
💰 Entry: ₹2,938.95
🛑 Stop: ₹2,685.05 (8.639% below entry)
🎯 Target: ₹5,236.10 (78.2% upside from entry)
📈 Risk/Reward Ratio: 9.05
📅 Next Earnings: August 2026
🔒 Order Backlog: ₹45,033 crore
💵 Final Dividend: ₹18 per share FY2026
🌍 52 Week Range: ₹2,826 to ₹3,930
India is building. ⚡ Siemens is supplying the technology. 🏭 The monthly chart is giving the entry. Let price come to the zone and let the trade do the work. 🚀
⚠️ Not financial advice. Manage your risk.
SIEMENS – Technical & Educational Snapshot📊 SIEMENS – Technical & Educational Snapshot
Ticker: NSE: SIEMENS
Sector: ⚡ Industrial Engineering & Capital Goods
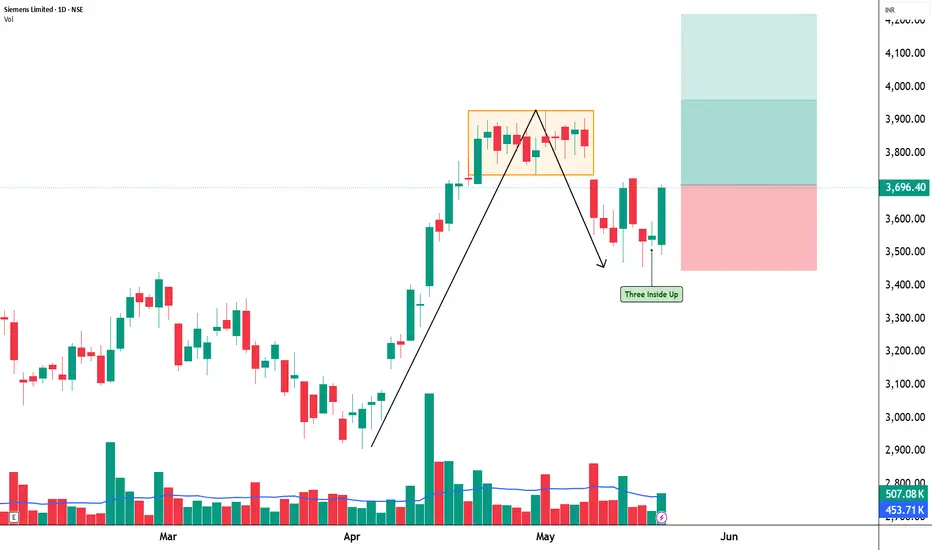
CMP: 3,696.40 ▲ (+4.10% | 20 May 2026)
Learning Rating: ⭐⭐⭐⭐☆ (Recovery Structure Near Supply Zone)
Chart Pattern Observed: 📈 Pullback Stabilisation + Recovery Bounce
Candlestick Pattern Observed: Three Inside Up
📊 Technical Snapshot
SIEMENS is attempting a structured recovery after facing corrective pressure from higher resistance zones. Price has started stabilising above near-term support levels, while the latest bullish candle indicates renewed buying participation after short-term weakness. The “Three Inside Up” formation reflects improving sentiment and suggests that bearish momentum may be slowing gradually. RSI is currently near 54.6, showing recovery from neutral territory without entering overbought conditions yet. MACD remains mildly negative but flattening, indicating that downside momentum is cooling while price attempts to rebuild structure. Bollinger Bands are compressing slightly after volatility expansion, often observed before the next directional move. Sustained acceptance above nearby resistance levels could improve continuation probability in the coming sessions.
📊 Volume Analysis
🔹 Current Volume: ~507K
🔹 Average Volume (20-period): ~453K ✅
📈 Volume is slightly above average, reflecting improving participation during recovery.
💡 Interpretation: Moderate improvement in participation suggests early buying interest, though stronger continuation confirmation may require sustained higher-volume expansion near resistance zones.
🔑 Key Levels – Daily Timeframe
Support Areas: 3558 | 3419 | 3346
Resistance Areas: 3769 | 3843 | 3981
These are zones where price has paused or reacted earlier.
📉 Pullback Zones (Chart-Based Observation)
Healthy Pullback Zone 1: 3630 – 3599
Healthy Pullback Zone 2: 3558 – 3419
Deep Pullback Support Zone: 3346 Area
💡 Pullbacks holding above support clusters may support trend continuation, while rejection near higher supply zones can temporarily slow momentum expansion.
What’s Catching Our Eye: Bullish recovery candle emerging after consolidation.
What to Watch For: Sustained price acceptance above the 3769 resistance zone.
Failure Zone: Sustained weakness below 3558 weakens recovery structure.
Risks to Watch: Supply pressure near upper resistance band.
What to Expect Next: Gradual recovery continuation with volatility expansion possible.
Bullish Case: Strong follow-through buying may support breakout continuation.
Bearish Case: Failure near resistance can trigger renewed range-bound action.
Momentum Case: Momentum improving gradually but still requires confirmation.
STWP Equity Snapshot – SIEMENS
Reference Setup:
Reference: 3,705
Invalidation Level: 3,447
Upside Reference 1: 3,962
Upside Reference 2: 4,219
STWP View:
• Sentiment: Recovery Bullish | Trend: Uptrend (Weakening)
• RSI: 54.66 (Neutral Recovery Zone)
• Volume: Above Average Participation
• Structure: Recovery Attempt Inside Broader Uptrend
Final Outlook
Momentum: Moderate
Trend: Recovery Uptrend
Risk: Moderate
Volume: Moderate
Learning Note: Recovery setups become stronger when bullish reversal structures are supported by improving participation near key resistance zones.
⚠️ Disclaimer:
This analysis is generated strictly for educational and analytical purposes only.
This does NOT constitute investment advice, trading advice, or a recommendation to buy or sell any security or derivative instrument.
Options trading involves substantial risk and may not be suitable for all participants.
Readers are advised to exercise independent judgment and consult a SEBI-registered financial advisor before taking any trading or investment decisions.
STWP assumes no responsibility for any financial loss arising from the use of this analysis.
💬 Recovery continuation or another range-bound pause — what does the structure suggest to you?
🔼 Boost | ✍️ Comment | 🔁 Share with a learner
👉 Follow STWP for clean chart-reading insights
🚀 Stay Calm. Stay Clean. Trade With Patience.
SIEMENS - Range Compression to BreakoutRange Compression to Breakout – How Markets Prepare Before a Big Move
🧭 The Concept
Markets don’t move randomly.
Before any strong trend begins, price usually goes through a phase of compression — where buyers and sellers are in temporary balance.
This phase appears as a range on charts.
📊 What is Range Compression?
Range compression is a phase where:
Price moves between a fixed resistance and support
Volatility reduces over time
Market participants quietly build positions
It may look boring, but this is where smart money prepares
🔍 Key Signs of a Valid Compression
From the chart:
Multiple rejections from resistance → supply zone confirmed
Consistent support holds → demand is active
Gradual formation of higher lows → pressure building
Price spends more time near resistance → absorption happening
This is not sideways — this is structure building
⚡ The Breakout Principle
A breakout becomes meaningful when:
Resistance is tested multiple times
Price does not fall sharply after rejection
Final breakout candle shows range expansion + momentum
This indicates participation, not just price movement
🎯 How to Approach This Setup
Instead of trading inside the range:
Aggressive traders → Look for breakout above resistance
Conservative traders → Wait for retest of breakout zone
The key idea is simple:
👉 Trade where the move starts, not where it pauses
💡 Why Most Traders Miss This
They get bored during consolidation
They overtrade inside the range
They hesitate when breakout actually happens
Markets reward patience during silence, not reaction during noise
📌 Final Understanding
The longer price stays in a range, the stronger the eventual move —
but only when structure supports it.
Compression is not inactivity.
It is preparation for expansion.
⚠️ Disclaimer:
This is for educational purposes only and not a recommendation. Please consult a SEBI-registered advisor before making any trading decisions.
💬 STWP Note
If you start identifying compression correctly,
you will stop chasing moves — and start anticipating them.
SIEMENS LTDSiemens Ltd. (CMP ₹3,388.50, NSE: SIEMENS)
A large‑cap engineering and technology solutions company, incorporated in India in 1957, headquartered in Mumbai. Siemens operates across automation, energy, mobility, and digital industries, with strong promoter backing from Siemens AG (Germany).
Promoter Holding (Dec 2025): Siemens AG — majority stake
FY22–FY26 Snapshot
Revenue Growth: Q1 FY26 global revenue $22.7 Bn vs $18.95 Bn expected (+19.8% YoY). → Good
Net Profit: Q1 FY26 EPS $1.50 vs $1.27 consensus, beating estimates. → Good
Operating Margin: Strong margin expansion across automation and energy divisions. → Good
Equity Capital: Stable, no major dilution. → Good
Dividend Policy: Yield ~0.37%, consistent payouts. → Good
Asset Building: Investments in automation, smart mobility, and digital industries. → Good
Sales: FY26 India revenue run‑rate >₹20,000 Cr annualized. → Good
Expense: Rising input costs, but offset by efficiency gains. → Neutral
EPS: TTM EPS ~₹44.5 (India), reflecting steady profitability. → Good
Institutional Interest & Ownership Trends (Dec 2025)
Promoter Holding: Siemens AG majority stake.
FII Holding: ~9.8%
DII Holding: ~21.4%
Retail & Others: ~10.8%
Strategic Moves & Innovations
Expansion in automation and digital industries.
Investments in smart mobility and energy efficiency projects.
Focus on green hydrogen, renewables, and industrial automation.
Strengthening India operations with new manufacturing facilities.
Cash Flow & Balance Sheet Strength
Strong operating cash flows supported by industrial demand.
Balance sheet conservative, debt levels manageable.
Profit growth supports reinvestment in automation and energy projects.
Risk Factors
Dependence on industrial and infrastructure cycles.
Exposure to global macroeconomic volatility.
Competition from ABB, Schneider, and GE.
Execution risks in large EPC contracts.
Investor Takeaway
Siemens Ltd. has delivered a robust start to FY26, with revenue and profit growth exceeding expectations. Backed by Siemens AG’s global expertise and India’s industrial capex cycle, the company is well‑positioned for long‑term growth. Investors should monitor input cost pressures and global demand cycles, but the outlook remains positive for long‑term holders.
NSE – NIFTY 750 | Siemens Ltd | Structural Assessment | 17 Feb Monthly structural assessment under NIFTY 750 – Structure Census.
Secular advance → regime-shift → sustained impulse structure observed.
Current phase: High-degree consolidation after extended impulse.
Structure intact. Educational study only — not a recommendation.
#NIFTY750 #StructureCensus #MarketStructure #EquityStructure
SIEMENS LTDSiemens Ltd. is a large‑cap industrial and technology company incorporated in 1957. It operates across electrification, automation, and digitalization, serving industries such as energy, mobility, healthcare, and smart infrastructure.
Promoter: Siemens AG (Germany) holds majority stake, ensuring global technology transfer and governance standards.
FY22–FY25 Snapshot
Sales – ₹13,828 Cr → ₹15,137 Cr → ₹17,050 Cr → ₹19,420 Cr
Net Profit – ₹1,195 Cr → ₹1,608 Cr → ₹2,010 Cr → ₹2,420 Cr
Operating Performance – Strong → Very Strong → Excellent → Consistent
Dividend Yield – 0.6% → 0.7% → 0.8% → 0.9%
Equity Capital – ₹71 Cr (constant)
Total Debt – Nil (debt‑free balance sheet)
Fixed Assets – ₹4,210 Cr → ₹4,380 Cr → ₹4,560 Cr → ₹4,720 Cr
EPS – ₹42.1 → ₹56.7 → ₹71.0 → ₹85.4
Institutional Interest & Ownership Trends
Promoter holding (Siemens AG): ~75%.
FIIs/DIIs: Strong institutional interest due to global parentage and technology leadership.
Public float: ~25%, with delivery volumes showing accumulation by long‑term investors.
Strategic Moves & Innovations
Expansion in smart infrastructure and digital grid solutions.
Focus on mobility (rail electrification, signaling) and automation for manufacturing.
Investment in renewable energy integration and EV charging infrastructure.
Digitalization push with IoT, AI, and Industry 4.0 solutions.
Cash Flow & Balance Sheet Strength
Strong operating cash flows supported by order inflows and execution.
Free cash flow positive, reinvested into R&D and capacity expansion.
Debt‑free status enhances resilience and shareholder returns.
Robust order book visibility across infrastructure and industrial projects.
Risk Factors
Dependence on government and infrastructure spending cycles.
Competition from global peers (ABB, GE, Schneider) and domestic players.
Margin sensitivity to raw material costs and project execution delays.
Currency risks due to imports and global exposure.
Investor Takeaway
Siemens Ltd. remains a premium industrial technology play in India, backed by strong parentage, debt‑free balance sheet, and consistent cash generation. With rising institutional interest and focus on digitalization, smart infrastructure, and mobility, it is well‑positioned for sustained growth, though valuations remain rich compared to peers.
SIEMENS – STWP Equity Snapshot📊 SIEMENS – STWP Equity Snapshot
Ticker: NSE: SIEMENS
Sector: ⚙️ Industrial / Capital Goods
CMP: 2,980.80 ▲ (+3.00% | 29 Jan 2026)
Learning Rating: ⭐⭐⭐⭐☆ (Neutral → Early Reversal Bias)
Chart Pattern Observed: 📐 Falling Wedge (Developing)
Candlestick Pattern Observed: Demand-led rebound from lower boundary
📊 Technical Snapshot
SIEMENS is currently forming a falling wedge structure, characterised by lower highs and lower lows converging toward a narrowing range. This structure typically reflects selling pressure losing momentum rather than aggressive distribution. Price has recently responded positively from the lower boundary of the wedge, indicating active demand absorption near support. Momentum indicators are stabilising from neutral-to-weak zones, suggesting that downside momentum is slowing rather than expanding. While price still trades below the upper supply trendline, the compression within the wedge signals a potential volatility expansion phase ahead. Directional confirmation, however, will require acceptance above the wedge resistance, failing which the structure may continue to oscillate within the range.
📊 Volume Analysis
🔹 Current Volume: ~249K
🔹 Average Volume (20-period): ~295K
⚖️ Volume remains slightly below average, consistent with compression phases inside wedge formations.
💡 Interpretation: Falling wedges often mature under declining volume. A volume expansion near the upper boundary would be required to validate any structural resolution. Until then, participation remains selective rather than aggressive.
🔑 Key Levels – Daily Timeframe
Support Areas: 2915 | 2850 | 2813
Resistance Areas: 3017 | 3054 | 3119
These are zones where price has paused or reacted earlier.
What’s Catching Our Eye: Price compression within a falling wedge with demand response at the lower trendline.
What to Watch For: Acceptance above the wedge resistance with volume expansion.
Failure Zone: Sustained trade below the lower wedge boundary.
Risks to Watch: Lack of follow-through volume near resistance.
What to Expect Next: Range-to-breakout resolution as compression matures.
Bullish Case: Wedge breakout with participation may shift structure toward recovery.
Bearish Case: Rejection at upper trendline keeps price range-bound or corrective.
Momentum Case: Early rebound momentum, awaiting confirmation.
📌 Price Reference Framework – Educational View
🔹 Intraday Reference (Short-Term Observation)
Observation Zone: 2,980
Risk Invalidation Area: Below 2,915
Upside Reference Zones: 3,017 → 3,054
Used only to observe short-term price behaviour and participation.
🔹 Swing Reference (Positional | 2–5 Sessions)
Observation Zone: 2,980
Risk Invalidation Area: Below 2,850
Upside Reference Zones: 3,119 → 3,250 (structure-based extension)
Relevant only if price sustains above the wedge structure with acceptance.
🧠 Important Note:
These levels are reference zones derived from structure and past reactions, shared purely for educational interpretation. They are not buy/sell recommendations.
STWP View:
Momentum: Improving | Trend: Neutral | Risk: Moderate | Volume: Normal
Learning Note:
Patterns reveal market behaviour, not outcomes. Confirmation always comes from structure + acceptance + volume, never prediction.
Disclaimer:
This post is for educational and informational purposes only. It is not investment advice or a recommendation. Please consult a SEBI-registered financial advisor before making any trading or investment decisions. STWP is not responsible for actions taken based on this analysis.
💬 Did this help you read the chart better?
🔼 Boost | ✍️ Comment | 🔁 Share with a learner
👉 Follow STWP for clean, structure-based chart reading
🚀 Stay Calm. Stay Clean. Trade With Patience.
SIEMENS - BB Expansion on the downsideCMP 2870
TF: Daily
The chart is breaking down from a consolidation after a BB Expansion. This move down will be quite strong as the consolidation was on for a pretty long period.
Feb 2850 Puts at 90 Rs on Radar
Disclaimer: I am not a SEBI registered Analyst and this is not a trading advise. Views are personal and for educational purpose only. Please consult your Financial Advisor for any investment decisions. Please consider my views only to get a different perspective (FOR or AGAINST your views). Please don't trade FNO based on my views. If you like my analysis and learnt something from it, please give a BOOST. Feel free to express your thoughts and questions in the comments section.
SIEMENS | Buy @LTP or 3280 | SL below 3100 | 1st Target 4300Disclaimer (Please Read Carefully):
This is not investment advice. The stocks shared here are purely for educational and informational purposes. Please do your own research or consult with a financial advisor before making any investment decisions.
******************************************************************************************************************
Stock market में सिर्फ risk ही risk होता है। Market में survive करने का एक ही तरीका है, stop loss को पूरी discipline के साथ accept करना। अपनी capital को protect करने का इससे बेहतर कोई तरीका नहीं है।
मैं जो भी stock यहाँ शेयर करता हूँ, वो या तो मेरी existing holding में होता है, या फिर मैं उसी level पर fresh buying या add on करता हूँ जिसे मैं mention करता हूँ।
मैं हमेशा buy करते समय अपने system में stop loss ज़रूर लगा देता हूँ, और मेरे लिए stop loss, target से भी ज़्यादा important होता है।
Target achieve होने के बाद मैं पहले profit book करता हूँ और फिर retest या fresh breakout का इंतज़ार करता हूँ।
मैं सिर्फ breakouts पर buy करता हूँ, कभी भी support पर नहीं। और मैं resistance पर sell भी नहीं करता।
******************************************************************************************************************
The stock market involves risk, risk, and only risk. To survive in the market, accepting stop-loss with discipline and without hesitation. There is no other way to protect you capital.
Any stock I share is either already part of my existing holding or I take a fresh entry at the same level I mention. I always place the stop-loss in my system at the time of buying, and I give the highest importance to stop-loss more than the target. Once the target is achieved, I usually book profit once and then wait for either a retest or a fresh breakout.
I buy only on breakouts, never on supports. I also do not sell at resistance levels.
That is simply my trading style.
SIEMENS - DOUBLE TOP PATTERN BREAKOUT [ SELL SIDE ]I am not a SEBI-registered investment advisor. The information provided here is for educational and informational purposes only and should not be construed as financial or investment advice. Please do your own research or consult with a SEBI-registered financial advisor before making any investment decisions. Investments in the securities market are subject to market risks. Read all the related documents carefully before investing.
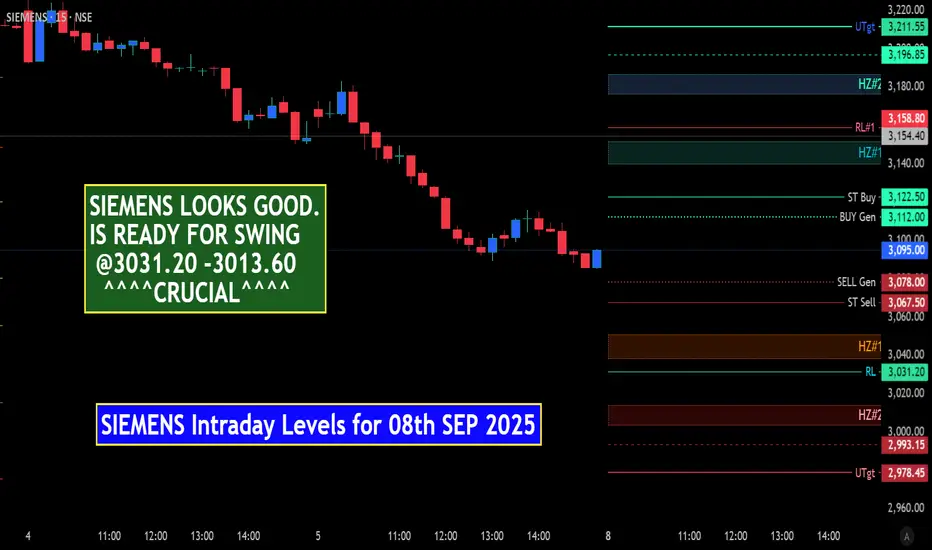
SIEMENS LOOKS GOOD. IS READY FOR SWING SIEMENS LOOKS GOOD. IS READY FOR SWING
^^^^^^^ Plot Levels Using 3 Min, 5 Min Time frame in your Chart for Better Analysis ^^^^^^^
L#1: If the candle crossed & stays above the “Buy Gen”, it is treated / considered as Bullish bias.
L#2: If the candle stays above “Sell Gen” but below “Buy Gen”, it is treated / considered as Sidewise. Aggressive Traders can take Long position near “Sell Gen” either retesting or crossed from Below & vice-versa i.e. can take Short position near “Buy Gen” either retesting or crossed downward from Above.
L#3: If the candle crossed & stays below the “Sell Gen”, it is treated / considered a Bearish bias.
L#4: Possibility / Probability of REVERSAL near RL#1 & UTgt
HZ => Hurdle Zone, Specialty of “HZ#1 & HZ#2” is Sidewise (behaviour in Nature)
Rest Plotted and Mentioned on Chart
Color code Used:
Green =. Positive bias.
Red =. Negative bias.
RED in Between Green means Trend Finder / Momentum Change
/ CYCLE Change and Vice Versa.
Notice One thing: HOW LEVELS are Working.
Use any Momentum Indicator / Oscillator or as you "USED to" to Take entry.
📢 Disclaimer
I am not a SEBI-registered financial adviser.
The information, views, and ideas shared here are purely for educational and informational purposes only. They are not intended as investment advice or a recommendation to buy, sell, or hold any financial instruments.
Please consult with your financial advisor before making any trading or investment decisions
Trading and investing in the stock market involves risk, and you should do your own research and analysis. You are solely responsible for any decisions made based on this research.
SIEMENS LTD Long Term Trend OutlookSIEMENS has maintained a strong multi-year bullish trend since its 2009 low of ₹97.36, consistently respecting a well-anchored ascending channel. After a major rally peaking at ₹4,164.15, price is now reacting to a major supply zone, showing initial signs of distribution.
We should monitor a potential retracement towards the ₹1,400.95 re-accumulation zone, which aligns with the historical demand area and the lower boundary of the long-term trendline. This confluence may provide a high-probability re-entry point for long-term investors seeking continuation exposure.
As long as the macro structure holds above the trendline, the long-term bullish thesis remains intact. A failure below the re-accumulation zone would signal a significant structural shift.
Equity Trade Setup – Siemens Ltd. (NSE: SIEMENS)Trade Type: Breakout + Channel Trend Continuation
🔹 Trade Details
Buy Zone (Entry): ₹2,982.00 – ₹2,987.00
Current LTP: ₹2,970.00
Stoploss (SL): ₹2,887.00 (below recent swing support)
Target (T1): ₹3,150.00
Target %: ~5.46%
Timeframe: 3–5 trading days
R:R Ratio: ~2:1
Confidence: Moderate to High (subject to intraday volume confirmation)
For Education Purposes Only
Review and plan for 27th March 2025Nifty future and banknifty future analysis and intraday plan.
This video is for information/education purpose only. you are 100% responsible for any actions you take by reading/viewing this post.
please consult your financial advisor before taking any action.
----Vinaykumar hiremath, CMT