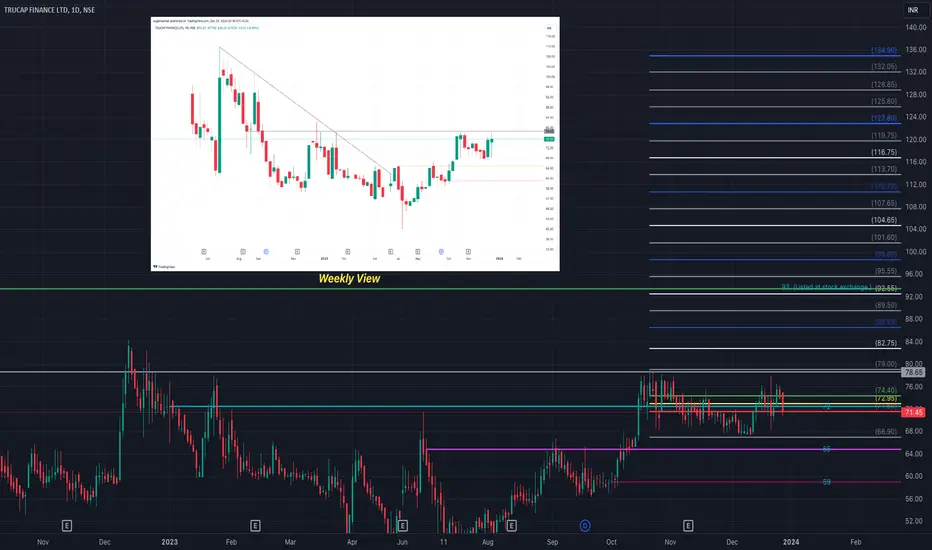
Swing Trade : TRUCAP FINANCEBased on the observation I've shared, Let's break down the chart says :
Trend Line: I noticed that there is a one-year-long trend line that was pierced on the 28th of June. This indicates that the price broke above the trend line, which can be interpreted as a bullish signal.
Higher Highs: I obser
TruCap Finance Limited
No trades
No trades
Compare with TruCap Finance Limited
−9.45 INR
−1.13 B INR
856.43 M INR
40.84 M
Details
Sector
Industry
CEO
Rohanjeet Singh Juneja
Website
Headquarters
Mumbai
Founded
1994
IPO date
Jan 30, 2017
ISIN
INE615R01029
FIGI
BBG00FVT5DM0
Identifiers
ISIN INE615R01029
TruCap Finance Ltd. is a non-banking financial company, which engages in the provision of non-mortgage loan services. The firm operates through the following segments: Fund Based Activities and Advisory Services. Its products include personal, working capital, commercial purchase, and debt consolidation loans. The company was founded on November 9, 1994 and is headquartered in Mumbai, India.
TRUCAP FINANCE Daily timeframe analysis for long term.
NSE:TRU has given strong breakout to trendline and formed LL LH HL structure in weekly timeframe.
Daily timeframe has consolidation over last 4 5 month.
We can see long term move above 79 with can buy more till 66 with SL 64.
Major targets levels are highlighted in blue lines.
TRU Breakout Re-test and BUY MOVETRU is a performance-based stock. On 28th Aug 23, I posted it's breakout. But unfortunately, it could not be a successful breakout. Now, TRU has retested the Support trendline and is bouncing back. There is a minor resistance at 64 because it has been tested multiple times. This time, it is more lik
See all ideas
Summarizing what the indicators are suggesting.
Oscillators
Neutral
SellBuy
Strong sellStrong buy
Strong sellSellNeutralBuyStrong buy
Oscillators
Neutral
SellBuy
Strong sellStrong buy
Strong sellSellNeutralBuyStrong buy
Summary
Neutral
SellBuy
Strong sellStrong buy
Strong sellSellNeutralBuyStrong buy
Summary
Neutral
SellBuy
Strong sellStrong buy
Strong sellSellNeutralBuyStrong buy
Summary
Neutral
SellBuy
Strong sellStrong buy
Strong sellSellNeutralBuyStrong buy
Moving Averages
Neutral
SellBuy
Strong sellStrong buy
Strong sellSellNeutralBuyStrong buy
Moving Averages
Neutral
SellBuy
Strong sellStrong buy
Strong sellSellNeutralBuyStrong buy
Displays a symbol's price movements over previous years to identify recurring trends.
Frequently asked questions
The current price of TRU is 4.88 INR — it hasn't changed in the past 24 hours. Watch TruCap Finance Limited stock price performance more closely on the chart.
Depending on the exchange, the stock ticker may vary. For instance, on NSE exchange TruCap Finance Limited stocks are traded under the ticker TRU.
TRU stock has fallen by −1.21% compared to the previous week, the month change is a −12.07% fall, over the last year TruCap Finance Limited has showed a −70.71% decrease.
TRU stock is 7.63% volatile and has beta coefficient of 1.66. Track TruCap Finance Limited stock price on the chart and check out the list of the most volatile stocks — is TruCap Finance Limited there?
Today TruCap Finance Limited has the market capitalization of 583.61 M, it has decreased by −4.24% over the last week.
Yes, you can track TruCap Finance Limited financials in yearly and quarterly reports right on TradingView.
TRU net income for the last quarter is −191.83 M INR, while the quarter before that showed −424.53 M INR of net income which accounts for 0.00% change. Track more TruCap Finance Limited financial stats to get the full picture.
EBITDA measures a company's operating performance, its growth signifies an improvement in the efficiency of a company. TruCap Finance Limited EBITDA is −503.73 M INR, and current EBITDA margin is −72.90%. See more stats in TruCap Finance Limited financial statements.
Like other stocks, TRU shares are traded on stock exchanges, e.g. Nasdaq, Nyse, Euronext, and the easiest way to buy them is through an online stock broker. To do this, you need to open an account and follow a broker's procedures, then start trading. You can trade TruCap Finance Limited stock right from TradingView charts — choose your broker and connect to your account.
Investing in stocks requires a comprehensive research: you should carefully study all the available data, e.g. company's financials, related news, and its technical analysis. So TruCap Finance Limited technincal analysis shows the sell today, and its 1 week rating is sell. Since market conditions are prone to changes, it's worth looking a bit further into the future — according to the 1 month rating TruCap Finance Limited stock shows the strong sell signal. See more of TruCap Finance Limited technicals for a more comprehensive analysis.
If you're still not sure, try looking for inspiration in our curated watchlists.