Zuari Industries Ltd. engages in development of real estate projects. Its segments include Engineering, Furniture, Real Estate, Sugar, Power, Investment services, Ethanol Plant and Management Services. The company was founded on May 12, 1967 and is headquartered in Gurgaon, India.
Displays a symbol's price movements over previous years to identify recurring trends.
Frequently asked questions
The current price of ZUARIIND is 258.55 INR — it has increased by 0.75% in the past 24 hours. Watch Zuari Industries Limited stock price performance more closely on the chart.
Depending on the exchange, the stock ticker may vary. For instance, on NSE exchange Zuari Industries Limited stocks are traded under the ticker ZUARIIND.
ZUARIIND stock has fallen by −2.41% compared to the previous week, the month change is a −2.69% fall, over the last year Zuari Industries Limited has showed a −4.98% decrease.
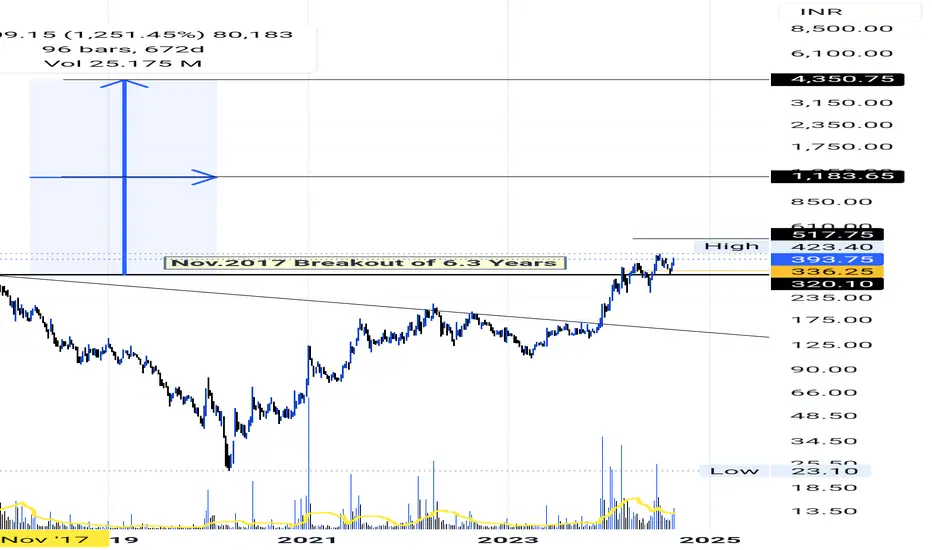
ZUARIIND reached its all-time high on Jul 8, 2024 with the price of 423.40 INR, and its all-time low was 5.30 INR and was reached on Apr 27, 2001. View more price dynamics on ZUARIIND chart. See other stocks reaching their highest and lowest prices.
ZUARIIND stock is 1.44% volatile and has beta coefficient of 0.73. Track Zuari Industries Limited stock price on the chart and check out the list of the most volatile stocks — is Zuari Industries Limited there?
Today Zuari Industries Limited has the market capitalization of 7.74 B, it has decreased by −2.72% over the last week.
ZUARIIND net income for the last quarter is −310.09 M INR, while the quarter before that showed −258.78 M INR of net income which accounts for 0.00% change. Track more Zuari Industries Limited financial stats to get the full picture.
Yes, ZUARIIND dividends are paid annually. The last dividend per share was 1.00 INR. As of today, Dividend Yield (TTM)% is 0.38%. Tracking Zuari Industries Limited dividends might help you take more informed decisions.
EBITDA measures a company's operating performance, its growth signifies an improvement in the efficiency of a company. Zuari Industries Limited EBITDA is 706.82 M INR, and current EBITDA margin is 6.76%. See more stats in Zuari Industries Limited financial statements.
Like other stocks, ZUARIIND shares are traded on stock exchanges, e.g. Nasdaq, Nyse, Euronext, and the easiest way to buy them is through an online stock broker. To do this, you need to open an account and follow a broker's procedures, then start trading. You can trade Zuari Industries Limited stock right from TradingView charts — choose your broker and connect to your account.
Investing in stocks requires a comprehensive research: you should carefully study all the available data, e.g. company's financials, related news, and its technical analysis. So Zuari Industries Limited technincal analysis shows the sell today, and its 1 week rating is neutral. Since market conditions are prone to changes, it's worth looking a bit further into the future — according to the 1 month rating Zuari Industries Limited stock shows the neutral signal. See more of Zuari Industries Limited technicals for a more comprehensive analysis. If you're still not sure, try looking for inspiration in our curated watchlists.
 Long
Long