ABT | Continued stock growth- Timeframe: Weekly
- Trade type: Buy stop order
- Price: 104.18
- Take Profit: Open
- Stop Loss: 99.34 (-4.60 %)
Idea: Long on a breakout above last week's high - bullish momentum continuation.
Entry: Buy stop above last week’s high.
Stop-loss: Below the low of the same candle.
If the weekly candle closes below this level, the trade is invalidated.
Take Profit: Trailing stop following the lows of new weekly candles.
In-depth trading ideas
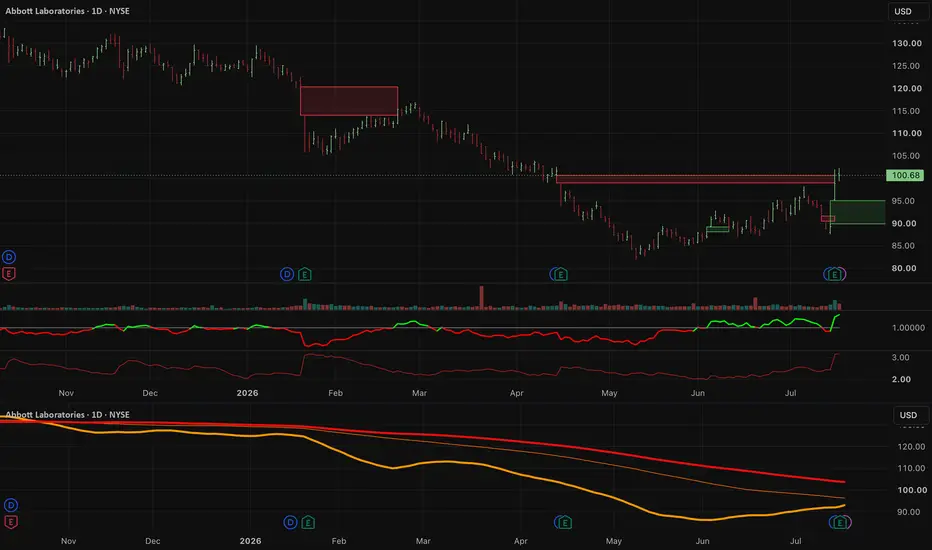
$ABT When the Reason for the Markdown ReversesWhat I'm seeing
ABT peaked ~$137 in mid-2025 and bled 40% to $81.97 a textbook Weinstein Stage 4 markdown while the broader market ran. The week of July 13 changed the tape: a massive bullish engulfing candle on the highest weekly volume in months, reclaiming $100 off the Fib 0% floor.
- Fib 0% ($81.97) tested and rejected hard
- Weekly close $100.68, back above the 200-week EMA zone
- 4H structure flipped: price above Value Area High ($100.67), above anchored VWAP/PoC at $95.10 — recent buyers are in profit, and the high-volume node at $95 is now the floor, not the ceiling
- Weekly RSI recovering from deep oversold
- Insider buying into the lows, zero selling
Why it matters
The markdown was never an earnings problem. Revenue grew every quarter through the decline. The stock was repriced on one thing: the April guidance cut from Exact Sciences dilution, plus litigation and competition fears stacked on top.
On July 16, that exact driver reversed. Q2 beat. Full-year guidance *raised* back to $5.45–$5.60. The market marked the stock down on lowered guidance and just got handed raised guidance at a 23-handle lower price.
When the cause of a Stage 4 gets invalidated, the markdown loses its fuel. That's the setup. Not the confirmation the setup.
The levels
- $94–95 — line in the sand. VWAP + PoC + volume shelf. Bulls must defend this or the reversal thesis dies.
- $103.18 — first real test (Fib 0.382). Acceptance above opens the next leg.
- $112–116 — the decision zone (Fib 0.618 + prior structure). This is where a bounce becomes a trend change or gets sold.
- $137.49 — prior high. Not a target yet. A destination only if the base builds.
What I expect
Default assumption after 40% of markdown: overhead supply exists at every level above. One candle even a monster proves a floor, not a trend.
Two conditions, no predictions:
Weekly acceptance above $103 = first evidence the repricing is done and Stage 1 accumulation is underway. Until then, this is a violent bounce with a good story.
Loss of $94 on a weekly close = the engulfing candle was distribution's gift, not accumulation's start. Back to watchlist.
Strong business + reversed catalyst + reclaimed structure earns real attention. It does not earn full size.
Patience is a position. Not financial advice educational breakdown of my process.
ABT — 60 Seconds Read
1️⃣ What do we see?
ABT has broken sharply above its EMA8, SMA20, SMA50 and SMA100 on strong volume. Relative strength is bullish and improving, and price reached a new three-month high. The move is real, but volatility is extreme and the declining SMA150 remains above price near $103.70.
2️⃣ Thesis
This is an early momentum relaunch inside an unfinished long-term trend repair. The bullish thesis remains valid while ABT holds the $95–$96 breakout and SMA100 area.
3️⃣ What validates the thesis?
A controlled hold above $99–$100, continued RS leadership, stabilization of volatility and acceptance above the SMA150 near $103.70 would confirm that the breakout is becoming a durable trend.
4️⃣ What invalidates the thesis?
A close below $95 with expanding downside volatility invalidates the immediate relaunch. A breakdown below approximately $89–$90 with RS deterioration invalidates the broader structural-repair thesis.
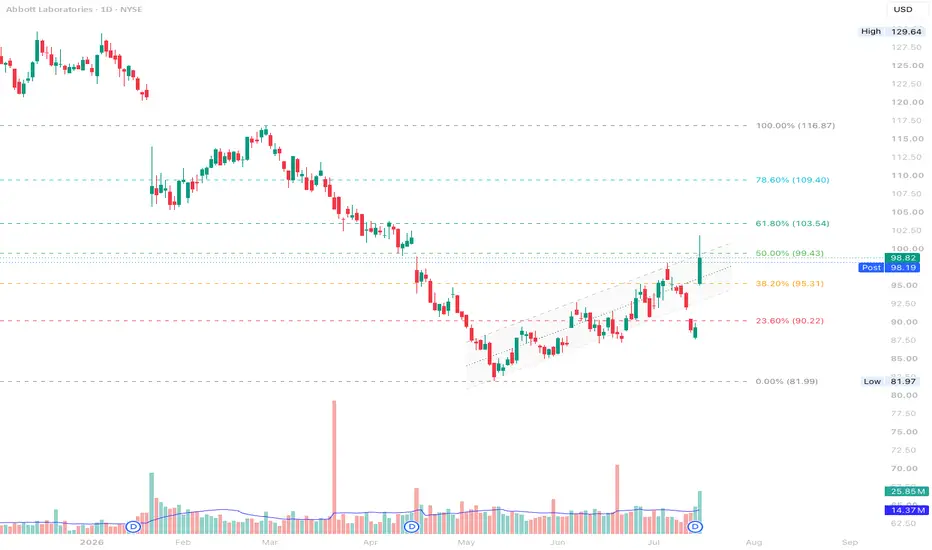
38.2% Fibonacci Retest Buying Opportunity?The stock has shown a strong bounce after finding support near the 23.6% Fibonacci level, with previous support zone. Instead of buying after such a big green candle, Wait for a pullback toward $95.30 (FIB level 61.80). If buyers step in again and the price starts moving higher from there, it could offer a better entry with less risk.
stop loss would be $88.80 just below the FIB level 23.60, if a daily close below this level would make the bullish setup no longer valid.
TP1: $99.40
TP2: $103.50
TP3: $108.60
TP4: $116.90
Wait for the price to come to a good support area and let the market confirm the direction before entering.
Disclaimer:
The information provided is for educational and informational purposes only. It does not constitute financial or investment advice. Trading and investing in stocks involves risk, including the possible loss of capital. Any decisions to buy, sell, or hold securities are the sole responsibility of the reader. Past performance is not indicative of future results. Always do your own research and, if necessary, consult with a licensed financial advisor before making investment decisions.
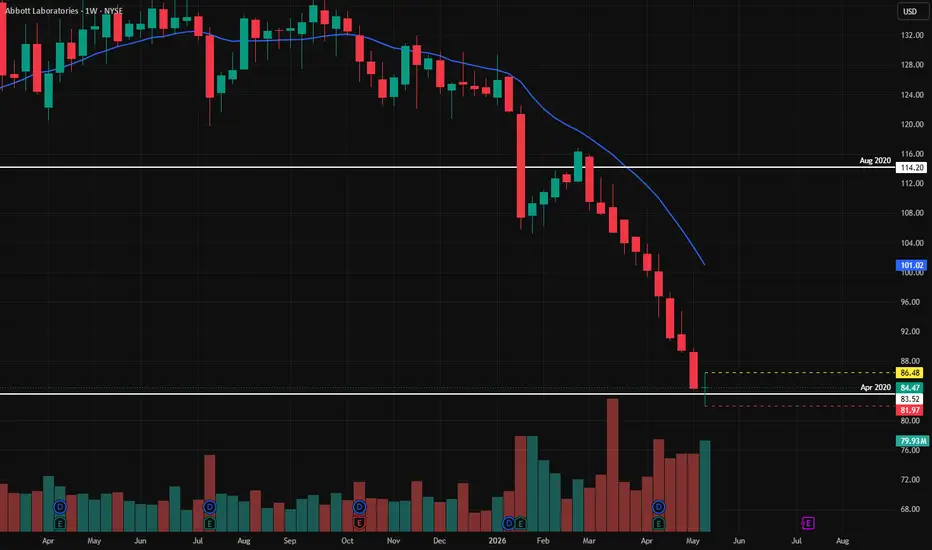
ABT | May, 2026 | The time to go long has come- Timeframe: Weekly
- Trade type: Buy stop order
- Price: 86.48
- Take Profit: Open
- Stop Loss: 81.97 (-5.20 %)
Idea: Long on a breakout above last week's high — bullish momentum continuation.
Entry: Buy stop above last week’s high.
Stop-loss: Below the low of the same candle.
If the weekly candle closes below this level, the trade is invalidated.
Take Profit: Trailing stop following the lows of new weekly candles.
👉 Bitget TradFi | 200+ U.S. stocks | 0% trading fees
Abbott LaboratoriesAbbott Laboratories operates within the healthcare and medical technology sector, with business exposure spanning diagnostics, medical devices, nutrition products, and pharmaceutical solutions. Due to the defensive nature of healthcare demand, the company is often viewed as structurally resilient across varying economic cycles, particularly from a long-term investment perspective.
From a broader market view, the long-term outlook remains constructive given the company’s diversified healthcare positioning and continued relevance within global medical infrastructure. However, despite the favorable structural backdrop, current technical patterns may not yet be providing complete or fully confirmed entry conditions.
At this stage, the stock may be more appropriate for active watchlist monitoring rather than aggressive positioning, as traders and investors may prefer waiting for:
• Clearer bullish continuation structure
• Stronger momentum confirmation
• Higher-quality entry patterns on lower and medium timeframes
• Improved alignment between price action and trend indicators
Patience and disciplined observation may provide a more favorable long-term risk-to-reward profile than premature positioning before technical confirmation fully develops.
Key long-term considerations include:
• Growth in medical-device demand
• Innovation and product pipeline expansion
• Stability of healthcare-sector cash flows
• Defensive positioning during broader economic uncertainty
This analysis is shared for educational and informational purposes only and should not be interpreted as financial advice or a recommendation to buy or sell securities. Independent analysis, portfolio discipline, and risk management remain essential in all market environments.
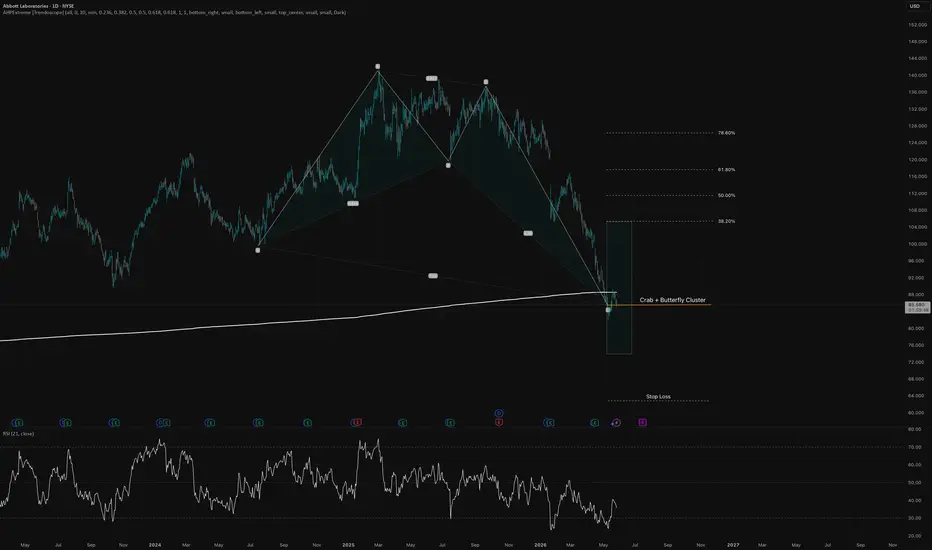
ABT | Bullish Harmonic Reversal Zone at Major Support
Abbott Laboratories is currently trading into a technically important reaction area on the daily chart.
After the strong decline from the 2025 highs, price has reached a potential harmonic completion zone where multiple projections appear to cluster. The area around 85–88 USD is especially relevant, as it aligns with:
* a potential Bullish Crab / Butterfly completion zone
* a visible harmonic pattern cluster
* a long-term rising support / moving average area
* a psychologically important former support region
* an oversold recovery attempt on the RSI
From a structure perspective, ABT has completed a sharp corrective leg into the projected D-zone. This makes the current area interesting for a possible bullish reversal, but confirmation is still important.
The first key signal would be a strong daily reaction from the current zone, ideally followed by a reclaim above the short-term structure around **88–90 USD**. A higher low after that reclaim would strengthen the bullish case.
Bullish Scenario
If price confirms support in the current zone, the first upside objective would be the lower Fibonacci retracement area around **104–106 USD**. Above that, the next relevant targets are located near:
**TP1:** 104–106 USD
**TP2:** 118–120 USD
**TP3:** 136–138 USD
The 0.618 retracement area near 118–120 USD is particularly important, as this would be the first major test of whether the reversal is only a corrective bounce or the beginning of a broader recovery.
Bearish Scenario
The setup loses quality if ABT fails to hold the harmonic completion zone and breaks clearly below the current support area. A decisive daily close below the PRZ would indicate that the pattern is failing and that lower prices could follow.
For now, the chart is not a blind long signal, but it is a technically attractive reversal watchlist setup. The current zone offers a clean risk-defined area, while the upside potential remains significant if buyers step in.
Conclusion:
ABT is trading at a relevant harmonic support cluster. A confirmed bullish reaction from this area could open the door for a recovery toward 105 USD, 120 USD and potentially 137 USD. Confirmation remains key.
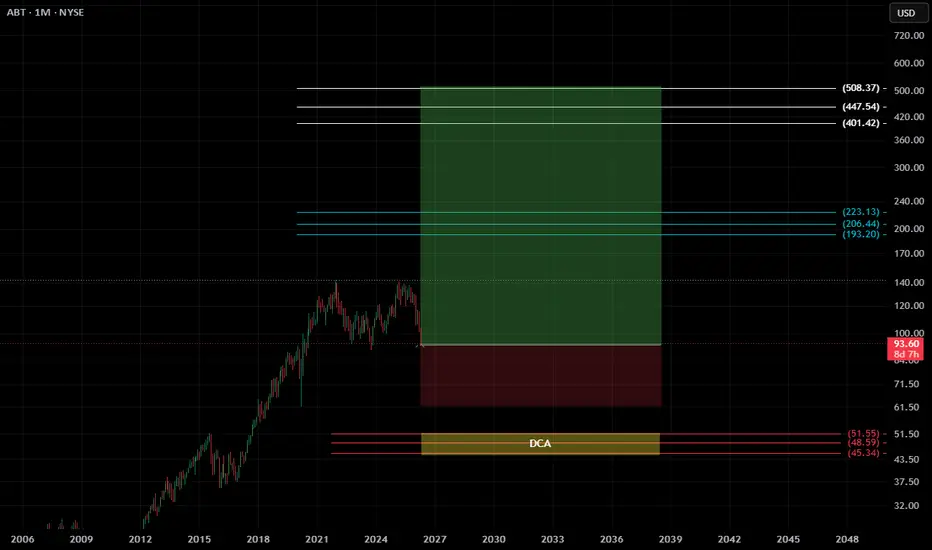
ABT Abbott Labs longSitting on top of a trend line that goes back to 1992 peak. I'm Going long with a stop at 90 right stop been sold off for months now with insiders buying at low 90s price targets are 92 to 160. This company has a wide range of products in the healthcare industry. 3% dividend. Low beta so long term investment for me. Not financial advise just what I'm doing.
$ABT, SetupENTRY : CMP
TP1 : 193.20
TP2 : 223.13
TP3 : 401.42
TP4 : 508.37
SL : If you wish
My SL is never a SELL, just an alarm to stop adding money and wait for better dca
Follow, Boost, Thank You !
⚠️ Financial Disclaimer:
This post is not financial advice. I am not your financial advisor, your life coach, or your legally responsible adult.
Always do your own research and never trade based solely on internet comedy.
Ford Robert B Insider BUY ABT P/E (TTM) ~28.3x - 28.9x HIGH ⚠️. Despite the price drop, the market values it highly.
Forward P/E ~18.5x - 19.1x GOOD ✅. It is at a 5-year low on this metric.
Free Cash Flow ~$6.5 billion EXCELLENT ✅. Cash generating machine.
ROE ~17.6% EXCELLENT ✅. Meets your 14.5% criterion.
Debt/Equity ~0.23 (23%) PERFECT ✅. Extremely low debt.
PEG Ratio ~2.01 HIGH ⚠️. Growth is expensive relative to the current price.
Dividend Yield ~2.35% EXCELLENT ✅. Dividend aristocrat (50+ years of growth).
Cash on Hand ~$7.7 billion EXCELLENT ✅. Huge liquidity.
FCF Margin ~20.8% HIGH ✅. Converts 1/5 of revenue into pure cash.
Quick Ratio ~1.24 GOOD ✅. Healthy liquidity.
Inst. Ownership ~76% HIGH ✅. Great trust from funds.
Current Ratio ~1.70 GOOD ✅. Stable balance sheet.
Analyst DCF $92.08 - $93.05 OVERVALUED ⚠️. Current price ($106) is above DCF value.
Wall St Target $136.32 Potential growth of ~28% from current levels.
Gross Margin ~57.1% GOOD ✅
Sales Growth ~4.4%
Altman Z-Score ~3.53 SUPER SAFE ✅. Financially unshakable.
and on January 23, 2026, immediately after the stock crashed after the report, Abbott CEO and Chairman Robert B. Ford himself aggressively entered the market.
Here are the details of this purchase that confirm your observation:
Insider Purchase Details (Robert B. Ford)
Date of Purchase: January 23, 2026
Number of Shares Purchased: 18,800 shares.
Average Price: ~$107.13 per share.
Total Amount: $2,013,966.
After the Purchase: He now owns directly and indirectly (through the Ford Family Trust) over 469,500 shares, worth over $50 million.
Why is this critical to you as an investor?
First Purchase of the Year: This is Ford's first open market purchase in quite some time. CEOs usually get stock as bonuses, but when they take out $2 million of their own cash to buy into the market, it means only one thing: they believe the stock is grossly undervalued.
"Put your money where your mouth is": Ford made this purchase just as Wall Street analysts were lowering their targets due to weak sales in the Nutrition segment. He literally bet against analysts' pessimism.
Historical success: Statistics show that after insider purchases by Robert Ford, ABT shares usually have an average return of about 15.4% over the next 3 months.
On the long-term (10-year) supportThe price corrects significantly following the quarterly earnings report and drops until it reaches the long-term support highlighted in blue, where the price halts its decline.
A rebound from this support level is very likely, as it has been providing support for the price for the past 10 years.
Earnings Tension Trade: Why AI Is Betting on ABT UpsidABT Earnings Signal | 2026-01-21
Direction: BUY CALLS
Strike: $117.00
Expiry: Jan 23, 2026
Entry: ~$4.85
Target: $6.50 (+34%)
Extended Target: $7.50 (+55%)
Stop Loss: $3.88 (-20%)
🧠 Why This Trade
Katy AI Forecast: Bullish price path toward $123+ despite neutral label
Technical Setup: Deeply oversold stochastic (8.2) → bounce potential
News Catalyst: CE Mark approval for new product (positive sentiment)
Options Flow: Slight call bias (PCR 0.83), unusual activity at $130 calls
⚠️ Key Risks
Low overall confidence (55%)
Weak earnings beat history (25%)
High IV → possible post-earnings IV crush
Light volume = limited market conviction
💡 Position Management
Use small size only (≤2%)
Tight stop required
Consider quick profit-taking if target hits pre-expiry
🚨 IMPORTANT NOTES
Low conviction due to Katy AI's 50% confidence and conflicting technical signals.
Earnings beat history is poor (25%), increasing risk of miss.
High IV in options may lead to premium decay post-earnings; consider exiting before expiry.
Monitor volume for confirmation—current light volume indicates weak market participation.
ABT long ideaABT is the stock ticker for Abbott Laboratories, a global healthcare company that develops and sells a wide range of health products. Its business is divided into four main segments: Established Pharmaceutical Products, Diagnostic Products, Nutritional Products, and Medical Devices. The company's products include generic pharmaceuticals, diagnostic systems, infant and adult nutrition products, and medical devices for cardiovascular and diabetes care, as well as neuromodulation and vascular products.
ABT (Abbott Laboratories) - Long SetupTrading Idea: NYSE:ABT (Abbott Laboratories) - Long Setup
🎯 Idea: LONG
⏰ Timeframe: Daily
📊 Pattern: Bullish Breakout from Consolidation
Fundamental Context:
Fundamental Score: 5/9 (Neutral).
Business: Global Healthcare Leader (Medical Devices, Diagnostics, Nutrition).
Growth: Weak Revenue + Strong Net Income Growth YoY.
Balance Sheet: Excellent (Debt Score: 10/10). Very strong financial health.
Valuation: Fairly Valued on P/E; Overvalued on P/B and P/S.
Technical Setup:
Trend (D1): Bullish ✅
Catalyst: Recent RSI2 Connors Buy Signal (confirmed oversold bounce).
Entry: $135.70 (Break above consolidation resistance).
Stop Loss (SL): $130.00 (Below key support and the 50-period SMA).
Take Profit (TP): $148.00 (Previous resistance target).
Momentum: RSI in bullish territory, MACD showing positive momentum.
Risk Management:
Risk/Reward (R:R): 1:2.2
Position size based on the risk between entry and stop.
Summary: A breakout play on a high-quality healthcare giant with a pristine balance sheet and strong earnings growth, targeting a move to the next resistance level.
⚠️ Disclaimer: Not Financial Advice
This analysis is for educational and informational purposes only. It is NOT a recommendation to buy or sell any security.
Conduct your own research (DYOR) before making any investment decisions.
You are solely responsible for your own trades and investments.
Past performance is never indicative of future results.
Trading involves significant risk of loss and is not suitable for all investors.
#TradingView #ABT #Long #Healthcare #Medical #Dividend #RSI2 #Connors #Breakout #TradingSetup
ABT - Possible break out Hello everyone,
This is the last one for today.
ABT Abbott Laboratories .
What they do?
Abbott Laboratories offers pharmaceutical, diagnostic, and nutritional products, as well as medical devices to treat cardiovascular disease and diabetes care products. Operating internationally, the company was founded in 1888 and has its headquarters in Chicago, Illinois.
Financial Infos:
Market Cap : 236.77 B
Revenue : 43.11 B
EPS : 7.9964
P/E Ratio : 17.01
Dividend Yield : %1.71
Technical Part:
There is a possible break out the Down trend to up and we could expect to continue trend to Up. Volume data is also supports this trend. If it could achive to stay above 134.90 - 135.00 then i would expect to go up and hit 143.50 - 144.00.
For other support and resistance levels you can watch the FIB levels that i draw in Chart.
Short term i beleive you can make some small gain from ABT. I have already added ABT to my watch list for next week ;)
This is just my thinking and it is not invesment suggestion , please do not make any decision with my anaylsis.
Have a lovely Weekend to all.
ABT Trade Setup: Breakout Play with 10.6% Upside🏥 Abbott Labs (ABT) Trade Alert
Positioning in this healthcare giant as it breaks out from consolidation - here's the strategic play:
📌 Trade Levels
▶ Entry: $133.12 (confirmed above SMA 50)
🎯 Target: $147.21 (+10.6%)
🛑 Stop Loss: $126.00 (-5.3% risk)
⚖️ Risk/Reward: 1:2
Why ABT Now?
✅ Fundamental Strength:
Net Income Growth: "Strong growth" (+134% YoY in last report)
Dividend Aristocrat: 50+ years of dividend growth (current yield 1.9%)
Debt Health: Score 10/10 (Debt/Equity 0.26, Interest Coverage 15x)
✅ Technical Triggers:
Bullish crossover (50D > 200D MA)
RSI 55 - neutral with room to run
Volume surge on $132 breakout
Measured move target aligns with $147 zone
📊 Trade Management:
Entry: $133.12 (market price)
Scale In: Add at $130 if tested
Adjust Stop: Move to breakeven at $136
Partial Profit: Take 50% at $140
⚠️ Key Risks:
Sector rotation out of healthcare
FDA delays on new devices
Strong resistance at $138 (prior highs)
ABT dominates 4 growth segments:
Medical Devices (44% revenue)
Diagnostics (32%)
Nutrition (12%)
Generics (12%)
Recent FDA approval for Freestyle Libre 3 drives upside.
Trade active until next earnings (Oct 18). Let me know your take! 👇
#HealthcareStocks #DividendInvesting #BreakoutTrade