C3.ai, Inc.
No trades
No trades
In-depth trading ideas
Potential outside week and bullish potential for AIEntry conditions:
(i) higher share price for NYSE:AI above the level of the potential outside week noted on 2nd October (i.e.: above the level of $11.38).
Stop loss for the trade would be:
(i) below the low of the outside week on 28th September (i.e.: below $10.20), should the trade activate.
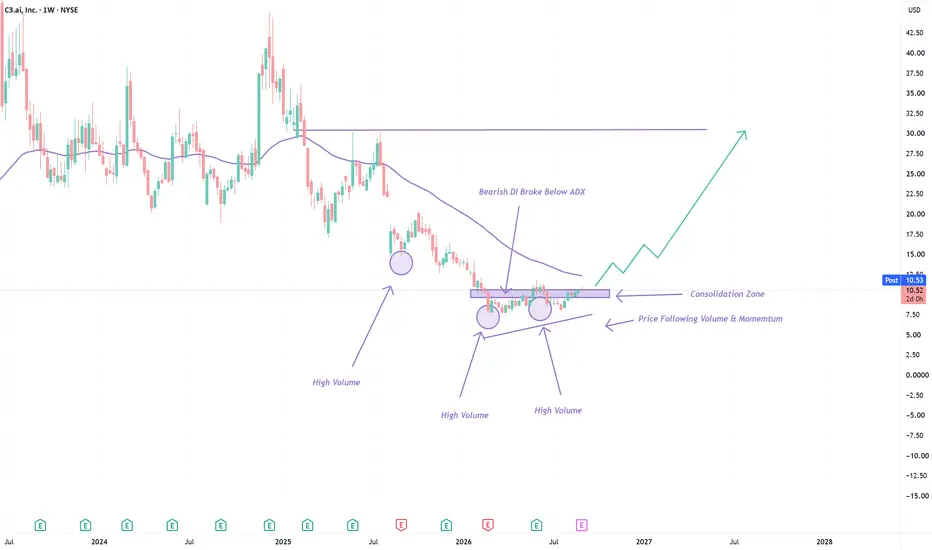
High-Vol Base + Improving Price Structure, Is Accumulation Dev?Good Afternoon,
Hope all is well. Here is my TA on AI.
What I’m Seeing
Looking at C3.ai on the weekly chart, the larger trend is still clearly bearish, but the structure around $8–$11 is beginning to look very different from the decline that brought price here.
After trading above $40 in late 2024, C3.ai experienced a prolonged markdown that eventually pushed the stock below $10.
What interests me now is that selling pressure has repeatedly increased around the lows, yet price has stopped
Took profits on AI and QBTS! Summary on todays price action!In this video I do a quick summary on todays price action on the SPCFD:SPX and on the $NASDAQ:QQQ. I also go over two charts I decided to take profits on that we were studying. NYSE:AI and NASDAQ:QBTS Fantastic gain folks. We just entered those positions and got what we wanted so I'm out. Nothing said or done in this video is financial advice. Nice to start off the week with a profit. Lets still navigate our other trades were studying that we also just entered as I continue to give updates
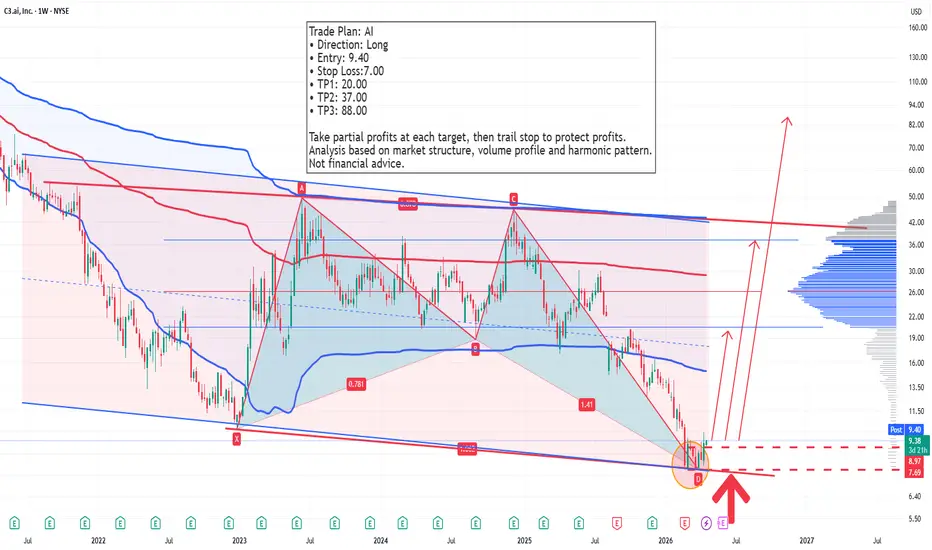
C3.ai — Falling Wedge Breakout SetupC3.ai is showing a long-term falling wedge structure on the weekly chart.
Since the major post-IPO decline, price has continued to compress inside a broad descending wedge, with lower highs and lower lows tightening into the current range. After repeated downside pressure, price is now attempting to reclaim from the lower portion of the structure and push back toward the upper wedge resistance.
The main area I’m watching is the descending resistance line. A clean weekly breakout above that lev
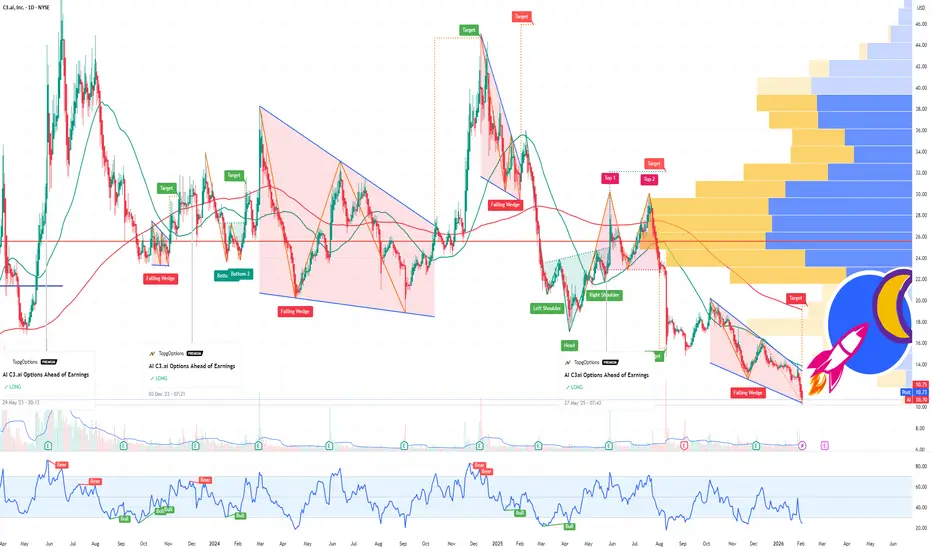
AI C3ai Options Ahead of EarningsAnalyzing the options chain and the chart patterns of AI C3ai prior to the earnings report this week,
I would consider purchasing the 12usd strike price Calls with
an expiration date of 2026-6-5,
for a premium of approximately $0.38.
If these options prove to be profitable prior to the earnings release, I would sell at least half of them.
C3 Code Platform a New Catalyst!AI is positioning its newly launched C3 Code platform as a potentially important catalyst for the next phase of enterprise artificial intelligence adoption, particularly as companies move beyond small-scale AI experiments and begin implementing AI systems across entire organizations. The company believes the platform could help address one of the biggest challenges facing enterprises today: transforming AI pilot projects into fully operational, production-scale deployments that generate measurab
AI – Left for Dead… or Loading Zone?This is what forgotten stocks look like.
Heavy downtrend.
Lower highs.
Retail already gone.
But now…
→ selling pressure slowing
→ price holding a base
→ small higher lows forming
That’s how reversals start.
Key levels:
$9 zone = current base
$18 = first real test
$30 = trend shift confirmation
Important:
Still below EMA 200 → trend is NOT bullish yet.
Game plan:
Aggressive: accumulate in this zone
Conservative: wait for reclaim of $14–$18
Why it’s interesting:
AI narrative (moves when
C3.ai Strategic Analysis: Enterprise AI and Market ShiftsC3.ai remains a lightning rod for market volatility and investor debate. Recent data highlights an "options anomaly," suggesting a potential short squeeze. Traders are monitoring high short interest against a backdrop of surging enterprise demand. This analysis explores the thirteen domains driving C3.ai’s current market fluctuations.
The Options Anomaly and Market Volatility
Technical indicators currently signal a significant shift in sentiment. C3.ai faces high short interest, yet call opti
C3.ai (AI): Buy, Sell, or Hold Following Q4 Earnings?The past six months have been exceptionally challenging for C3.ai (NYSE: AI), a provider of enterprise artificial intelligence software. The stock has declined by 41% over this period, currently trading at $9.21 per share—a sharp pullback that has left many shareholders reassessing their positions. The downturn was precipitated in part by the company’s softer-than-expected quarterly results, prompting investors to weigh whether the current valuation represents a potential buying opportunity or a
Wedbush’s Bullish Paradox on C3.AI!In the world of financial analysis, a company reporting a weak quarter and guiding lower typically triggers a wave of downgrades and sharply reduced valuations. However, the reaction from Wedbush Securities to C3.ai’s (NYSE: AI) latest earnings report on February 26, 2026, presented a more nuanced picture. While the firm acknowledged the immediate financial disappointment by slashing its price target on the stock from $20.00 to $15.00, it simultaneously made the counterintuitive decision to main
AI 2026 Trackerlong-term charts 1W/1D, Macd for both charts, momentum is bearish but bearish momentum trend is shortening and getting weaker bulls momentum indicated more activity on bulls side.
candle situation on bears side confirm slowed momentum and less activity creating a weak bearish trend.
Short-term charts 4h/1h/15m, suggests the markets longterm charts 1w/1d are playing catch up so expect to see lower timeframes take dips to transcend higher from lower positions . shorter timeframes macd all suggest
20% Plunge – Turnaround Trouble or Terminal Decline?C3.ai (AI): A Deep Dive into the 20% Plunge – Turnaround Trouble or Terminal Decline?
C3.ai (NYSE:AI), the enterprise artificial intelligence software firm, experienced a seismic shock to its stock price, plummeting more than 20% in a single trading session. The dramatic sell-off was triggered by a disastrous fourth-quarter earnings report that not only missed every key metric but also painted a bleak picture of the company's immediate future. While the steep decline might tempt some investors t
AI C3ai Imminent Takeover by Automation Anywhere? Rumors!C3 ai, once a darling of the enterprise AI space, has faced headwinds since its 2020 IPO. Founded by industry veteran Thomas Siebel, the company specializes in AI applications for industries like manufacturing, energy, and defense, offering tools for predictive maintenance, supply chain optimization, and more.
However, revenue growth has decelerated sharply—fiscal 2025 saw $389 million in sales (up 25% YoY), but early 2026 figures show a 20% drop in the first half, prompting the withdrawal of
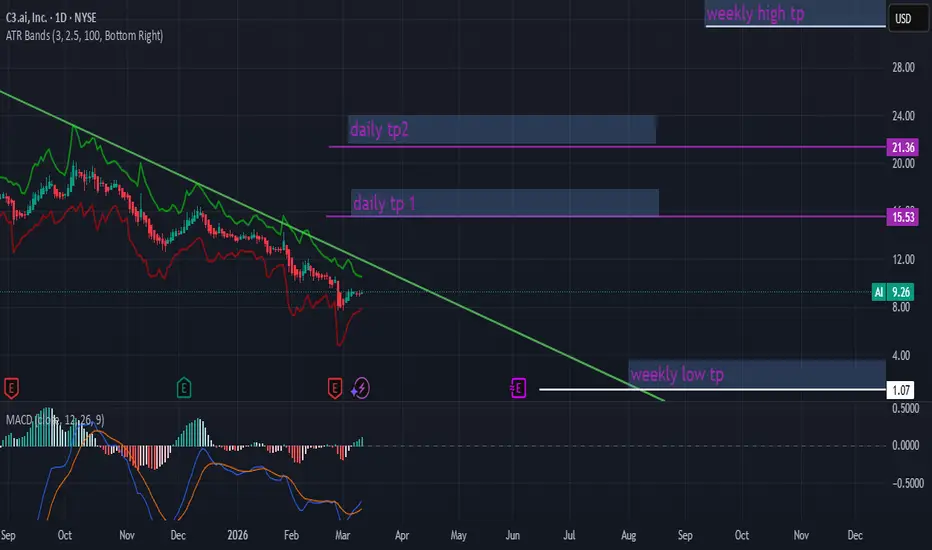
Again C3.AI - 90 % potential profit - TARGET 24 USDOn the daily chart, the stock remains in a long-term downtrend; however, downward momentum has clearly weakened in recent weeks. Price has stabilized around the 12–13 USD area, which previously acted as a demand zone. This price behavior suggests a possible accumulation phase following a prolonged decline.
Volatility has compressed significantly near the lows, a condition that often precedes a strong directional move. The price has also started to interact more closely with shorter-term moving
I Found a Pattern in $AI That Shouldn’t Exist. 45–46 (late 2026)I’ve been studying NYSE:AI ’s entire 2025 price cycle, and what I found is pretty interesting.
The entire downtrend wasn’t random, it behaved like a damped harmonic oscillator.
First drop: –28
Second drop: –15
Third drop: –7
Each decline was almost exactly 50% of the previous one.
Same thing on the rallies:
First up-leg: +13
Second: +5.4
That’s a 40% decay ratio.
Time cycles also shrank consistently:
105 days → 32 days → projected 10 days
Classic volatility compression.
So m