VWAP Volume Profile + Fibonacci Confluence: The ALB $155 ZoneOverview :
Following a 15-month advance from $50 (Apr 2025) to $220 (May 2026), price retraced to approximately $115 — near the 0.618 Fibonacci level. With price currently around $131, the question becomes: how might the next phase unfold?
Key Observations:
🔹 Coinciding levels at $155 The -VWAP (derived from a 3-month window, Apr–Jul 2026) converges at roughly $155 — the same area as the 0.382 Fibonacci retracement of the full 15-month swing. Two distinct calculations across different timeframes pointing toward a similar zone.
🔹 Volume structure remains tilted
-VWAP volume: ~1.38M (selling phases)
+VWAP volume: ~1M (buying phases)
Ratio: Approximately 1.4:1 — suggesting distribution may still outweigh accumulation
Possible Scenarios:
If price reaches $155 and shows signs of weakness, it could potentially face rejection given the dual confluence and prevailing volume structure. Alternatively, a close above $155 accompanied by expanding +VWAP volume might suggest a shift toward bullish conditions.
Should price hold or stabilize near $115, that could represent a support bounce. A break below, however, would weaken the long-term structure further.
For educational purposes only. Not financial advice.
In-depth trading ideas
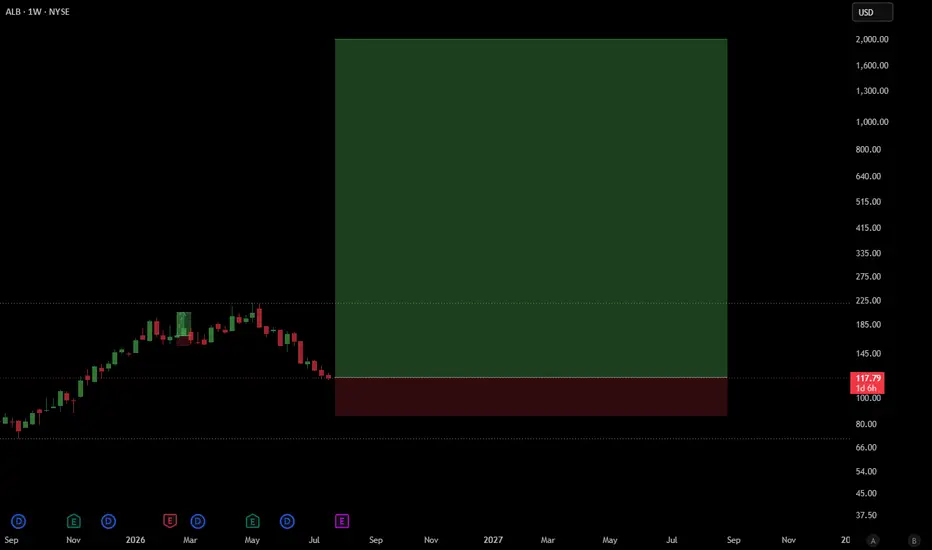
$ALB , MONSTER MOVE INCOMING , IdeaENTRY : CMP
TP1 : **
TP2 : **
TP3 : **
TP4 : **
TP5 : **
SL : If you wish
** FULL SETUP AVAILABLE**
My SL is never a SELL, just an alarm to stop adding money and wait for better dca
Follow, Boost, Join, Thank You !
⚠️ Financial Disclaimer:
This post is not financial advice. I am not your financial advisor, your life coach, or your legally responsible adult.
Always do your own research and never trade based solely on internet comedy
ALB | May, 2026 | Continued stock growth- Timeframe: Weekly
- Trade type: Buy stop order
- Price: 180.26
- Take Profit: Open
- Stop Loss: 171.00 (-5.10 %)
Idea: Long on a breakout above last week's high — bullish momentum continuation.
Entry: Buy stop above last week’s high.
Stop-loss: Below the low of the same candle.
If the weekly candle closes below this level, the trade is invalidated.
Take Profit: Trailing stop following the lows of new weekly candles.
👉 Pionex | 200+ U.S. stock tokens | xStocks
Feel free to like and share your thoughts in the comments! ❤️
ALB Lithium Momentum Builds as $200 Level HoldsCurrent Price: 203.52 (Analysis was generated on Monday Morning)
Direction: LONG
Confidence level: 48%(Limited direct trader snippets available, but X sentiment shows bullish bias with zero bearish signals and positive media coverage around lithium and rare‑earth markets supporting upside potential.)
Targets
Target 1: 207.60
Target 2: 211.65
Stop Levels
Stop 1: 199.45
Stop 2: 195.40
Key Insights:
Here's what's driving this setup. Albemarle sits right in the center of the lithium supply chain, supplying lithium compounds used in EV batteries, grid storage, and electronics. That means ALB tends to move with the broader battery metals narrative, and lately that story has started heating up again. News around rare‑earth and battery supply tightening—especially linked to China oversight of production—has been lifting sentiment across the materials sector.
What caught my attention is the tone of market coverage around the company. Media sentiment tracking shows overwhelmingly positive mentions with virtually no negative coverage recently. That kind of skew often appears before capital flows back into a sector, especially when investors start rotating back into EV supply chain names.
Social sentiment adds another layer. The trading community on X shows more bullish positioning than bearish commentary. The volume isn’t massive, but the directional bias is clear: traders discussing ALB are mostly looking for upside continuation after the stock reclaimed the $200 area.
Recent Performance:
You can see this dynamic in the price action. ALB has climbed significantly from the deep lithium downturn lows seen previously in the sector. Now the stock is trading just above the psychologically important $200 level. When a stock stabilizes above a round number like this, traders often treat it as a momentum pivot. Holding above that level tends to invite short‑term buyers targeting the next resistance band.
Volatility remains fairly high, which is typical for lithium equities. That’s why short‑term levels matter more than long‑term narratives for this week’s trade.
Expert Analysis:
Traders following battery‑materials stocks are mostly watching momentum rather than deep technical patterns right now. With limited direct technical levels mentioned in trader discussions, the focus shifts to behavioral price zones.
Several traders tracking lithium names point out that reclaiming and holding the $200 area in ALB signals renewed buying interest. When that happens, short‑term traders often aim for quick continuation moves of roughly 2–4% during the same week. That’s where the $207–$211 zone becomes interesting.
On the downside, a slip back below $200 would signal the breakout attempt failed. That’s why the stop levels sit just under that psychological threshold.
News Impact:
The real story here is the broader rare‑earth and lithium narrative gaining traction again. Reports that China may tighten oversight on rare‑earth production sparked renewed attention across critical mineral stocks. Albemarle often benefits when supply‑chain concerns resurface because it’s one of the largest Western lithium producers.
Recent earnings releases in early May 2026 also keep the company in the spotlight. Even when earnings reactions are mixed, they often increase trading volume and create short‑term directional opportunities.
Trading Recommendation:
Here's my take. With ALB holding above $200 and sentiment leaning positive, the short‑term setup favors a LONG trade this week. I’m watching for continuation toward $207.60 first, with a potential push to $211.65 if sector momentum strengthens.
Because the signal strength is moderate and data sources are limited, risk control matters. A drop below $199.45 would weaken the bullish case, while $195.40 marks the level where I’d fully exit the trade.
Position sizing should stay moderate given the lower confidence signal, but if lithium sentiment continues improving, ALB could deliver a quick upside move this week.
Albemarle Stock Swings
Primary Scenario
The stock appears to be in a larger downward move, which is expected to continue into our blue Long-Term Entry Range ($105.30–$80.73).
Alternative Scenario
A delay in the correction would occur if the price soon rises above resistance at $206. In that case, the stock could move up into our red Alternative Target Zone ($225.63–$273.53) before the downward move resumes (probability: 25%).
Albemarle Has Pulled BackAlbemarle had a strong rally in late 2025 and early 2026. Now, after a pullback, some traders may see further upside in the lithium producer.
The first pattern on today’s chart is the bullish candle on January 6 after Jefferies raised its price target and said the spread of robotics will boost demand. ALB has stayed above that level since. Has it become new support?
Second, prices have also remained above the rising 50-day simple moving average (SMA). That may suggest its intermediate-term uptrend remains in effect.
Third, the 8-day exponential moving average (EMA) is crossing above its 21-day EMA. That may reflect a bullish short-term trend.
Finally, Wilder’s Relative Strength Index (RSI) has turned higher and is back above its 14-day SMA. A similar crossover in November marked the start of a move to the upside.
TradeStation has, for decades, advanced the trading industry, providing access to stocks, options and futures. If you're born to trade, we could be for you. Learn more here about TradingView’s Broker of the Year!
Past performance, whether actual or indicated by historical tests of strategies, is no guarantee of future performance or success. There is a possibility that you may sustain a loss equal to or greater than your entire investment regardless of which asset class you trade (equities, options or futures); therefore, you should not invest or risk money that you cannot afford to lose. Online trading is not suitable for all investors. View the document titled Characteristics and Risks of Standardized Options at www.TradeStation.com . Before trading any asset class, customers must read the relevant risk disclosure statements on www.TradeStation.com . System access and trade placement and execution may be delayed or fail due to market volatility and volume, quote delays, system and software errors, Internet traffic, outages and other factors.
Securities and futures trading is offered to self-directed customers by TradeStation Securities, Inc., a broker-dealer registered with the Securities and Exchange Commission and a futures commission merchant licensed with the Commodity Futures Trading Commission). TradeStation Securities is a member of the Financial Industry Regulatory Authority, the National Futures Association, and a number of exchanges.
TradeStation Securities, Inc. and TradeStation Technologies, Inc. are each wholly owned subsidiaries of TradeStation Group, Inc., both operating, and providing products and services, under the TradeStation brand and trademark. When applying for, or purchasing, accounts, subscriptions, products and services, it is important that you know which company you will be dealing with. Visit www.TradeStation.com for further important information explaining what this means.
Albemarle breaks $163 as traders position for a push higher thiCurrent Price: 163.37 (Analysis was generated on Monday Morning)
Direction: LONG
Confidence level: 66%(Several professional traders point to buyable dips above $160 and upside toward the high $160s, while X sentiment supports continuation despite limited volume)
Targets
Target 1: 168.00
Target 2: 172.50
Stop Levels
Stop 1: 160.00
Stop 2: 158.00
Key Insights:
Here’s what’s driving this idea. Multiple traders are watching ALB hold above its 50‑day and 200‑day moving averages, both sitting well below the current price. That structure tells me buyers are still in control. What stands out is how often the $168–$170 zone comes up in trader discussions. It’s viewed as the next real test, and a clean push into that area could bring momentum traders back in quickly.
On the sentiment side, X is leaning positive despite low tweet volume. Traders there keep pointing to falling short interest and call‑heavy options positioning. That combination doesn’t guarantee upside, but it does reduce near‑term selling pressure, which supports a long bias for the next few sessions.
Recent Performance:
This all showed up in the tape. ALB has rebounded strongly over the past three months and is trading near $163 after a sharp daily move. Volume hasn’t exploded yet, but the stock is holding gains instead of fading, which suggests sellers aren’t very aggressive at these levels.
Expert Analysis:
Several professional traders I track highlighted RSI sitting in the low‑60s, a zone that often supports continuation rather than reversals. MACD is still below zero, but it’s tightening, which traders often see as an early improvement signal. The shared takeaway from the trading community is simple: stay constructive above $160 and reassess only if that level fails.
News Impact:
Recent analyst upgrades and ongoing discussion around U.S. strategic‑minerals policy are helping the bullish narrative. Traders are also positioning ahead of the upcoming earnings report, with implied volatility elevated. That sets the stage for a bigger move, even within this week.
Trading Recommendation:
Putting it all together, I’m LONG Albemarle for this week. I’m targeting a move toward $168 first, with $172.50 as the stretch goal if momentum builds. Risk is clearly defined with a stop at $160 and a wider protection level at $158. Confidence isn’t extreme, so position sizing matters here, but the balance of trader insight and sentiment favors upside over the next 5–7 trading days.
ALB Breaks Higher as Lithium Deficit Narrative Gains Traction:Current Price: 189.51 (Analysis was generated on Monday Morning)
Direction: LONG
Confidence level: 62%(Based on bullish trader language, supportive social sentiment, and constructive news flow, but with limited volume from professional trader videos)
Targets
Target 1: 195.00
Target 2: 200.00
Stop Levels
Stop 1: 185.00
Stop 2: 179.00
Key Insights:
Here’s what’s really driving this setup. Traders are increasingly focused on the lithium supply-demand story shifting into deficit territory in 2026. Several market experts highlighted that expectation as a major tailwind for Albemarle’s earnings power, especially as lithium pricing stabilizes after a brutal downturn. That narrative keeps coming up, and it matters because ALB is one of the cleanest ways to express that theme.
What also caught my attention is how traders are talking about the chart. Multiple traders pointed out that ALB is pressing up against a long-term downward trendline that’s been in place since 2022. When I see repeated references to a trendline test combined with improving fundamentals, I pay attention. It suggests traders are positioning early for a potential breakout rather than chasing later.
Recent Performance:
You can see this story playing out in the price action. ALB has rebounded sharply from last year’s lows and is now trading just under its recent highs near $192. The stock pushed higher over the past week, holding gains despite broader market volatility. That kind of behavior usually tells me buyers are still in control, even at elevated levels.
Expert Analysis:
From a trader perspective, the $185 area keeps coming up as an important near-term floor. Several traders referenced this zone as a level where buyers previously stepped in. On the upside, the $195 to $200 range is the most common target area I’m seeing mentioned, both from technical traders watching resistance and from analysts tying valuation to improving lithium fundamentals. That clustering of views strengthens those levels for this week.
News Impact:
The news flow is adding fuel here. Analysts are openly discussing a future lithium deficit, and at least one major firm raised its price target toward the $200 area. On top of that, Albemarle’s steady dividend announcement reinforces balance sheet confidence. None of this feels speculative hype; it’s more a slow rebuild of credibility after a tough cycle.
Trading Recommendation:
Putting it all together, I’m staying LONG on ALB for the week. I like entries near current levels with a first objective at $195 and a stretch move toward $200 if momentum holds. I’d manage risk closely with a stop near $185, and step aside if $179 breaks, because that would signal this breakout attempt failed. This isn’t a max-conviction trade, but the risk-reward looks solid enough to participate while keeping position size reasonable.
100% Left in the tank?Bought this in July of last year when the RSI was severely OS. Sold at 100% gains and p**sied out to the top, but thinking we might make it up to the top of the channel over the next 6 months. I'd wait for a small correction into the 150-160's, but this doesn't look like it wants to let up if you have fairly high risk appetite. 3 mo RSI still right where we want it to be.
Good luck.
ALB (Weekly) — Structural Shift Confirmed ALB (Weekly) — Structural Reversal Backed by Macro Tailwinds
ALB has completed a multi-year markdown and is now in confirmed HTF expansion following a clean BOS + CHoCH from the discount/strong-low region (~70–90). Price is currently testing equilibrium (~160), which is typical for the first impulse leg after a prolonged base.
Macro & fundamental intelligence supporting the move:
• Lithium supply normalization narrative is shifting.
The market has already priced in peak pessimism from 2023–2024 (oversupply, China demand slowdown, pricing pressure). Marginal supply growth is now tightening as capex cuts, delayed projects, and higher-quality asset concentration favor incumbents.
• ALB is a tier-1 survivor, not a marginal producer.
Balance sheet strength, integrated production, and cost-curve positioning mean ALB benefits disproportionately when weaker producers are forced to slow or exit. This creates asymmetric upside during early-cycle recoveries.
• EV demand is stabilizing, not collapsing.
While growth has slowed, policy support (US/EU industrial strategy, IRA-linked supply chains) anchors long-term lithium demand. Markets tend to reprice before demand acceleration becomes visible in data.
• Commodity cycle rotation.
Capital is rotating back into real assets / strategic materials as rate volatility peaks and long-duration tech loses relative momentum. Lithium sits at the intersection of energy transition and industrial policy.
Technical roadmap:
• Current move = discount → equilibrium impulse
• Base case: Consolidation near 150–160, then continuation toward 200–230 premium imbalance
• Bullish retrace zone: 134–140 (HTF demand)
• Invalidation: Structural failure below ~110
This setup reflects early-cycle repricing, not late-stage speculation. Direction is established; the open question is pace, not bias.
ALB - Albemarle Corp - Re-Test Done.Hello Everyone, Follower,
Happy evening to all. I made a quick break , wathed Formula 1 and I am here again now to share today's last stock which is ALB - Albemarle Corp.
What they do?
Albemarle Corporation develops, manufactures, and markets highly engineered specialty chemicals around the world. The company focuses on lithium compounds, bromine-based products, and refining catalysts. With a history dating back to 1887, Albemarle was incorporated in 1994 and has its headquarters in Charlotte, North Carolina.
Albemarle's products are used in a wide range of products, ranging from pharmaceuticals to cleaning, water treatment, agricultural, electronic, paper, and photographic products. The company operates its business through three segments, including Lithium, Bromine Specialties, and Catalysts. Albemarle's Lithium segment develops and manufactures lithium-based compounds, value-added lithium specialties, and reagents. The Bromine Specialties segment is focused on fire safety solutions and other specialty chemicals applications. The company's Catalysts segment manufactures three main product lines: performance catalyst solutions (PCS); fluidized catalytic cracking (FCC) catalysts and additives; and Clean Fuels Technologies, which includes hydroprocessing catalysts (HPC) and isomerization and akylation catalysts.
As of December 2021, the company employs approximately 5,400 people and serves clients in around 100 countries. On 30 September 2021, Albemarle announced reaching an agreement with Guangxi Tianyuan New Energy Materials Co., Ltd., a China-based lithium converter, to acquire all outstanding equity in the company for approximately $200m.
Financials :
Market Cap : 10.38 B
Revenue : 4.99 B
P/E Ratio : -9.46
EPS : -9.3269
Dividend (Yield) : 1.62 (1.84%)
Technical Part:
Now our part :)
Last week it broke the Down trade to UP and then Re-test the break level. Everything works as expected. I am expecting this trend to continue.
If it breaks the 92.30 - 92.50 and stay above this level then it will confirm the Break Up and these levels would be a good level to get ALB.
Other possibility is re-test the 83.30 - 83.50 again then go Up , if it would do this then these levels also could be another good levels to get , and for me it is much better level.
My personal thinking is quite Positive for ALB. Their sector is being demanded because of the Electrical Autos and i see the good opportunity on it.
My First Target is between 113 to 118 which is approx %30 - %35 above from today's price level.
I have already added ALB to my watch list for next week.
This is just my thinking and it is not invesment suggestion , please do not make any decision with my anaylsis.
Have a lovely Sunday to all.
Stock - Albermale Corporation - Short SetupAlbemarle Corporation (ALB) – Short Setup Technical Analysis
Albemarle is currently trading within the dominant trend, where price has formed a harmonic structure directly at the Anchored VWAP. While the market has respected the VWAP as dynamic support during the prior impulse, the latest price action shows momentum exhaustion into this level, suggesting weakening buyer commitment.
From a tactical perspective, this setup favors a short continuation or rejection trade rather than trend expansion. Acceptance below the Anchored VWAP would confirm bearish control and open downside potential toward the prior volume node and structural support zone.
Bias: Short on rejection at VWAP
Invalidation: Sustained acceptance above the Anchored VWAP
Context: Harmonic completion + VWAP confluence = asymmetric short opportunity
ALB Repeat of last year?ALB chart pattern is almost identical to last year, even more so than XLF because it's at the same price level as last year. Just keep in mind Nov pump was elections last year.
We could also get a big gap up Monday if they compromise on the Fed shutdown.
Not a stock I would hold long term, but interesting chart.
Cup and Handle Breakout – ALB (Albemarle Corporation)ALB is showing a cup and handle formation on the daily chart. Price is now testing the $84–$87 resistance zone which aligns with the long-term descending trendline.
A confirmed breakout above this level could trigger a bullish continuation, with a measured move target near $115 (+41%).
📈 Entry: On breakout and daily close above $87
🎯 Target: $115
🔻 Invalidation: Below $75 (handle low)
This setup suggests strong bullish potential if resistance is cleared with volume.
Not financial advice. No responsibility for any actions taken.
ALB Technical Outlook – Symmetrical Triangle at Key Inflection⚡ ALB Technical Outlook – Symmetrical Triangle at Key Inflection
Ticker: ALB (Albemarle Corp.)
Timeframe: 30-minute candles
🔍 Current Setup
ALB has been in a long-term uptrend, holding an ascending support trendline since late June. After peaking near ~87, price has pulled back and is now consolidating within a symmetrical triangle.
Descending resistance: ~84–85.
Ascending support: ~76–77.
Current price: ~81.40, sitting inside the triangle and nearing the apex.
This structure reflects compression — energy building for a decisive breakout.
📊 Breakout Levels
🚀 Upside (Bullish Scenario)
Trigger: Break and close above 85.
Intermediate Targets:
87–88 → Prior swing high.
90+ → Psychological round number.
Measured Move Target: ~92–94 (triangle height projection).
🔻 Downside (Bearish Scenario)
Trigger: Break below 77, confirmation under 76.
Intermediate Supports:
74–73 → First demand zone.
70–68 → Stronger support.
Measured Move Target: ~67 (triangle height projection downward).
📈 Volume Analysis
Volume has been declining during the triangle formation — normal for consolidation.
Expect a sharp volume expansion once price escapes the triangle.
⚖️ Probability Bias
The broader trend has been upward, which slightly favors a bullish continuation if resistance at 85 is cleared.
However, a failure below 76–77 would invalidate the bullish structure and trigger a breakdown.
✅ Takeaway
ALB is at a critical decision point within a symmetrical triangle:
Bullish Break > 85: Targets 88 → 90 → 92–94
Bearish Break < 76–77: Targets 74 → 70 → 67
The breakout direction — confirmed by volume — will likely define ALB’s next major move.
ALB Long, Resurrection of lithium trendALB have started to rise in recent weeks. It's price stays near 5-year lows.
Long-term Price Levels already have worked to bounce the stock by around 50%+.
Most likely funds have started to trade it in Mean Reversion strategies. So, the movement back to 200MA and 800MA on Weekly time-frame is quite possible.
As fast as banks would start to rise stock's rating - it will go sky high.
Recently UBS already cut it's rating to "Sell". Yet, trend already is mighty enough and just kept going higher.
Full margin on every black 1D candle!