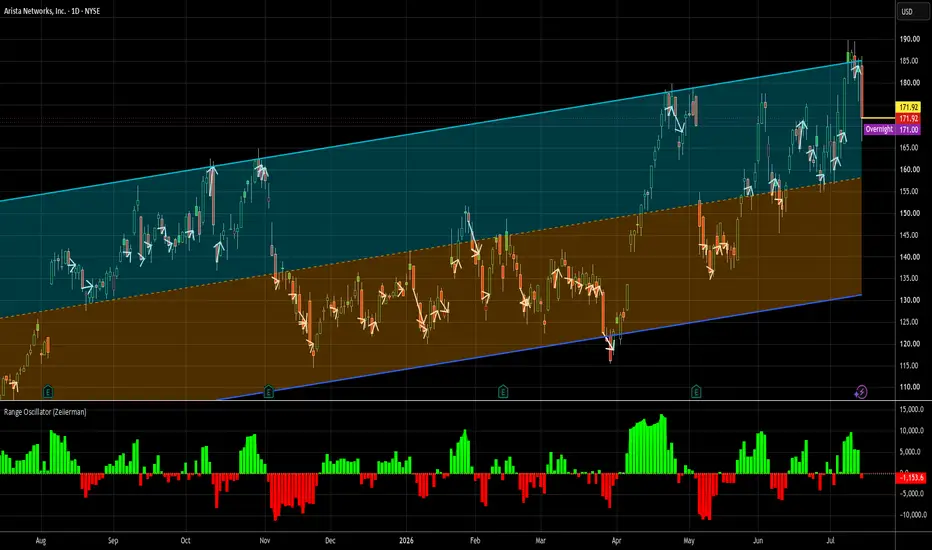
Risk off trade mod on ANET - long at 171.92This trade is a little different than what I usually do. It's something I've been playing around with for use during tough times. It's still a mean reversion, but with a little safety net just in case. It could involve a realized loss, so beware if you are used to my trades that don't go that route.
Things feel shaky in this market right now. The fact that they FEEL shaky doesn't mean that they ARE shaky, though. But as with much of trading, I'm no prognosticator where markets are headed - that's way above my pay grade. My normal trading methods are great in choppy non-trending markets, ok but locked out a lot in uptrending regimes and can be downright rough (though almost always ultimately profitable) in downtrends. This is a compromise for in case that last one is where ANET is headed.
As always, the goal here is a quick flip. Essentially there are 3 ways to play those - aggressively trying to squeeze every drop out of the trade; a more neutral version where exits are usually quick but stubborn holds until profit are part of the equation; and then a conservative version - which is the one I'm doing here.
The entry here is based on an abnormally large downward move. The twist is the exit which is based on a 4 part decision tree.
Part one - if the next bar opens above my entry price, I close and walk away with whatever profit I get. These are often small wins. But my game is to beat the average daily return of the market and do it all over again with that same money as soon as the trade clears. So the bar isn't high: more than .043% in one day puts me ahead of the game. If I can get 6x that (about .25%) once every week, I'd beat the market's long term average return. So I have no problem with a small quick win here and that is my preference.
Part 2: If that fails and the stock opens below my entry price tomorrow, then my next target becomes an above median move from that point. Now, if it Is a large gap down at the open, this option may immediately come off the table, as even a move to that level would still be below my entry price and I'm not taking a loss this quickly. But if the median high is above my entry price, I set a limit order at that level and I hope for the best.
Part 3 - If that target does not get hit, I will revisit the trade near the end of the trading day. If closing at that point gives me a profit I take it. And if not...
Part 4 - do it all over again tomorrow the same way. If that bar's open is above my entry, I close. etc. If, however, at the end of the 2nd day I'm still in the red, I eat the loss.
Some general notes about this. First, the most common result is out the next day. For ANET, this technique has had a win rate of 82% over the past year, with an average trade being about .33% with losing trades included in that average. That's around 7.5x the average market return and a level that if annualized, is an around 80% rate of return. Not too shabby. About 75% of the trades have been day 1 wins. Once you get to day 2, it becomes closer to a coin toss.
However, and this is important, losses tend to be asymmetrically large. The key is that they are almost never huge. The average loss was 3.2% over the past year while the average gain was only 1.2%. But an 80% win rate, even with smaller magnitude wins overwhelms the losses. This is not a fluke of recent strength in the stock, either. The dynamics are similar, though a bit weaker, over the long haul.
Over the 12 years since ANET went public, covering 650 backtested and live trades, the win rate on this is around 70%, but the discrepancy between win and loss magnitude is smaller, producing an average daily return on invested capital of .25% - still a 63% annualized rate of return.
The more aggressive ways to trade this would, predictably, lower win rate and raise average gains overall, but jeopardize per day returns (capital efficiency). Given the run that ANET and its cohorts have been on and the weakness this part of the market keeps flirting with, after ANET has clocked a price jump of almost 50% just in the last 3 months, I'm choosing the path fraught with the least amount of short term danger.
If there is a market meltdown, I want my capital available and not tied up for months or years waiting to get back to even. This guarantees not to lock up capital. The biggest loss in the last 12 months on ANET doing this has been 6%. I can make that much on a single trade on one good day. I'll risk the loss for safety and liquidity right now.
By the way, stacking additional lots is possible, provided my entry criteria are met. Additional lots follow the same rules. I'll keep this idea live until all lots have been closed.
As always - this is intended as "edutainment" and my perspective on what I am or would be doing, not a recommendation for you to buy or sell. Act accordingly and invest at your own risk. DYOR and only make investments that make good financial sense for you in your current situation.
Arista Networks, Inc.
No trades
No trades
In-depth trading ideas
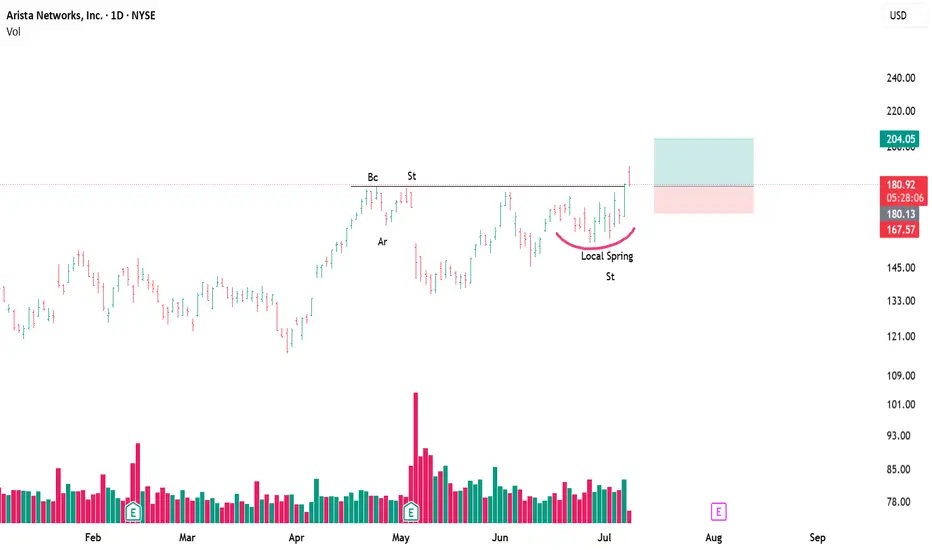
New ATH coming after prior failANET failed to take out it's ATH after closing the gap at 170 and pulled back with the rest of the market. Now with the MAs coming back together and price action definitively breaking above them it appears ready to try again. I am looking for 185 first followed potentially by some consolidation and then a run at 200
ARISTA NETWORK GOING MARK UPThis is a continuation from my previous thesis :
-Kindly refer to link attached
My previous position, sold early as a cushion for upcoming risk
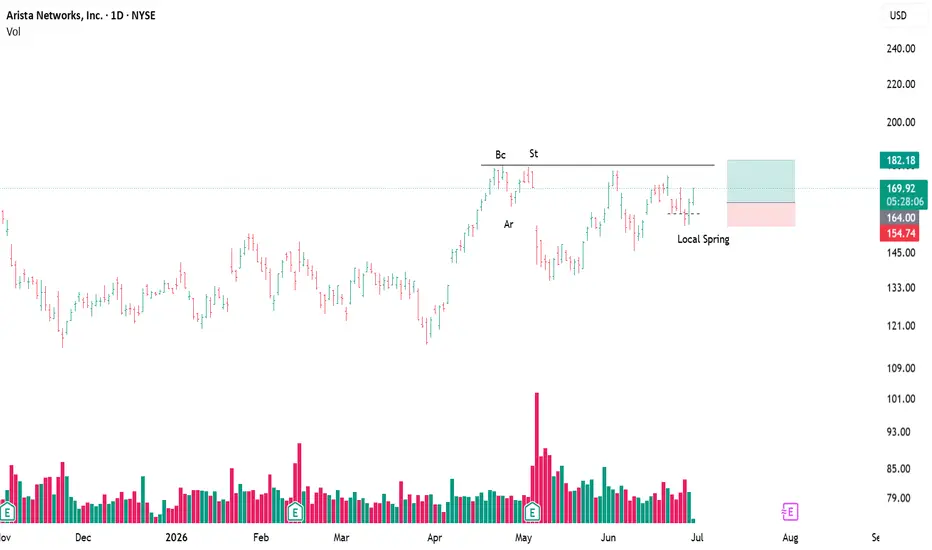
Beautiful Feather's Weight formed from Bar @ 22nd Jun until 7th July
*Red line arc
Bar @ 30th jun, 1st & 2nd july formed Springboard
My 1st position intiated 8th July
Today added more
Arista - Every GPU in the World Needs This Stock (ON SALE!!)ANET — 20% Correction, Unbroken Thesis | Breakout Retest at Key Confluence
NYSE:ANET has been trading in a well-defined long-term ascending channel, consistently respecting both boundaries. After testing channel support in April 2025 it launched a powerful bull run, peaking in October 2025. A multi-month consolidation followed before price broke out of the range. Classic pattern, it then retraced 20%+ to retest the breakout level.
That retest is happening right now at a triple confluence:
→ Horizontal support - former resistance turned support
→ Bollinger Band Basis - 20MA converging at exactly the same level
→ Ascending channel structure intact beneath
Support is holding. If it confirms we take a position.
Setup:
Entry $140-150 (confirmed rebound only) | Stop $125 (weekly close) | Target $260-290 (upper channel) | Next support if fails: $110-115
Probabilities:
🟢 Support holds → channel top — 60%
🟡 Consolidation at support — 20%
🔴 Breakdown → $110-115 — 20%
Why did it correct 20%?
Not fundamentals - sentiment and positioning.
The stock had already rallied 87% in a year and 34% in a single month. An impossibly high bar. Q1 2026 actually beat estimates, revenue $2.71B vs $2.62B expected, up 35% YoY, record operating cash flow of $1.69B. The CEO called it the best demand environment of her career. Yet the stock fell 14% on earnings day.
Why? Supply chain constraints on wafers, memory, and optical components are pressuring near-term margins. And guidance, while raised to $11.5B for the full year, fell short of the inflated expectations baked into the valuation. Classic sell the news after a parabolic run. The broader AI sentiment correction did the rest.
The business did not break. The multiple did.
Why could it rebound?
After the correction Arista trades at ~30x forward earnings, back to its historical average. The premium is gone. What remains is a company with $8.9B in contractual purchase commitments, AI networking revenue doubling to $3.5B in 2026, and $700B in hyperscaler AI capex flowing directly through its order book. Supply constraints are temporary. Demand is structural.
Google is reportedly becoming a significant new customer, which would reduce the Microsoft/Meta concentration risk that has been a persistent concern. The new XPO product delivers 8x bandwidth at 75% fewer racks, purpose-built for exactly the AI data centres being constructed right now.
53% of analysts rate it Strong Buy. Zero sells.
Confirmation signal: Weekly close above $155 on elevated volume.
Discipline over anticipation, we wait for confirmation before entering.
ANET: Digestion Phase & Structural ResetThe Setup:
Arista Networks ( NYSE:ANET ) remains an essential backbone hardware provider for the global AI data center build-out. As primary AI software cools, the stock is currently digesting its previous run and setting up its next structural entry point. We are actively tracking the daily and monthly charts to identify a low-risk accumulation zone before the next macro leg higher kicks off.
Reasoning:
Digestion Phase (Healthy consolidation following a massive uptrend)
AI Hardware Leader (Essential infrastructure tailwinds supporting the long-term trend)
Monitoring daily/monthly charts (Waiting for a definitive structural trigger before entry)
LONG $ANET - AI Company that Connects $NVDA GPUsI've started buying NYSE:ANET around this level.
One thing I've learned over the years is that when you're investing in a major trend like AI, it's worth looking beyond the companies making the headlines.
Everyone talks about NASDAQ:NVDA because they build the GPUs. But once those GPUs are installed, someone has to connect tens of thousands of them so they can work together efficiently. That's where Arista Networks comes in.
To me, Arista is one of the critical pieces of AI infrastructure.
As I've mentioned in my previous ideas, I'm building a long-term portfolio around robotics and automation. I believe companies like Arista deserve a place in that portfolio because robots, AI clusters, and autonomous systems all depend on fast, reliable communication. Without that network, none of these systems can perform at scale.
If I had to describe Arista in one sentence, it would be this:
Arista builds the nervous system of AI data centers.
Could this pull back from here? Absolutely.
The FOMC meeting is just around the corner, and the market will be paying close attention to the tone of the new Fed Chair. If the market reacts negatively, I wouldn't be surprised to see another pullback.
But that doesn't change my thesis.
I'll continue adding to my position as long as it stays within my planned risk. I'm not trying to pick the exact bottom. I'm simply accumulating a business I believe will play an important role in the next decade of AI.
Like I always said, just manage your risk on this one.
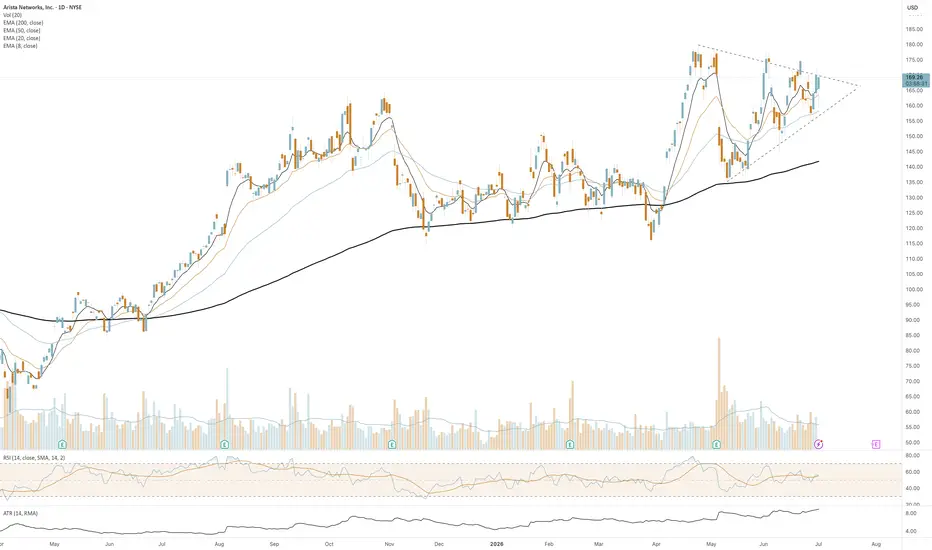
ANET – Coiling Beneath ResistanceNYSE:ANET – Coiling beneath resistance
Arista Networks continues to build a constructive pattern after its powerful April breakout. Rather than giving back gains, price has spent the last several weeks digesting inside a tightening symmetrical triangle while holding above a rising 50 EMA.
What I like:
* 📈 Bullish EMA alignment (8 > 20 > 50 > 200)
* ✅ Rising 200 EMA confirms the long-term uptrend
* 🔄 Healthy consolidation after an impulsive move higher
* 📐 Volatility contracting into a symmetrical triangle
* 🎯 Watching for a decisive breakout above the upper trendline
This is exactly the type of consolidation you want to see in a market leader. Buyers have consistently stepped in on pullbacks while sellers have been unable to force a lower low, creating an increasingly tight range.
A high-volume breakout could signal the next leg higher. Until then, patience is key—let price confirm direction before chasing.
Trend remains bullish while price continues respecting the rising 20 and 50 EMAs.
ANET- Potential for 20%-30% trade with a great R/RArista (ANET) is a core AI infrastructure play: its high-speed Ethernet switches are the plumbing connecting GPU clusters in AI data centers, right sector, right time.
Price has been consolidating inside a symmetrical triangle since late April. The RSI is a useful guide here, since it's also consolidating in a triangle of its own, a breakout above the RSI triangle would be strong confirmation for the pattern.
The Trade Idea:
Trigger- B/O above $177.48
Target 1- $215.5 (+21.5%)
Target 2- $234.89 (+32.3%)
One of the best characteristics of symmetrical triangles is the favorable R/R. The chart still needs to develop before we can set a precise stop-loss, but even using $169 as our S/L, the R/R is excellent, roughly 4.4 to Target 1 and 6.7 to Target 2.
Update idea
Add note
Arthursh
Disclaimer
The information and publications are not meant to be, and do not constitute, financial, investment, trading, or other types of advice or recommendations supplied or endorsed by Tra
The answer to AVGO could be in the ANET chart.ANET recently produced a sharp gap-down selloff accompanied by a spike in volatility. At first glance, this looked alarming. However, the more interesting observation is what happened afterward.
What Did We Observe?
ANET experienced a sudden downside shock. Volatility expanded aggressively and sellers initially appeared in control. Yet the event did not lead to persistent downside follow-through. Instead, buyers stepped in and price recovered significantly during the session or shortly thereafter.
The pattern was not simply "price down." The pattern was "price down, then rejection of lower prices."
What Does a Professional See?
Professionals are less interested in the size of the gap and more interested in what the market accomplished with that fear.
The May selloff already answered an important question:
Large-scale selling pressure was present, but it failed to create lasting structural damage.
The market has once again demonstrated that lower prices attracted demand rather than accelerating liquidation.
That is information.
The same information is in yesterday's 5 Minute chart of AVGO. (Note: I do not trade that timeframe).
What Remains Unclear?
One strong recovery candle does not prove the correction is finished.
The unanswered question is whether buyers will continue accepting higher prices over the coming days. Volatility remains elevated, and failed recovery attempts can still lead to deeper pullbacks.
The risk is no longer the initial shock. The risk is failed follow-through after the recovery.
What Does This Mean for Retail Traders?
Retail traders often focus on the gap itself. Professionals focus on the response.
The current evidence suggests patience rather than prediction. The market has shown that panic selling can be absorbed, but it has not yet proven that a new momentum expansion has begun.
For now, the most important observation is simple:
Sellers created fear. They have not yet proven they can maintain control.
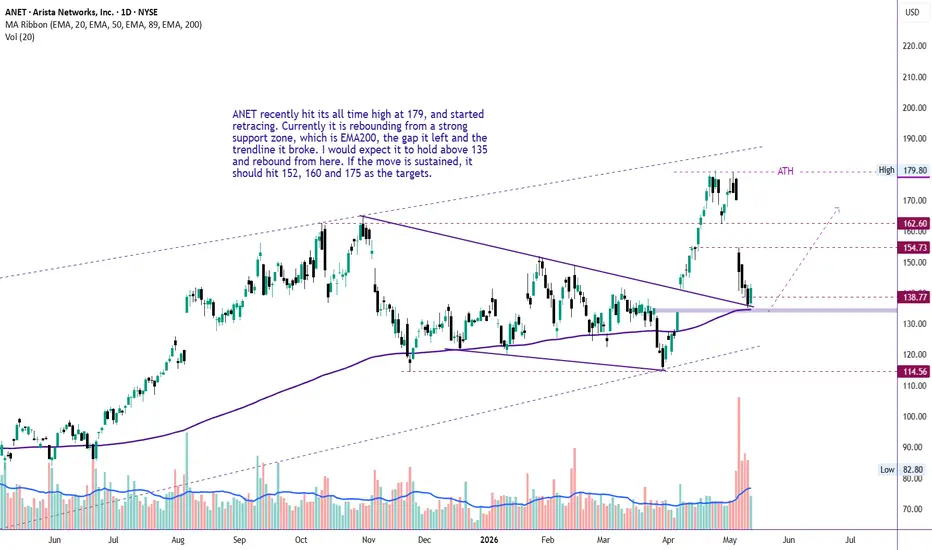
Rebound from confluence support zoneANET recently hit its all time high at 179, and started retracing. Currently it is on a strong support zone, which is EMA200, the gap it left and the trendline it broke. I would expect it to hold above 135 and rebound from here. If the move is sustained, it should hit 152, 160 and 175 as the targets.
ANET. Excellent quality, at the top, but a little more?Among large-cap AI infrastructure stocks, Arista Networks (ANET) has one of the strongest, long-term investment cases.
The key idea is:
Every AI cluster, needs not only GPUs, but also an extremely fast network connecting those GPUs. Arista is one of the companies enabling that connectivity.
If I were, ranking major AI infrastructure businesses, by quality rather than hype, I'd put them roughly in this group:
NVIDIA
Arista Networks
Broadcom
Vertiv Holdings
Arista is compelling, because it benefits from the AI, buildout regardless of which model, chip, or AI application wins. As AI clusters become larger, networking tends to become more important, not less.
For investors seeking an AI infrastructure name that is profitable, has a strong moat, and is less dependent on a single product than many AI stocks, ANET is one of the strongest candidates.
Richly priced, i doubt investors jump out.
ANET - Gap Fill and Continuation Trade
ANET 140 is a strong volume shelf support and all MAs and VWAPS converged.
Now it has a gap fill trade here upto 170
There after if it can break and hold 170, we can see the next leg up to 200+
Target 1 - 170
Target 2 - 195
Target 3 - 215
Stop Loss - 140, If there is a rejection at 170 level 2nd time we may see a correction wave to downside.
Arista got an amazing setupArista Networks is one of the stellar AI names which hasnt given extraordinary returns in last 1 year. However it seems that's about to change.
This is an incredible setup for going long with the higher slopes of HH and HLs and at the retouch of previous highs at 133$ for a 250$ target within next 6-8 weeks.
Arista’s AI Engine: Cooling Down or Gearing Up?Arista Networks (ANET) has recently entered a high-volatility phase following its Q1 2026 earnings report on May 5th. Despite a "double beat" in revenue ($2.71B) and EPS ($0.87), the stock experienced an after-hours sell-off, pulling back from its $170 highs toward the $148 – $150 range. This makes technical levels and "smart money" concepts like FVGs even more critical for your entry strategy. ANET is a leader in AI networking, but it's currently "cooling off" after a massive run. Use the 0.618 Fib and the 20EMA as your primary guide rails. If they hold, the path to $200 remains open.
$173 - $182 Take profits or look for Short setups if HA candles turn red.
~$148 Crucial "Hold or Fold" level for the current week.
~$140 Major area of interest for long-term accumulation.
Price Targets (May 2026 Context)
Near-Term Resistance: $170 – $182 (Recent peak and median Wall Street target).
Bull Case Target: $200 – $220 (High-end estimates from J.P. Morgan and TD Cowen).
Institutional Support: $138 – $145 (Significant volume profile and previous consolidation area).
Technical Setup: Combining Tools
Using TradingView effectively means stacking these indicators to find "confluence."
1. Heikin-Ashi (HA) Candles
Standard candles can be "noisy" during earnings volatility.
The Strategy: Switch to HA to filter out market noise. If you see a series of red candles with no upper shadows, the downtrend is strong. Look for a small-bodied candle with a long upper wick followed by a green HA candle to signal a reversal near support.
TradingView Hack: Use the "Compare" tool to overlay standard candles as a ghosted line to ensure you aren't missing the exact "real" price for your limit orders.
2. Fair Value Gaps (FVG)
Because ANET gapped down after earnings, a Bearish FVG has likely formed between the previous day's low and the current day's high.
Application: Price often gravitates back to "fill" these gaps. If ANET rallies back to the $160–$165 zone, watch for rejection at the FVG.
Bullish FVG: Look for an older gap around the $135–$140 level (pre-rally). If price hits this, it may act as a "magnetic" support zone where buy orders are sitting.
3. 20-Day EMA (Exponential Moving Average)
The 20EMA is the "trend rider."
The Trend: As of early May, the 20EMA is sitting near $148.
Action: If price holds above the 20EMA on the daily chart, the medium-term bullish structure is intact. If it closes decisively below it, the next stop is usually the 50-day SMA (approx. $131).
4. Fibonacci Retracement Levels
Draw your Fib from the April low (~$120) to the May high (~$173).
0.5 Level ($146.50): This is the "Equilibrium." Often the first major bounce spot.
0.618 Golden Pocket ($140.20): This is the high-probability reversal zone. If price drops here and aligns with a Bullish FVG, it is a high-conviction "Buy the Dip" setup.
TradingView Efficiency (No Double Pay)
To get the most out of a free or basic plan:
Save Indicator Templates: If you are capped on the number of indicators per chart, save a "Trend Template" (20EMA + Fib) and an "Entry Template" (Heikin-Ashi + FVG). You can swap between them with one click.
Alerts on Trendlines: Instead of using multiple indicators that eat up your limit, draw a trendline at a Fib level and set an alert. It’s more "cost-effective" for your plan's alert quota.
Week 19 of 52 — ANET: Great Results Were Not EnoughGreat companies can still sell off when expectations are too high.
NYSE:ANET is a strong example of something many traders misunderstand during earnings season: the market does not only react to whether a company reports good numbers. It reacts to the difference between the results and what investors had already priced in.
That difference is called expectations.
When a stock has been a major winner for years, the bar becomes higher. Investors do not just want growth. They want acceleration. They do not just want strong numbers. They want stronger-than-expected guidance, expanding margins, and a story that keeps getting better. When a stock is priced for perfection, even a solid report can trigger a sharp reset.
That is what makes this chart interesting.
ANET remains in a strong long-term structure, but the post-earnings reaction is now testing the market’s confidence. The stock is not broken just because it sold off. But it is also not automatically a buy just because it is a great company. This is where technical levels help separate emotion from structure.
The first key zone is $145–$150.
This is the current Expectations Reset Zone. Price is reacting here after the sharp selloff. The important question is not whether ANET is a good company. The question is whether buyers are willing to defend this area after expectations were reset. If this zone stabilizes, the stock may begin to digest the move. If it fails, the reset can continue lower.
The next level is $130–$135.
This is the First Reaction Zone. If the current area does not hold, this becomes the next logical place where traders may look for a stronger reaction. I do not see this as an automatic buy zone. I see it as a place where price behavior matters. A clean rejection lower would be weak. A strong bounce with improving volume would show that buyers are still active.
The most important long-term area is $105–$115.
This zone lines up with the major rising trendline and represents the broader structural support. This is where the long-term chart becomes more important than the short-term earnings reaction. If ANET were to pull back toward this area and defend it, the long-term trend could still remain intact. But if that trendline eventually breaks, the conversation changes from a healthy reset to a deeper structural breakdown.
That is the main lesson here.
A strong company can have a weak stock reaction.
A good earnings report can still lead to selling.
A long-term trend can remain alive even while short-term momentum resets.
The mistake many traders make is assuming that “good company” means “good entry.” It does not. Price still matters. Structure still matters. Expectations still matter.
For ANET, the chart now becomes a map of scenarios:
If $145–$150 holds, the stock may be starting to absorb the earnings reset.
If price loses that area, $130–$135 becomes the next reaction zone to watch.
If the correction becomes deeper, $105–$115 is the major long-term support area where the bigger trend would be tested.
The bullish case is not simply that ANET is a quality company. The bullish case would be buyers defending key levels and eventually rebuilding momentum. The bearish case is not simply that the stock sold off. The bearish case would be failure to hold these support zones and a breakdown of the long-term structure.
This is why earnings reactions are so important to study. They show where expectations were too high, where buyers are still interested, and where the market begins to separate strong businesses from strong stock setups.
Great companies can still sell off when expectations are too high.
The company may deliver.
But if the stock was priced for perfection, the chart decides what happens next.
Disclaimer: This post is for educational purposes only and is not financial advice. Always do your own research and manage your own risk.
Live trading on Arista Networks (ANET)As you can see, the price has reached the lower boundary of its parallel channel, and considering the divergence formed on the RSI, it appears that the price has the potential to rise toward the TP1 level and then TP2.
Follow proper risk and money management.
This is just my personal view, so please trade based on your own strategy and trading system.
Follow me on TradingView for more analyses and live stock trades.
NYSE:ANET
CBRA V3 Bullish setup for ANETArista Networks (ANET) continues to trade within a broader bullish structure, with recent price action showing a strong reaction from a key demand zone.
From a technical standpoint:
▶️ The macro trend remains bullish, with price holding above the 50/100-week EMAs
▶️ A recent pullback brought price into a well-defined support area (previous demand zone), which has historically acted as a base for continuation moves
▶️ This zone is also aligned with the lower Bollinger Band and the 50-week EMA, creating a strong confluence of support
▶️ The latest candles show a sharp bullish reaction from this area, suggesting buyers are stepping back in
Momentum context:
▶️ RSI has pushed higher from mid-levels and is now approaching stronger momentum territory, confirming the shift in short-term direction
▶️ The move off the lows is impulsive, not corrective, which typically favors continuation rather than immediate reversal
⸻
📊 𝐂𝐨𝐧𝐭𝐞𝐱𝐭
This setup reflects a pullback-and-continuation structure within an established uptrend.
In simple terms:
“Price pulled back into support — and is now showing signs of re-acceleration.”
⸻
📊 𝐇𝐢𝐬𝐭𝐨𝐫𝐢𝐜𝐚𝐥 𝐛𝐞𝐡𝐚𝐯𝐢𝐨𝐫
Looking left:
▶️ Previous pullbacks into this demand zone have led to strong upside expansions
▶️ The trend has consistently respected dynamic support (EMA + volatility bands)
▶️ Reactions from similar levels have produced higher lows and continuation legs
⸻
🎯 𝐓𝐫𝐚𝐝𝐞 𝐢𝐝𝐞𝐚 (𝐋𝐎𝐍𝐆)
This is a trend continuation setup.
The idea:
▶️ Position after confirmation of support holding
▶️ Target continuation toward prior highs / expansion range
▶️ Risk defined below the demand zone if structure fails
⸻
🧠 𝐋𝐞𝐧𝐬
⤴️ Trend = bullish
⏬ Condition = pullback into support
⤴️ Opportunity = continuation from demand
⸻
Key level to watch:
As long as price holds above this demand zone and continues building structure, the path of least resistance remains to the upside. A breakdown would shift the focus toward deeper retracement.
Happy pip hunting!
Arista Networks (ANET): Rising Channel Continuation + AI NetworkOverview Summary
We’re tracking NYSE:ANET as a core Green Zone Capital exposure within the AI infrastructure stack, specifically the network fabric that connects accelerated compute, storage, and data-center traffic. At the time of writing, Arista is trading around $154.57 per share with a market cap of roughly $183.1 billion.
From a chart perspective, ANET continues to respect a rising channel on the weekly timeframe. Price corrected earlier in the year, found support near the lower half of the structure, and is now pressing back toward the upper portion of the trend. That keeps the setup in continuation mode rather than breakdown mode.
Within GZC’s Bottleneck-to-Ticker framework, Arista fits because AI is not only a compute story — it is also a network throughput and latency story. GPU clusters do not scale efficiently without high-performance switching, routing, and data movement. Arista’s latest reported quarter reinforced that backdrop: the company reported 2025 revenue of $8.25 billion, up 17.5% year over year, and fourth-quarter revenue of $1.93 billion, up 25.3% year over year.
Bias: Long
Type: Trend Continuation / Infrastructure Compounder
Entry Zone: Prefer adds on orderly pullbacks toward channel support / mid-structure consolidation
Target Zone: $200–$220+
Invalidation: Sustained weekly breakdown of the rising channel structure
Technical Analysis
Technically, ANET still looks constructive. The stock remains inside a higher-high / higher-low trend channel, which suggests the broader structure is intact even after periods of volatility. The recent move higher looks less like a random bounce and more like a continuation attempt back toward the upper boundary of the range.
Behaviorally, this is what stronger infrastructure names often do: they correct through a controlled pullback, re-establish support, and then attempt another leg higher. As long as the channel remains intact, the path of least resistance stays upward.
Macro/Fundamental Thesis
Arista is one of the cleaner public-market ways to express the view that AI infrastructure requires more than semiconductors. As clusters become larger and more performance-sensitive, networking becomes a real bottleneck — not a side consideration. That matters because capital has to flow not only into compute, but also into the systems that allow compute to communicate efficiently.
For GZC, ANET remains attractive because it sits inside that forced-spend layer. The company’s own positioning emphasizes large AI, data center, campus, and routing environments, and it recently announced high-density liquid-cooled pluggable optics aimed at accelerated computing environments.