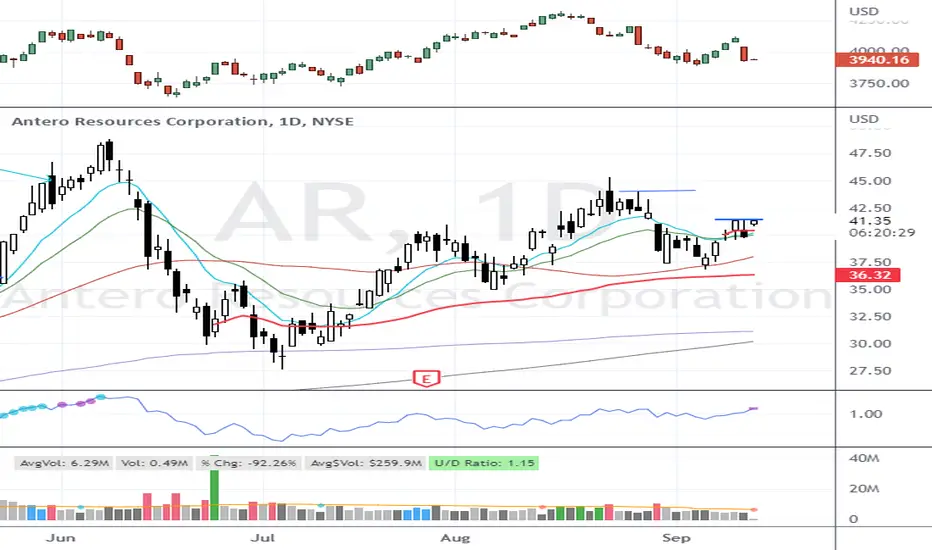
Analysis and Forecast: Antero Resources Corporation (AR)Technical block:
Following the recent correction, AR has broken its medium-term downtrend, signaling a potential trend reversal. Price action indicates renewed accumulation of long positions with buyers gradually regaining control.
Bullish targets:
* Target 1: $37.56
* Target 2: $43.75
A sustained move above the recent breakout zone would strengthen the bullish scenario and increase the probability of reaching the stated targets.
Fundamental block:
1. Global LNG demand is expected to accelerate throughout 2026 as new export capacity comes online, supporting long-term natural gas consumption and improving the outlook for U.S. gas producers. (IEA)
2. The United States continues to expand natural gas production while LNG exports reach new record levels, reinforcing the country’s position as the world’s leading LNG supplier. (eia.gov)
3. Electricity demand from AI infrastructure and data centers continues to support long-term natural gas consumption, creating a favorable macro backdrop for high-quality producers such as Antero Resources. (Reuters)
Forecast (2–6 weeks):
The technical structure has shifted in favor of buyers after the trendline breakout. If the breakout is confirmed by volume, the probability of continuation toward $37.56 increases significantly. A successful consolidation above this level could open the way toward the second target at $43.75.
This publication reflects my personal market analysis and is not financial advice.
In-depth trading ideas
AR — LNG-Linked Marcellus Scale + Structural Gas TailwindsAntero Resources NYSE:AR is a leading Appalachian natural gas and NGL producer with a low-cost operating base and premium pricing exposure through LNG-linked Gulf Coast corridors—positioning it well for a strengthening U.S. gas cycle.
Key Catalysts
HG Energy Acquisition = Step-Change Scale: The deal lifts 2026 production guidance to ~4.1 Bcfe/d with a path to ~4.3 Bcfe/d in 2027, expanding drilling inventory and improving operational efficiency.
Premium LNG & Export Exposure: Roughly ~75% of gas flows are tied to Gulf Coast LNG corridors, while ~50% of NGL volumes are exported—supporting stronger realized pricing versus in-basin benchmarks.
Structural Demand Tightening: AI data centers, accelerating LNG exports, and electrification are driving sustained demand growth, improving long-term supply-demand balance and supporting durable free cash flow upside.
Investment Outlook
✅ Bullish above: $37–$38
🎯 Upside target: $60–$62, supported by production scale, LNG-linked pricing, and multi-year demand tailwinds.
Natural Gas: Is this the bottom? Natural Gas inventories came in better than expected and the commodity still sold off.
Price action did fill a major downside gap today but the reaction was fairly muted which means were probably going lower.
The weird disconnect in Nat gas vs resource stocks is intriguing.... Resource stocks have held up when Nat Gas has sold off.
Something is going to give one way or another.
A very big long level is approaching, and it could be an epic trade.
AR Antero Resources Bullish Bets in the Options Market! PT: $40Macro Catalyst: Winter Storm Fern:
The severe storm has disrupted U.S. gas supply, cutting production by 9–15% and boosting demand. For AR, focused on Appalachian gas, this spells direct upside as exports and heating needs spike.
Technicals:
AR held support above $34, with recent highs at $35.51. Volume topped 3.69M shares. A bullish pennant pattern suggests a breakout past $35.50–36 could target $37–38, accelerating to $40 post-earnings. EPS growth hit +472% Q/Q, limiting downside (support at $32–30).
Options Flow: Heavy Bullish Bets:
Sentiment screams bullish: $105M call premiums vs. minimal puts, volumes 6.8x daily average. Key unusual activity on long-dated calls:
Massive blocks on Feb 2026 $37 strikes (35k+ contracts, $2.6M–$8.6M premium)
Mar 2026 $38/$39 strikes with sweeps (40k/3k contracts)
Recent Mar $39 calls at $0.85
IV at 41–48%, high heat score signals aggressive upside plays. Dark pool blocks (e.g., 1.17M shares ~$40M) show smart money accumulating quietly.
Analyst Consensus: Strong Buy with Upside!
15 analysts rate Buy overall (9 Buy, 7 Hold, 2 Strong Buy), average target $44.33 (~29% upside). Wells Fargo at $46, Siebert at $48; optimists see $60. Stable BBB- ratings from Fitch/S&P. Expect ~$500M FCF boost from recent acquisitions like HG Energy.
Outlook: $40 Feasible!
Volatility in gas prices and post-storm corrections are risks, plus options decay without quick moves.
But with insider buying, earnings positioning, and flow momentum, $40 looks realistic post-report – a ~16% gain aligning with key strikes!
AR Rebounding from VWAP Zone – Watch for Break Above $34AR is attempting to base after a steep selloff from the $44 level. Over the past few sessions, price has found stability above the anchored VWAP (yellow line) and printed multiple higher lows. Today’s close at $33.82 brings it right up against the recent short-term resistance near $34.
Volume is steady (5.52M vs. 5.82M average), suggesting balance between buyers and sellers. A confirmed breakout above $34 with volume could trigger a move toward the $36.50–37 range, where the next anchored VWAP (red) and declining 20 EMA reside.
This setup favors early reversal traders with tight risk below VWAP and confirmation needed through $34.25.
Indicators used:
Anchored VWAP (short-term support reclaim)
Volume trend (flat but no selling surge)
Price structure (potential bottom formation with higher lows)
Entry idea: Long above $34
Target: $36.50–37
Stop: Below $32.75 or VWAP zone
Natural Gas Crisis: Profits were made!Nat Gas plunged to a 1-week low Monday on the outlook for cooler US temperatures.
A report came out that Nat gas has heat peak demand which is scaring investors.
Nat GAs equities got demolished which could indicate that this breakdown is real.
We got rejected off the daily 50 MA & Knifed through the 200 Daily MA.
Some clear technical breakdowns are now in affect.
We banked on EQT put options that ran over 400%. This trade was called out free on our channel. You tube Short.
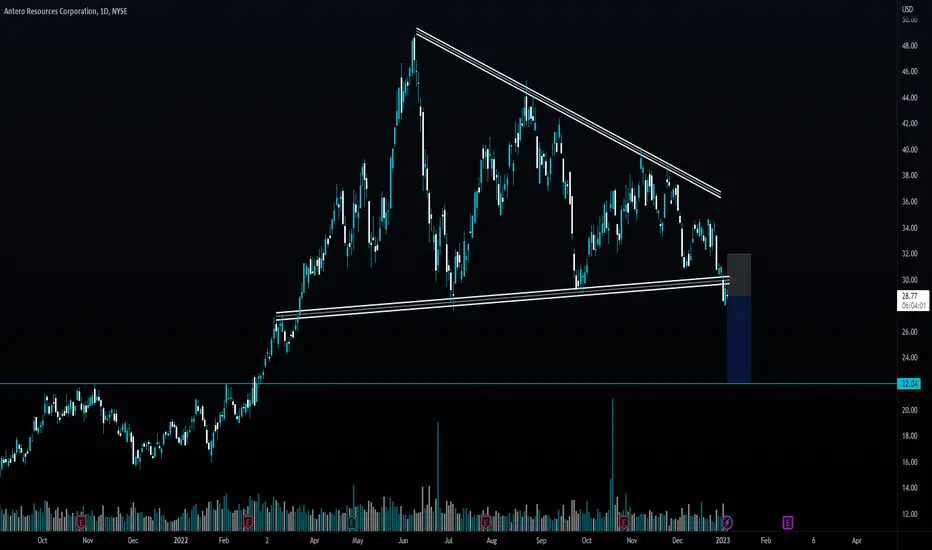
AR - 5 months HEAD & SHOULDERS CONTINUATION══════════════════════════════
Since 2014, my markets approach is to spot
trading opportunities based solely on the
development of
CLASSICAL CHART PATTERNS
🤝Let’s learn and grow together 🤝
══════════════════════════════
Hello Traders ✌
After a careful consideration I came to the conclusion that:
- it is crucial to be quick in alerting you with all the opportunities I spot and often I don't post a good pattern because I don't have the opportunity to write down a proper didactical comment;
- since my parameters to identify a Classical Pattern and its scenario are very well defined, many of my comments were and would be redundant;
- the information that I think is important is very simple and can easily be understood just by looking at charts;
For these reasons and hoping to give you a better help, I decided to write comments only when something very specific or interesting shows up, otherwise all the information is shown on the chart.
Thank you all for your support
🔎🔎🔎 ALWAYS REMEMBER
"A pattern IS NOT a Pattern until the breakout is completed. Before that moment it is just a bunch of colorful candlesticks on a chart of your watchlist"
═════════════════════════════
⚠ DISCLAIMER ⚠
Breakout Area, Target, Levels, each line drawn on this chart and any other content represent just The Art Of Charting’s personal opinion and it is posted purely for educational purposes. Therefore it must not be taken as a direct or indirect investing recommendations or advices. Entry Point, Initial Stop Loss and Targets depend on your personal and unique Trading Plan Tactics and Money Management rules, Any action taken upon these information is at your own risk.
═════════════════════════════
The 3 Step System + The #1 Catalyst In Stock TradingBuying is about positioning yourself
on a support level
when you look at this chart you
will notice that the price of
this stock NYSE:AR first crashed
I was listening to
commodity podcasts
And on this podcast, the experts kept talking about
the opportunity in the resources sector
and so I thought
I give it a shot and try to find
something
in the resources mining sector
just to test out my financial
skills in trading
and I have found
something
now what makes this one very good
is this #1 catalyst
Its called the earnings report
The earnings report is a very powerful catalyst
that you should consider
before you trade stocks
in the stock market
Because this report is a very powerful catalyst
that you can take advantage of
also I want you to look at the
rocket booster
strategy
which has 3 steps:
-The price has to be above the 50 EMA
-The price has to be above the 200 EMA
-The price should gap up
Now am looking at the pre-market price
and so you still have a chance to enter
your buy stop order
But you need to act fast fast
because once you miss this order the
price will react as step number 3
on the rocket boost strategy says
above
Rocket boost this content to learn more.
Disclaimer: Trading is risky, please
risk management and profit-taking strategies
also, feel free to use a simulation trading
account before you trade with real money
Swing longI'm deploying a multi-timeframe approach here, focusing on a swing trade setup that aligns with both trend and momentum indicators. Here's the core of the strategy:
Entry Criteria: I look to enter on a break above a recent higher high combined with a flat to rising 5-day moving average. Additionally, I’m observing the anchored VWAP from the most recent high (to the left on the chart); it should ideally be flat or rising to confirm sustained interest.
Volume and Price Requirements: Only trading stocks with at least 300,000 shares in daily volume and a price above $3, ensuring liquidity and relevance for momentum.
Trend Confirmation: On the daily timeframe, the stock must be making higher highs and fall within an early Stage 2 uptrend based on Stage Analysis, indicating the start of an uptrend.
Stop Loss: My stop is set just below a recent significant low (higher low) on the 30-minute chart to keep risk in check. If this low is penetrated before entry, I cancel the trade to avoid premature breakdowns.
Antero Resources | Chart & Forecast SummaryKey Indicators on Trade Set Up in General
1. Push Set Up
2. Range Set up
3. Break & Retest Set Up
Active Sessions on Relevant Range & Elemented Probabilities;
* Asian(Ranging) - London(Upwards) - NYC(Downwards)
* Weekend Crypto Session
Trend | Time Frame Conductive | Weekly Time Frame
- General Trend
- Measurement on Session
* Support & Resistance
* Trade Area | Focus & Motion Ahead
# Position & Risk Reward | Daily Time Frame
- Measurement on Session
* Retracement | 0.5 & 0.618
* Extension | 0.88 & 1
Conclusion | Trade Plan Execution & Risk Management on Demand;
Overall Consensus | Buy
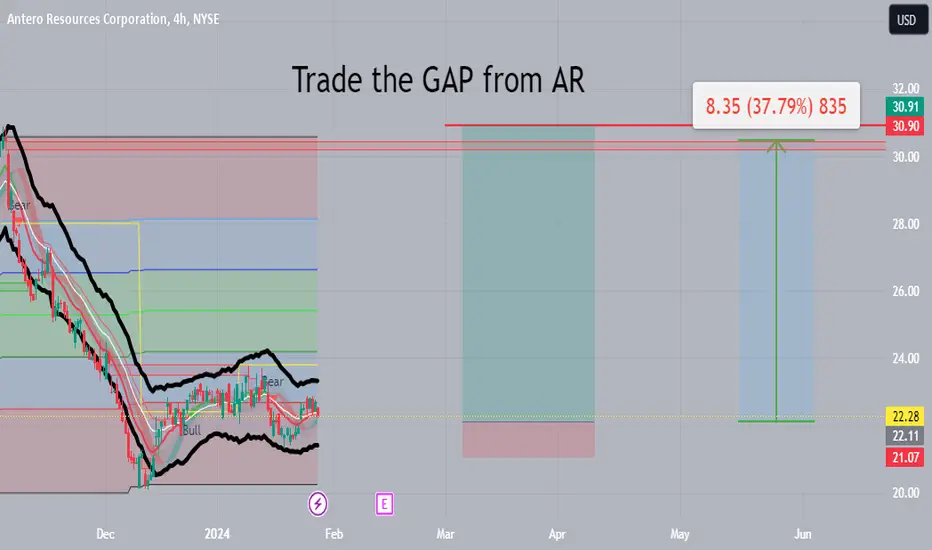
Antero Recources Trade the GAP LONGHello traders, I have found a long position. I currently see Antero Recources as a buy position. SL is safe, things continue to decline below that. Always look at the companies you invest in before buying, especially before selling. I can do a lot, but I'm not God and I can't foresee everything. Good luck
Long $AR Antero Resources (#tradingtheapocalypse)Fundamentals
This is a leveraged play on Natural Gas. Antero is one of the largest U.S. suppliers of gas to the global export market.
NatGas got destroyed in 2022-23, and arguably is forming a long-term bottom.
Technicals
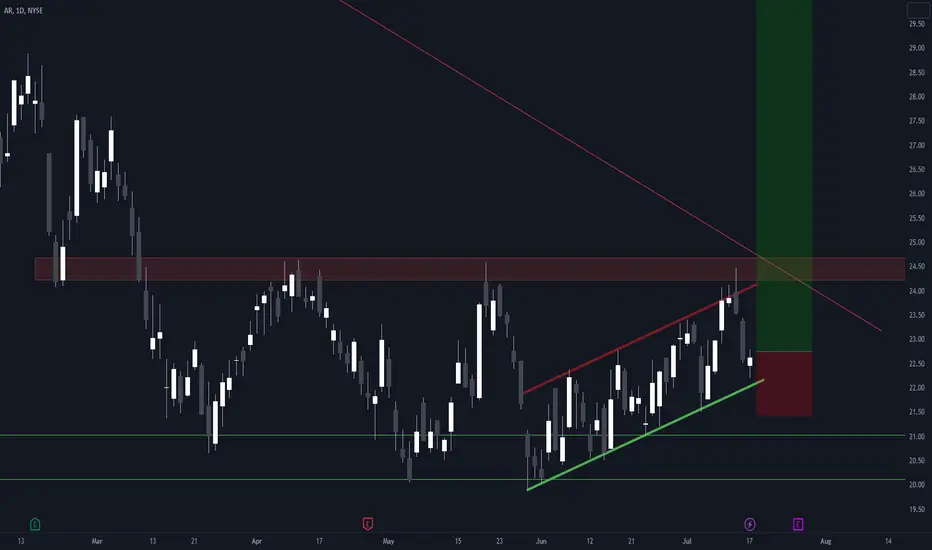
The weekly chart shows that NYSE:AR bounced from two-year-old support and printed bullish RSI divergence:
The daily chart that since the low, AR has been following a clear upward channel.
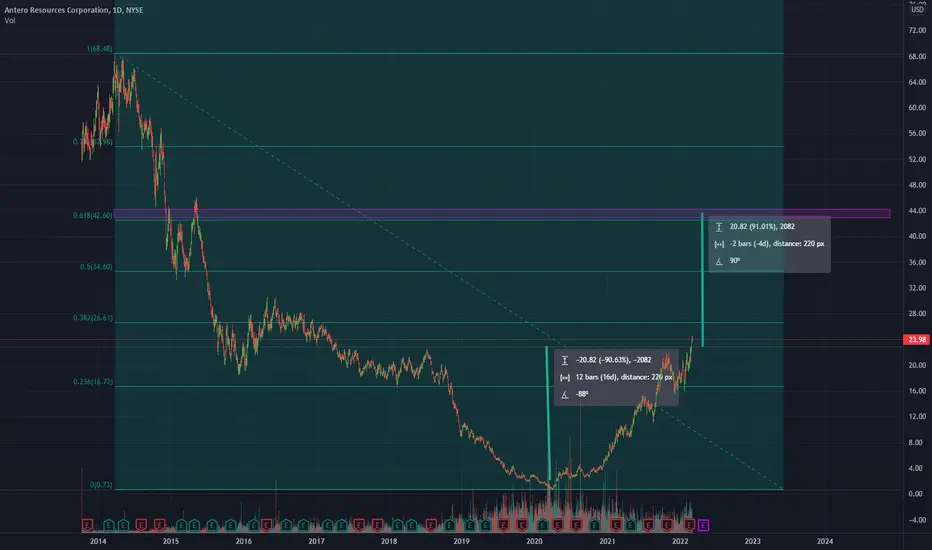
This trade is to buy within the bottom half of this channel, with a stop under the previous Low. This is a long-term trade. As for levels to exit or swing part of the trade, there are many, starting with strong resistance at the recent High at $24.50. I've arbitrarily chosen the absolute previous high as the end of this trade. Really, since it's a #tradingtheapocalypse trade, macro-economic conditions will determine when we exit.
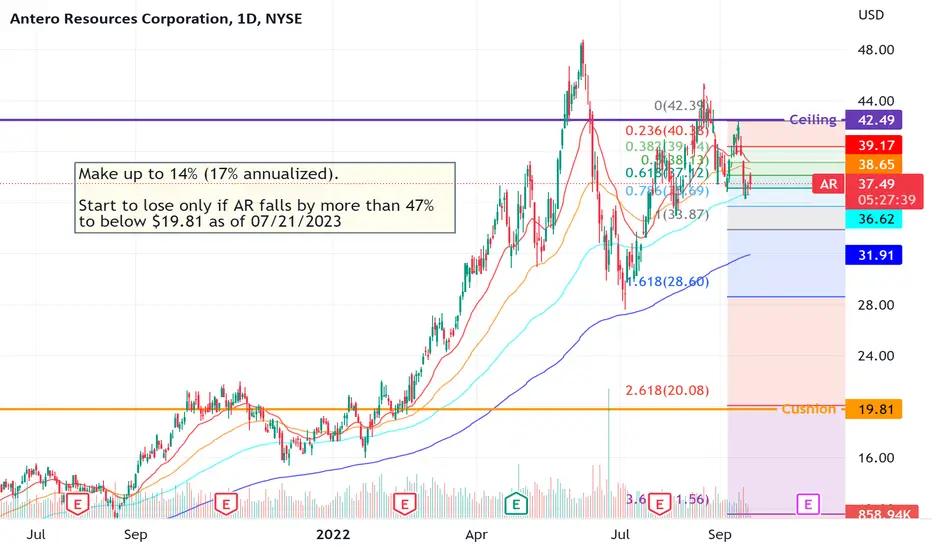
AR Hedged StrategyNatural gas producer and hydrocarbon exploration company Antero Resources has a market cap of $11.3B. Its stock followed the surge in energy prices this and last year, then corrected in June-July. With global shortages and an increased demand for natural gas (vs. oil), there's opportunity in energy long-term... but short-term uncertainty in this market.
Trading at 37.33 as of publication, we can take advantage of this possible low by setting the ceiling up to the 0 level and cushion all the way down to a bit below the 2.618 to minimize the chances of a loss while maintaining potential growth through expiration in July of next year. This will make up to 14.7% (17.9% annualized) but on the downside, also allow AR room to fall a generous 48% before breaking even.
Buy 1 $35 call
Sell 1 $40 call
Sell 2 $20 puts
Exp 7/21/23
Capital Required for the strategy: $3922.64
Probability of winning: HIGH