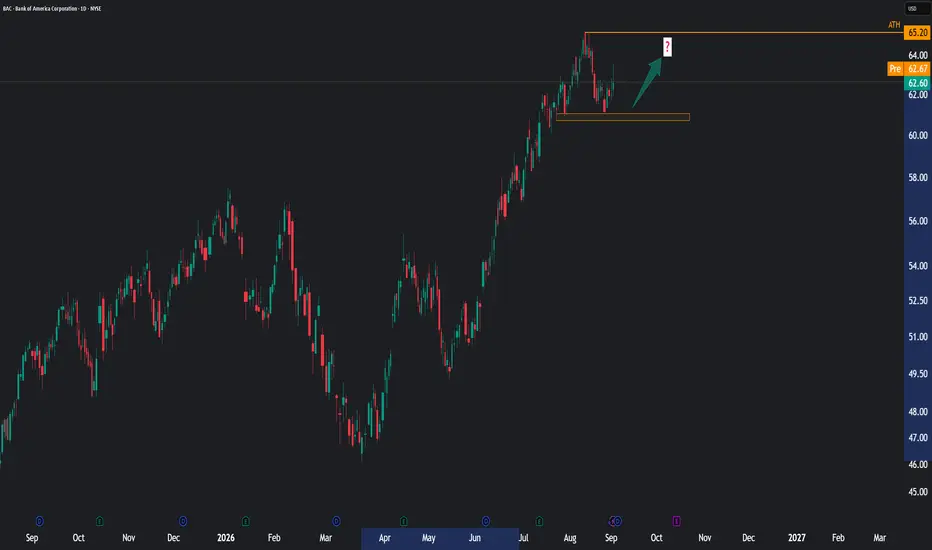
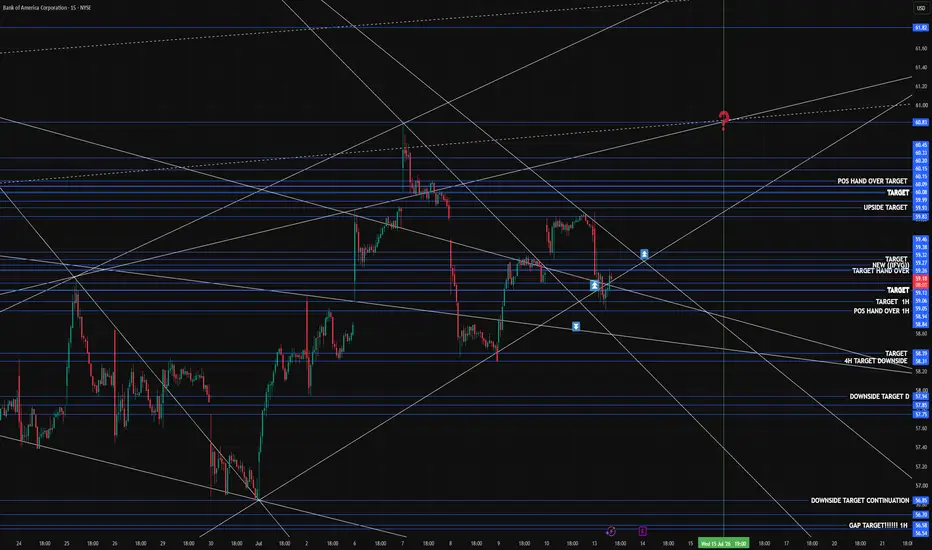
BAC – Silver Reclaimed, Share Position Opened | CSE Option DecisDate: 2026-09-15
Type: CSE Option Decision OS Update
Bank of America is now another live case inside our CSE Capital — Option Decision OS, also known as the Continuation Swing Engine.
Last Friday, we opened a small share position in BAC. The reason was not a blind buy signal, and it was not an emotional reaction to price movement. We measured the stock against the CSE dashboard and the structure was interesting enough for controlled share exposure.
The current CSE read shows a very specific picture:
Manual Action: HOLD / ADD WATCH
Underlying Thesis: THESIS INTACT
Tactical Status: TACTICAL REPAIR RECLAIMED
Add Status: EVALUATE RANGE — FEASIBILITY REQUIRED
Option Position: HOLD
Signal Confidence: 72/100
Decision Price / Current Quote: 59.67
Trend: Bullish
Next Zone: 61.95
Invalidation: 32.24
Decision Mode: Manual Only
Execution: Locked / Disabled
This is exactly why we built the CSE Option Decision OS.
A normal chart view might simply say: “BAC is bullish” or “BAC is moving higher.” But for options and structured exposure, that is not enough. CSE separates the underlying thesis, the tactical repair, the entry frontier, the add status, the option position, the risk gate and the portfolio decision.
For BAC, the dashboard shows that the thesis is intact and the trend is bullish. The tactical repair has been reclaimed, and the Current Entry Frontier shows SILVER RECLAIMED. That is important. The Silver range around 54.84–55.95 has already been reclaimed, which means BAC has moved beyond the active reclaim zone and is now approaching the next important area.
The next CSE roadmap zone is 61.95, with the Bronze range sitting around 61.40–62.51. That creates a very clear decision area. BAC is not sitting at deep support anymore. It is moving toward a higher validation zone where the market must prove whether this is real continuation or just a temporary extension.
That is why we started with shares first.
Not options.
Not aggressive leverage.
Not automatic buying.
A controlled share position gives us exposure to the thesis while keeping the decision flexible. If BAC continues toward the 61.95 area and confirms strength around the Bronze zone, the setup can become more interesting. But if price fails near that area, the position can still be managed without the same time decay pressure that comes with options.
The Structural Authority Ladder also supports the broader case:
Tactical Failure: 47.93
Tactical Repair: 49.23
Macro Survival Support: 39.25
Hard Invalidation: 32.24
The Macro Fib Thesis Lens reads:
Position Archetype: Bullish Continuation
Macro Fib Status: Certified Structural Thesis — Intact
Decision Posture: Evaluate Range — Feasibility Required
Reclaim Required: False
No Add Zone: False
Order Ready: False
That last line matters: Order Ready False.
This is the discipline inside CSE. The system can show a bullish trend, intact thesis and reclaimed structure, while still refusing to treat the setup as an automatic order. That is exactly the difference between a decision-support engine and a simple signal tool.
For BAC, the current decision is Hold / Add Watch. We already have a small share position, so the next step is not to chase. The next step is to monitor whether BAC can move into the 61.95 / Bronze validation area and hold that structure. Only then does the next decision become relevant.
For an options strategy, BAC still needs to pass the Option Feasibility + Risk Gate. That means checking premium size, liquidity, bid/ask spread, delta, expiry, time value, implied volatility, portfolio exposure, concentration risk and risk/reward before any option idea can become actionable.
The current BAC case is therefore about process.
The dashboard showed Silver Reclaimed.
The thesis remained intact.
The trend stayed bullish.
Tactical repair was reclaimed.
The next zone is clearly defined.
But CSE still requires feasibility review.
So the decision was simple: start with controlled share exposure, manage the position, keep options under review and do not chase.
This is the edge we are building with CSE Capital — Option Decision OS.
Not prediction.
Not hype.
Not emotional trading.
A structured decision system for options and equity exposure.
Structure first.
Confirmation second.
Feasibility third.
No chase, no emotion, only process.
Bank of America Corporation Non Cumulative Perpetual Conv Pfd Ser L
No trades
No trades
In-depth trading ideas
$BAC - wave (iv) in progress...The rally from 27 Aug was on low volume which strengthens the case for a b-wave of a developing Wave (iv). For this analysis to be right, NYSE:BAC will need to print a rejection candle at the Daily FVG zone ($63.20 – $63.60) to continue the correction down toward $59/$58 to complete Wave (iv). This entire wave (iv) correction could take us into late September or early October 2026.
A complete a-b-c correction for a daily Wave (iv) generally takes 3 to 6 weeks to unfold. Moving from the initial peak in mid-August through a late-September or early-October bottom aligns with typical daily-chart wave duration.
If BAC breaks and holds convincingly above the Daily FVG and the high (around $63.80 – $64.20), the thesis for a prolonged Wave (iv) depth is invalidated, increasing the likelihood that Wave (iii) is extending.
BAC – Basing Near Record Highs After a Strong UptrendBank of America (BATS:BAC) has rallied +25.9% over the past year on the weekly chart, pushing to a fresh all-time high of $65.23 in late August before pulling back to test support near $61.50–$61.70. Over the last week, price has been consolidating in a tight $61.70–$63.55 range just under the highs — reading as a healthy pause after an extended advance, not a breakdown.
Key levels:
Resistance / breakout trigger: $63.55 (recent swing high), then $65.23 (all-time high)
Support: $61.50–$61.70 (recent swing low, held on the retest)
Weekly trend: strongly bullish, no lower high printed yet
What to watch: A daily close above $63.55 would put BAC back in range to retest/break the $65.23 high. A break below $61.50 would open room back toward the prior consolidation zone. Until one of those levels gives, this looks like basing/continuation inside an intact uptrend rather than distribution.
Not financial advice — shared for educational/idea purposes only.
Bank of America (BAC) — Buyers Target $76Bank of America is showing a constructive bullish setup, with buyers maintaining the stronger position in the current market structure. The price action suggests that upside momentum can continue as long as key support areas remain defended.
The primary focus is on a move toward $76, which is the projected upside objective. A sustained hold above important support zones would strengthen the bullish scenario and could attract further buying interest toward the target.
From a fundamental perspective, Bank of America can benefit from a stronger banking environment, resilient economic activity, healthy credit conditions, and the potential impact of interest-rate expectations on net interest income and financial-sector sentiment.
Improving investor confidence toward large U.S. financial institutions can also support the stock's broader valuation.
The setup therefore remains focused on the buying side, with $76 acting as the key target. Short-term fluctuations are possible, but the broader thesis remains bullish while buyers continue to defend the structure.
📈 Bias: Bullish
🎯 Target: $76
🏦 Stock: Bank of America (BAC)
Manage risk and wait for confirmation before entering.
Is BAC Rebounding?Bank of America has been in a strong uptrend. Can the stock still push higher from here?
Is this just a healthy pullback within the trend, or are we looking at one final rebound before momentum fades?
Watch the key technical levels closely.
This is not financial advice. Always do your own analysis and manage your risk. I can be wrong.
Laurent - Private Investor
✅ DL INVEST | Community Leader
Has $BAC topped from 2007 lows This EW count with 5 as an ending diagonal would suggest NYSE:BAC has topped . In the very short term (not shown) we have a 5 wave down from the highs , The DeMark monthly chart (not shown for clarity) shows a 13 trend countdown exhaustion chart . This complements the NYSE:JPM chart which also has a monthly DeMark 13
BAC | May, 2026 | Continued stock growth- Timeframe: Weekly
- Trade type: Buy stop order
- Price: 52.50
- Take Profit: Open
- Stop Loss: 50.61 (-3.60 %)
Idea: Long on a breakout above last week's high — bullish momentum continuation.
Entry: Buy stop above last week’s high.
Stop-loss: Below the low of the same candle.
If the weekly candle closes below this level, the trade is invalidated.
Take Profit: Trailing stop following the lows of new weekly candles.
👉 Pionex | 200+ U.S. stock tokens | xStocks
Feel free to like and share your thoughts in the comments! ❤️
Position Sizing For Beginners The 1% RuleMost new traders decide how many shares to buy by asking "how much can I
afford?" That's the wrong question, and it's the one that ends accounts.
The right question is: how much am I willing to lose if I'm wrong?
The rule
Risk no more than 1% of your account on any single trade. Not 1% of the
position — 1% of the whole account.
The math
Say you have a $10,000 account. One percent is $100. That's your maximum
loss on this trade.
You've found a setup at $50, and the level where you're wrong — below the
swing low — is $47. Your stop distance is $3 per share.
$100 ÷ $3 = 33 shares.
That's your position. Not 100 shares because they're "cheap," not 200
because you feel good about it. Thirty-three, because that's the number
where being wrong costs you $100.
What this buys you
A string of losses stops being fatal. Lose five in a row at 1% and you're
down about 5% — annoying, survivable, and you still have a full account to
trade with. Size by gut instead and five losses can take a third of it.
One thing to watch
When your stop is very tight, the math will hand you a share count that
costs more than you have. If 33 shares at $50 is $1,650, fine. But a
fifty-cent stop on the same trade says 200 shares — $10,000, your whole
account. Risk-based sizing doesn't know about your cash. Cap it at what you
can actually pay for.
The 1% rule isn't about being timid. It's about staying in the game long
enough for your good trades to matter.
Educational only — not financial advice.
BAC: Triple Bearish Divergence at Rising SupportBank of America remains inside a broad ascending channel, but momentum is beginning to show signs of exhaustion.
Price continues to push higher while volume, RSI, and stochastics are all showing bearish divergence. RSI and stochastics are also elevated, adding to the case for watching for a potential pullback.
Short setup
I am not shorting simply because divergence is present. Price structure still needs to confirm.
My preferred trigger would be:
A daily break below the rising red support trendline
Followed ideally by a failed retest of that line from underneath
If that occurs, the primary downside target would be the lower boundary of the larger ascending channel.
Alternate entry
If BAC continues higher first, I would watch the upper resistance confluence for a possible rejection and secondary short opportunity.
Invalidation
A sustained breakout and close above the upper resistance confluence would invalidate the bearish thesis and favor continued upside within the broader channel.
Current read
The larger trend remains bullish, but the combination of bearish volume, RSI, and stochastic divergence suggests the advance may be losing momentum.
The trade is therefore conditional: wait for price structure to break before acting on the divergences.
💰 A LITTLE MORE DOWN AND THE FED WILL BEGIN TO SAVE THE BANKS 📣 Hello everyone!
I believe that the entire growth up to 2006 is the first impulse wave of the cycle, which stretched for about 33 years. From 2006 to 2009, the ABC zigzag in the wave of the second cycle adjusted the entire growth by -95%, pushing the price of Bank of America shares back 25 years.
I am now considering with a hypothesis the completion of the correction of the wave-the second cycle in 2009, and all subsequent market activity is part of a complex segmented impulse wave iii of the cycle.
Accordingly, I believe that the decline in the shares of the second bank in the United States, which began in 2022, will continue in 2023, and moreover, the decline has already begun. But according to the hypothesis I am considering, I am more inclined to believe that the downward trend, that is, this ABC zigzag will end in the area of wave-4, which is part of wave 3 of the higher intermediate level. After that, it would be logical to expect a trend reversal and the beginning of growth in the impulse wave-5 of the intermediate level with a goal of $ 62 per share approximately in 2024/2025.
The cancellation of the scenario I am considering will be a breakdown and consolidation below the level of $ 19.86, that is, the completion of wave-4 below this level. 😱 If the price is fixed below this level, it is likely that the fall may continue up to $ 2 per share, so it is worth paying attention to this key level now. ⚡️
⚠️ As always, I wish you good luck in making independent trading decisions and profit ✊
Goodbye!
BAC Bank of America Corporation Options Ahead of EarningsIf you haven`t bought BAC before the rally:
Now analyzing the options chain and the chart patterns of BAC Bank of America Corporation prior to the earnings report this week,
I would consider purchasing the 65usd strike price Calls with
an expiration date of 2027-6-17,
for a premium of approximately $4.30.
If these options prove to be profitable prior to the earnings release, I would sell at least half of them.
BAC. A financing boom, financing the AI boom. Probably.BAC is becoming a "picks-and-shovels financier" of AI
The AI boom requires enormous amounts of capital for:
+Data centers
+Power infrastructure
+Networking equipment
+Real estate development
+Debt issuance and structured finance
Rather, than betting on which AI model wins, BAC can earn fees and lending income from financing, the buildout itself. Bank of America. Example: recently served as structuring agent, plus advisor on a $16 billion, Oracle-related AI data, center project in Michigan.
AI capex may be measured in trillions
Bank of America's, own research recently raised its forecast, for the AI data center market, to about $1.7 trillion by 2030. If that estimate, is even directionally correct, there will be a massive need for debt financing, underwriting, treasury services, and capital markets activity.
Investment banking could reaccelerate
Large AI projects increasingly require:
+Bond issuance
+Syndicated loans
+Structured financing
+M&A advisory
Banks with large corporate relationship,s are positioned to collect fees, throughout the lifecycle of these projects. BAC is one of the few banks, with the scale to participate in the biggest deals.
The Banking Giants Are Back in Record TerritoryThe biggest U.S banks have kicked off earnings season with another impressive quarter. Strong trading activity, a rebound in investment banking, and resilient consumer spending pushed results above expectations, even as inflation, geopolitical tensions, and pressure on lending margins continue to create uncertainty beneath the surface
Banks generate revenue through two primary sources
💵 Net Interest Income (NII): This is the spread between the interest banks earn on loans such as mortgages and the interest they pay on customer deposits. Since it's the largest income source for most banks, changes in interest rates have a major impact on profitability
👔 Noninterest Income: This comes from fee based and market related businesses, including trading, investment banking, advisory services, payment processing, and account fees. Banks with a larger share of noninterest income are generally less exposed to swings in interest rates
Key themes from Q2 FY26
💰Record breaking quarter: America's largest banks outperformed expectations despite geopolitical tensions, including the Iran conflict, and persistent inflation. Trading operations were the biggest driver, delivering exceptional results. JPMorgan CEO Jamie Dimon even remarked that conditions are "getting close to as good as it gets"
🎰 Trading and investment banking steal the show: Volatile markets turned into a major opportunity. Equity trading desks posted outstanding results, with JPMorgan's equities revenue soaring 86% year over year. Meanwhile, a revival in mergers, acquisitions, and capital markets highlighted by the SpaceX IPO helped investment banking achieve its strongest quarter since 2021
🏦A widening gap in lending profits: While capital markets flourished, traditional banking painted a mixed picture. JPMorgan increased its full-year Net Interest Income outlook, but Bank of America, Citigroup, and Wells Fargo all faced pressure on net interest margins as deposit costs remained elevated. The era of effortless NII growth has faded, creating clear winners and losers.
💵 Shareholders continue to benefit: Strong earnings translated into generous capital returns. JPMorgan approved a new $50 billion share repurchase program alongside a 10% dividend increase. Wells Fargo bought back roughly $7 billion of stock during the first half of the year and raised its dividend by 11%, while Citigroup and Bank of America also continued returning significant capital. Healthy balance sheets are giving banks confidence to reward investors
🛢️Temporary relief on inflation:June CPI eased to 3.5% year over year, largely because gasoline prices fell 9.7% following the Iran ceasefire and the reopening of the Strait of Hormuz. However, that relief appears short-lived. After the ceasefire broke down on July 8, oil prices began climbing again, suggesting inflation could reaccelerate in July
📉 The consumer remains resilient but unevenly: Credit and debit card spending increased 9% year over year at both Bank of America and Wells Fargo, while loan-loss provisions came in below expectations, indicating consumers are still spending and keeping up with payments. However, executives continue to warn that lower-income households face increasing financial strain, reinforcing the growing divide between wealthier consumers and everyone else
🌋Warning signs remain: Despite delivering record profits, bank executives stressed that significant risks are still building. Jamie Dimon warned that geopolitical tensions, persistent inflation, widening fiscal deficits, and elevated asset valuations are "shifting below the surface like tectonic plates." Wells Fargo CEO Charlie Scharf added that today's favorable environment "does not go on forever."
America's largest banks delivered another record quarter, fueled by booming trading activity and a rebound in investment banking while continuing to return substantial capital to shareholders. Yet beneath the strong headline numbers, pressure on lending margins and persistent macroeconomic risks suggest the outlook remains far from risk free
BLUEPRINT MAPPING THE MARKETSI have reverse-engineered the exact timing patterns of the global financial markets. Think of it like a master "connect-the-dots" book. I have figured out exactly how to draw the lines that predict the absolute highest and lowest points of the day. Once my lines are drawn, the market routinely fills them in perfectly.
Bank of America Breaks Above Key ResistanceAs capital continues to rotate into the financial sector, many financial stocks are strengthening their uptrends, and BAC is among the key beneficiaries. The stock has broken above and successfully retested the $57 resistance level, reinforcing its bullish structure. BAC remains in a strong uptrend, making higher highs and higher lows while trading above its well-aligned 20-day and 50-day moving averages.
Bank of America Corporation is a $416.78 billion market-cap bank and financial holding company that provides a broad range of banking and non-banking financial services. The company operates through five segments: Consumer Banking, Global Wealth and Investment Management, Global Banking, Global Markets, and All Other.
Its businesses span consumer and small business banking, wealth management, investment advisory, lending, treasury solutions, underwriting, institutional sales and trading, and research across fixed income, currencies, commodities, and equities.
BAC is a wide-moat company, benefiting from its large low-cost deposit base, scale advantages, diversified operations, and strong brand. The company has delivered consistent revenue and EPS growth over the last three quarters. Operating and net margins stand at 34% and 28%, respectively, while ROE and ROIC are 11% and 5%. Its debt-to-equity ratio is 2.5x, although leverage metrics for large banks should be assessed within the context of the banking industry, where higher leverage is a normal component of the business model.
BAC Elliott Wave Bullish Sequence Supports Upside OutlookBank of America (BAC) has advanced to a new all‑time high, surpassing the January 5, 2026 peak at $57.55. This decisive breakout confirms the strength of the ongoing trend and highlights an incomplete bullish sequence from the April 2025 and March 2026 lows. The broader structure continues to favor the bullish view, reinforcing expectations for further upside momentum.
From the May 15, 2026 low, the rally is unfolding as a five‑wave impulse. Wave ((i)) concluded at $52.50, followed by a corrective pullback in wave ((ii)) that ended at $50.60. The advance in wave ((iii)) carried the stock to $57.98, as reflected in the intraday chart. Subsequently, wave ((iv)) unfolded as a zigzag correction and is proposed complete at $56.03. With that correction finished, the stock has resumed its upward trajectory.
As long as the pivot at $50.60 remains intact, dips should continue to find support in either three or seven swings. This behavior suggests that corrective moves will likely attract buyers and sustain the upward bias. The short‑term target can be projected using the 100%–161.8% Fibonacci extension from the March 19, 2026 low. That calculation produces a potential zone between $58.57 and $64.31. The alignment of the Elliott Wave structure with Fibonacci levels strengthens the bullish case and points to continued demand for Bank of America shares.
Bank of America: Potential Breakout Bank of America has been grinding higher as the broader market falls, and some traders may expect an acceleration to the upside.
The first pattern on today’s chart is the series of lower highs since early January. The lender ended yesterday above that falling trendline. It also registered its highest closing price in almost four months. Those signals could suggest prices are trying to break resistance.
Second, the 50-day simple moving average (SMA) is nearing a potential “golden cross” above the 200-day SMA. That may reflect an improved long-term trend.
Next, the 8-day exponential moving average (EMA) is above the 21-day EMA and MACD is rising. Those signals could reflect short-term bullishness.
Finally, BAC is an active underlier in the options market. (Its average daily volume of 191,700 contracts ranks 20th in the S&P 500, according to TradeStation data.) That could help traders take positions with calls and puts.
TradeStation has, for decades, advanced the trading industry, providing access to stocks, options and futures. If you're born to trade, we could be for you. Learn more here about TradingView’s Broker of the Year!
Past performance, whether actual or indicated by historical tests of strategies, is no guarantee of future performance or success. There is a possibility that you may sustain a loss equal to or greater than your entire investment regardless of which asset class you trade (equities, options or futures); therefore, you should not invest or risk money that you cannot afford to lose. Online trading is not suitable for all investors. View the document titled Characteristics and Risks of Standardized Options at www.TradeStation.com . Before trading any asset class, customers must read the relevant risk disclosure statements on www.TradeStation.com . System access and trade placement and execution may be delayed or fail due to market volatility and volume, quote delays, system and software errors, Internet traffic, outages and other factors.
Securities and futures trading is offered to self-directed customers by TradeStation Securities, Inc., a broker-dealer registered with the Securities and Exchange Commission and a futures commission merchant licensed with the Commodity Futures Trading Commission). TradeStation Securities is a member of the Financial Industry Regulatory Authority, the National Futures Association, and a number of exchanges.
TradeStation Securities, Inc. and TradeStation Technologies, Inc. are each wholly owned subsidiaries of TradeStation Group, Inc., both operating, and providing products and services, under the TradeStation brand and trademark. When applying for, or purchasing, accounts, subscriptions, products and services, it is important that you know which company you will be dealing with. Visit www.TradeStation.com for further important information explaining what this means.
BAC | Day chart | Ensign PeakEnsign Peak Advisors BAC position
.66% of portfolio
6.8. million sharesl; average cost $35.14
** T.A explained **
A Range = two or more consecutive color candles.
There are two types of ranges - accumulation and distribution.
DISTRIBUTION RANGES DEFINED: BackSide (BS) Candle - First distribution candle in a distribution range. Expectation = strong reaction to price. long wicks reaching to or away from level.
FrontSide (FS) Candle - Last distribution candle in a distribution range. Expectation = reversal, create a trend in the opposite direction. Distribution candles are used as support.
ACCUMULATION RANGES DEFINED:
Inverse BS (Inv.BS) - First Accumulation candle in an accumulation range. Expectation. = strong reaction to price. long wicks reaching to or away from level.
Inverse FS (Inv.FS) - Last accumulation candle in an accumulation range. Expectation = reversal, create a trend in the opposite direction. Accumulation candles are used as resistance.
Horizontal Ray tool on BS & FS levels are default support levels when dashed lines, tested when dotted lines and resistance when solid lines.
Horizontal Ray tool on Inverse BS & Inverse FS levels default as resistance and shown with a dashed line, tested when 1x dotted line, and support when solid line.
The inverse is true for the Inv. BS Inv. FS levels, they are resistance as dashed lines, tested as dotted and support as solid lines.
Monthly timeframe is color pink
weekly grey
daily is red
4hr is orange
1hr is yellow
15min is blue
5min is green if they are shown.
strength favors the higher timeframe.
Bank of America Might Be Stalling at ResistanceBank of America made a record high early this year, but the strength could be fading.
The first pattern on today’s chart is the $55.08 level. It was the previous all-time high in 2006 before the financial crisis. BAC briefly traded above it in early January but has been sliding since.
Second, its resulting lower highs since that failed breakout could be viewed as the beginning of a new downtrend.
Third, the 50-day simple moving average (SMA) had a “death cross” below the 200-day SMA on April 1. That could also be consistent with a longer-term downtrend.
Next, MACD is falling.
Finally, BAC is an active underlier in the options market. Its average daily volume of 113,000 contracts ranks second among financials, according to TradeStation data. (Citi leads.) That could help traders take positions with calls and puts.
TradeStation has, for decades, advanced the trading industry, providing access to stocks, options and futures. If you're born to trade, we could be for you. Learn more here about TradingView’s Broker of the Year!
Past performance, whether actual or indicated by historical tests of strategies, is no guarantee of future performance or success. There is a possibility that you may sustain a loss equal to or greater than your entire investment regardless of which asset class you trade (equities, options or futures); therefore, you should not invest or risk money that you cannot afford to lose. Online trading is not suitable for all investors. View the document titled Characteristics and Risks of Standardized Options at www.TradeStation.com . Before trading any asset class, customers must read the relevant risk disclosure statements on www.TradeStation.com . System access and trade placement and execution may be delayed or fail due to market volatility and volume, quote delays, system and software errors, Internet traffic, outages and other factors.
Securities and futures trading is offered to self-directed customers by TradeStation Securities, Inc., a broker-dealer registered with the Securities and Exchange Commission and a futures commission merchant licensed with the Commodity Futures Trading Commission). TradeStation Securities is a member of the Financial Industry Regulatory Authority, the National Futures Association, and a number of exchanges.
Options trading is not suitable for all investors. Your TradeStation Securities’ account application to trade options will be considered and approved or disapproved based on all relevant factors, including your trading experience. See www.TradeStation.com . Visit www.TradeStation.com for full details on the costs and fees associated with options.
Margin trading involves risks, and it is important that you fully understand those risks before trading on margin. The Margin Disclosure Statement outlines many of those risks, including that you can lose more funds than you deposit in your margin account; your brokerage firm can force the sale of securities in your account; your brokerage firm can sell your securities without contacting you; and you are not entitled to an extension of time on a margin call. Review the Margin Disclosure Statement at www.TradeStation.com .
TradeStation Securities, Inc. and TradeStation Technologies, Inc. are each wholly owned subsidiaries of TradeStation Group, Inc., both operating, and providing products and services, under the TradeStation brand and trademark. When applying for, or purchasing, accounts, subscriptions, products and services, it is important that you know which company you will be dealing with. Visit www.TradeStation.com for further important information explaining what this means.
Bank of America | Technical signal: Bull FlagBank of America | Technical signal: Bull Flag
Short Thesis:
• Bank of America reported strong Q1 2026 earnings with EPS beating estimates by 10%, revenue growing 7% YoY, and net interest income guidance raised to 6-8%.
• A textbook bull flag consolidation is forming after the recent rally.
• Chart positioning near $52.50 support with institutional bid intact.
• Wall Street consensus remains "Strong Buy" with $60.61 average price target (13% upside).
The setup:
Uptrend from March lows with controlled consolidation forming a flag pattern. After breaking out of initial resistance, BAC pulled back into a tighter flag channel, indicating accumulation. May 4 shareholder meeting confirmed board continuity and strong investor backing. 52-week range $41.25 to $57.55 sets clear zone targets. Dividend yield (2.09%) provides income cushion while waiting for breakout confirmation.
Key catalysts:
✅ Q1 earnings beat with 290bps operating leverage on 7% revenue growth YoY
✅ NII guidance raised to 6-8% for full-year 2026, signaling confidence in rate environment
✅ Strong capital position (CET1 healthy) with $3.5T balance sheet provides strategic flexibility
✅ Defense financing push and rising corporate deal flow boosting investment banking revenues
The chart tells the story:
Flag consolidation is complete and clean. Support holding at the $52.50 level (flag pole base). Volume profile suggests institutional accumulation during the recent pullback. Technical setup screams confirmation trade, not prediction play. Break above $54.20 with volume triggers momentum cascade into Q2 positioning.
Risk/reward is tilted bullish heading into Q2 earnings:
Next earnings call: July 14, 2026
TradingView:
Target 1 (52-week high): $57.55
Target 2 (Wall Street consensus): $60.61
➖➖➖
⚠️ This is not financial advice. Do your own research.
Short Bank of America as $54 resistance caps near-term upside:Current Price: 53.91 (Analysis was generated on Monday Morning)
Direction: SHORT
Confidence level: 45%(Mixed trader sentiment and low social volume, but price is pressing into a well-watched resistance zone around $54-$55 which increases probability of a short-term pullback.)
Targets
Target 1: 52.80
Target 2: 51.80
Stop Levels
Stop 1: 54.80
Stop 2: 55.60
Key Insights:
Here's what's driving this setup. Bank of America just posted strong earnings with EPS around $1.11 and strong trading revenue growth. Fundamentally that’s supportive for the stock, and analysts broadly expect higher prices over time with targets around the high‑$50s to low‑$60s.
But short‑term trading setups don’t always follow the long‑term story. Right now BAC is sitting just below a resistance band around $54–$55 that traders keep mentioning. The stock is also only a few percent below its recent highs near $57, which means a lot of investors may start locking in gains if momentum stalls.
Another thing catching my attention: social sentiment is thin. Only a handful of relevant market discussions appeared across trading platforms, and opinions are split. When conviction is low and price is near resistance, short‑term pullbacks tend to happen more often than breakouts.
Recent Performance:
BAC has been in a steady recovery move over the past few weeks, climbing from the high‑$40s in late March to the current $53–$54 area. That’s a solid run for a large bank stock in a short window. However, momentum slowed as price approached the $54–$55 zone, which has acted as intraday resistance multiple times recently. The stock is also approaching the upper part of its yearly range near $57.55.
Expert Analysis:
Several professional traders I track are focusing on the same technical story: strong fundamentals but stretched short‑term price action. When a stock rallies quickly into resistance without heavy momentum behind it, traders often expect a cooling period.
What's interesting is that many traders still like BAC as a longer‑term financial sector play due to improving trading revenue and wealth management growth. But their short‑term approach is different — many are waiting for either a pullback toward support or a confirmed breakout above $55 before getting aggressive.
News Impact:
Recent news has been mostly positive. Bank of America beat Q1 expectations thanks to strong equities trading, higher net interest income, and solid wealth management fees. Analysts across major banks raised price targets, with some forecasts reaching $60–$65.
That’s bullish for the bigger picture. The catch is that good news often gets priced in quickly. After earnings optimism pushes price toward resistance, short‑term traders frequently fade the move while waiting for the next catalyst.
Trading Recommendation:
Putting it all together, this looks like a short‑term tactical SHORT setup rather than a long‑term bearish call. Price is pressing into a resistance zone near $54–$55 with mixed trader sentiment and fading momentum. I’d consider a short entry around current levels with a first downside target near $52.80 and an extended move toward $51.80 if sellers step in.
Risk management matters here. If BAC breaks above $54.80 and especially above $55.60, the resistance thesis likely fails and a breakout toward $57 could follow. That’s why the stops sit above that level.
For position sizing, I’d keep exposure moderate given the mixed signals — around half of a normal trade size until direction becomes clearer.